HAL Id: hal-02429379
https://hal.archives-ouvertes.fr/hal-02429379
Submitted on 8 Jul 2020
HAL is a multi-disciplinary open access
archive for the deposit and dissemination of
sci-entific research documents, whether they are
pub-lished or not. The documents may come from
teaching and research institutions in France or
abroad, or from public or private research centers.
L’archive ouverte pluridisciplinaire HAL, est
destinée au dépôt et à la diffusion de documents
scientifiques de niveau recherche, publiés ou non,
émanant des établissements d’enseignement et de
recherche français ou étrangers, des laboratoires
publics ou privés.
GeTe Switches
Alexandre Leon, Bruno Reig, Etienne Perret, Florence Podevin, Damien
Saint-Patrice, Vincent Puyal, Jose Lugo-Alvarez, Philippe Ferrari
To cite this version:
Alexandre Leon, Bruno Reig, Etienne Perret, Florence Podevin, Damien Saint-Patrice, et al.. RF
Power-Handling Performance for Direct Actuation of GeTe Switches. IEEE Transactions on
Mi-crowave Theory and Techniques, Institute of Electrical and Electronics Engineers, 2019, pp.1-14.
�10.1109/TMTT.2019.2946145�. �hal-02429379�
Abstract—The study presented in this paper concerns Telluride
Germanium Phase Change Material based switches, actuated via direct heating and arranged through two configurations: series or shunt. It is concluded that direct heating is a performing solution for amorphisation, preventing from heater ageing. Then, the switches configurations are compared in terms of RF performance, power handling and linearity. Some design rules are derived from empirical data, consolidated with thermal simulations. It is expected that either in series or shunt configuration, a large, thick and short GeTe in an optimized capacitive environment is preferable, for higher isolation in shunt configuration and for lower insertion loss in series one. The Figure-of-Merit, as cut-off frequency, is 11 and 21 THz for shunt and series configurations, respectively. In terms of power handling of amorphous GeTe, results confirm the existence of a threshold voltage leading to better handling for longer switches, in both configurations. For crystalline GeTe, design rules that link the maximum current through the switch before failure, to geometry, are derived for the very first time. Current is proportional to width, to the square root of thickness, and inversely proportional to length. The shunt configuration presented herein holds 31 dBm at ON-state and more than 35 dBm at OFF-state while the series configuration holds 27 dBm at ON-state and 32 dBm at OFF-state. For power handling, there exists a balance between series and shunt with a ratio of 4 in crystalline phase and of 0.25 in amorphous phase.
Index Terms—Direct heating, GeTe, phase-change material,
power-handling, RF switches.
I. INTRODUCTION
ITH the evolution of communication means worldwide, it is necessary to develop applications, circuits and bottom level components that can address the future needs for the next generations of mobile networks. Within those networks, at the front-end modules (FEM) level, switches play a fundamental role for reconfigurability. This role is even strengthened with the incoming of massive multiple input multiple output (MIMO) systems and the principle of aggregation that appeared with 4G and that will be strengthened for next 5G. Switches will also be a must for low-consumption passive beam-forming systems based on phase shifters, for 5G but also for automotive radars and more generally for any
point-Manuscript received …
A. Leon, B. Reig, D. Saint-Patrice, V.Puyal, J. Lugo-Alvarez are with Univ. Grenoble Alpes, CEA, LETI, F-38000 Grenoble, France. E. Perret is with Univ. Grenoble Alpes, Grenoble INP, LCIS, F-26000 Valence, France and Institut
to-point communications.
In that context, Phase Change Material (PCM) switches constitute a recent and reliable approach to challenge MEMS, MOS transistors, PIN diodes or even a more recent technology that is based on Conductive-Bridge (CB). From a circuit point of view, performing switches need low insertion loss (IL), outlined by a low ON-state resistance 𝑅𝑂𝑁, and high isolation, outlined by a low OFF-state capacitance 𝐶𝑂𝐹𝐹. As a trade-off, the cut-off frequency 1/(2𝜋𝑅𝑂𝑁𝐶𝑂𝐹𝐹) is the major Figure-of-Merit (FoM) for switches:
𝐹𝑜𝑀 = 1/(2𝜋𝑅𝑂𝐹𝐹𝐶𝑂𝑁) (1) but switching time, power consumption, DC bias voltage, reliability, and cost also play a significant role.
CMOS and BiCMOS technologies are limited by their ON-state resistance 𝑅𝑂𝑁, which leads to pretty high insertion loss. A switch achieving a cutoff frequency of 1.4 THz (𝑅𝑂𝑁 = 0.5 Ω) was presented in [1] in a SOI technology. However, the low 𝑅𝑂𝑁 value was achieved at the expense of the surface on the die, with a width equal to 1 mm, leading to high cost. JFET [2], MOSFET [3], HEMT [4] or SOS [5] lead to comparable performance. MEMS switches are very good candidates for low insertion loss with a value of 0.25 dB at 40 GHz [6] and OFF-state capacitance lower than 10 fF, but their reliability and packaging is time consuming as it had already been stated in 2003, [7]. CB technology, inspired from CBRAM, constitutes a promising technology as mentioned in [8]. For example, in [9], at low-RF, a very simple PCB-based process proved interesting performance at very low-cost. In [10], potentially integrated nanoscale memsresistive switches offered incredibly high electrical performance from RF to mm-waves, under low energy (~pJ) and reaching a FoM of 35 THz. However, the nanoscale filament was created through an air gap and the question of maintaining a reliable air-gap in an integrated silicon process still remains. Also, the presence of gold is up to now an issue. Nanoscale memsresistive switch constitutes a serious competitor to PCM but the technology easiness seems to be in favor of the latter.
PCM have been studied in many research groups, and several publications have already shown that their electrical performance compete and often overcome the current
state-of-Universitaire de France, 75005 Paris, France. F. Podevin is with Univ. Grenoble Alpes, Grenoble INP, RFIC-Lab, F-38031 Grenoble, France. P. Ferrari is with Univ. Grenoble Alpes, RFIC-Lab, F-38031 Grenoble, France.
RF Power-Handling Performance for Direct
Actuation of GeTe Switches
A. Léon, Member, IEEE, B. Reig, E. Perret, Senior Member, IEEE, F. Podevin, Member,
IEEE, D. Saint-Patrice, V. Puyal, J. Lugo-Alvarez, P. Ferrari, Senior Member, IEEE
the-art of the devices described above. Several PCM as Germanium Telluride (GeTe) [11]-[14], Germanium Antimony Telluride (GeSbTe) [15], and Germanium Antimonide (GeSb) [16] have been developed.
Basically, the electrical switching consists in a change of the structural phase of the material obtained through a gradient of temperature. Based on the structure represented in Fig. 1, heating may be induced by a direct contact to the RF paths, as in [12] where an electrical signal flows through the signal strip disrupted by the presence of the PCM. As a consequence, a DC current flow can be used to control the switch state.
Heating may also be indirect. In that case, electrical signal heats an intermediate highly resistive material that transfers its calorific energy to PCM via Joule effect [11]. In both cases, phase change induces an important resistive transition in the material. Its electric conductivity increases from less than 10 S/m, in its amorphous phase (high resistivity phase), to more than 100 kS/m in its crystalline phase (low resistivity phase). Usually, the resistance ratio between ON- and OFF- states ranges around 105 that is high enough to perform low insertion
loss at ON-state and high isolation at OFF-state when PCM has been properly dimensioned.
From a technological point-of-view, there is more complexity in the design of indirectly heated PCMs as their implementation require an intermediate material and an extra metallic layer (heater) to convey electrical excitation. What’s more an early ageing of the heater is usually observed, due to the high temperature necessary for changing PCM from one phase to another. Therefore, their reliability still has to be proven.
Direct heating is much simpler to implement but was not thoroughly studied up to know. In particular, a high RF power signal may have a negative impact on the physical PCM structure. This could be a limitation in some applications and power-handling as well as self-activation must be studied for direct heating. Works on direct heating PCM switches, [12], are not numerous and, to the authors’ knowledge, power handling is never addressed. More generally, whatever heating is, no power handling study discusses about the influence of GeTe geometry (width, length and thickness of GeTe), and there is no comparison between series and shunt configurations. In that context, this paper claims, for the very first time, a geometrically based parametrical study on power handling confirmed by qualitative multi-physics thermal simulations, thus enabling to 1) propose design rules for PCM switches, 2) evaluate the performance of direct heating, 3) compare two different configurations of switches, series or shunt.
The paper is organized as follows. In part II, a brief technology description presents a new generation of GeTe switches, as compared to the previous ones presented by the authors in [17]. Two configurations are introduced, series and shunt. The direct electrical actuation is discussed. Then, in part III, RF small signal analysis compares the two configurations for both switching states, and in terms of FoM. Part IV is dedicated to large signal analysis. Power handling is studied, still for both configurations, with its parametrical analysis confirmed by thermal simulations. Linearity is also analyzed.
Part V compares results to the state-of-art before concluding in part VI with a discussion concerning design choices.
II. GERMANIUM TELLURIDE BASED SWITCH A. Technology Description
The switch layout and process stack are described in Fig. 1. The flow developed so far fulfills two requirements: standard CMOS process compatibility and switching electrical performance. First, compatibility of the materials and techniques with a standard CMOS back-end-of-line (BEOL) has been considered for further integration. For instance, neither platinum, nor gold were used, but only aluminum and standard RF silicon materials. Second, different technological stacks were tested to enhance the PCM switching electrical performance. As shown in Fig. 1c, the PCM was contacted backside using metallic microstrip lines that optimize electrical contact. Following a strict process flow, aluminum feeding microstrip lines for backside contact were first patterned on a high-resistivity silicon (HR-silicon) wafer, after thermal oxidation. Next, GeTe was deposited in a co-pulverization step and patterned with dry etching (RIE). This process allows defining uniform patterns with widths as low as 250 nm. Then a 100-nm thick PECVD SiN dielectric was deposited to cover and protect the GeTe. A second level of metallic microstrip lines, etched with a standardized RIE process, was deposited to contact the first one. Finally, PECVD SiO2 was deposited for
passivation and test pads were opened by RIE.
Fig. 1 focuses on two configurations of the GeTe either in series (Fig. 1a) or in shunt with two devices in parallel (Fig. 1b). The close-up micrograph of the series switch in ON-state (Fig. 1a) shows the light color of the crystalline GeTe. Fig. 1c represents the technological stack.
Fig. 1. Microscope image of the PCM switch. (a) Series configuration.
W = 19 µm, T = 300 nm, L = 1 µm. (b) Shunt configuration Two PCM in
parallel, W = 16 µm, T = 300 nm, L = 1 µm. (c) Technological stack.
L 100 µm 54 µm C. RF IN RF OUT GND GND GND GND 100 µm b. d. W a. A A A-A GeTe SiN AlCu SiO2 Si Heater c. DC Term for COMSOL Simulation I L 100 µm 54 µm C. RF IN RF OUT GND GND GND GND 100 µm b. d. W a. A A A-A GeTe SiN AlCu SiO2 Si Heater c. DC Term for COMSOL Simulation I L 100 µm 54 µm C. RF IN RF OUT GND GND GND GND 100 µm b. d. W a. A A A-A GeTe SiN AlCu SiO2 Si Heater c. DC Term for COMSOL Simulation I (a) (b) (c) W L
B. Electrical Actuation
Direct heating can be performed very easily through this technological stack. A voltage pulse-shape signal is simply applied between the two ports RF IN and RF OUT (as defined in Fig. 1) to induce a change in the phase of the PCM.
In previous literature, different excitation shapes were used in order to get phase change, enabling freezing in a messy state for amorphization or re-arrangement and stabilization of the atomic crystal for crystallization, [11]. In this study, for the very first time, a unique pulse shape has been optimized to control both phase changes. Only the voltage level has been modified. From a material point-of-view, a two-step process is needed to amorphize the crystalline phase: the PCM has first to be melt, and second to be tempered. The melting temperature to break connections between atoms is reached at 700°C. A 5-ns rise time, 50-ns duration time and 5-ns fall time pulse of tension is used for that purpose. Fig. 2, part A, shows that the melting point is reached in less than 20 ns. The first order response of the switch is due to the presence of parasitic capacitors in the circuit, so that the 20-ns duration time to amorphize the material is clearly overestimated. As GeTe electrical conductivity in the liquid melting phase is higher than in the crystalline one, voltage at the switch electrodes decreases until the steady state regime is reached (Fig 2, part B). Then, a thermal tempering occurs to freeze GeTe (Fig. 2, part C) into a messy state (Fig. 2, part D). Tempering is a fast operation but capacitive effect still implies an apparent 20-ns duration time.
Note that the DC current necessary to amorphize the PCM is 700 mA which is higher than for indirect systems: 60 mA in [11] or 9 mA in [12], but with a significantly lower voltage:
4.5 V whereas 8.5 V were needed in [12] and 20 V in [11], respectively.
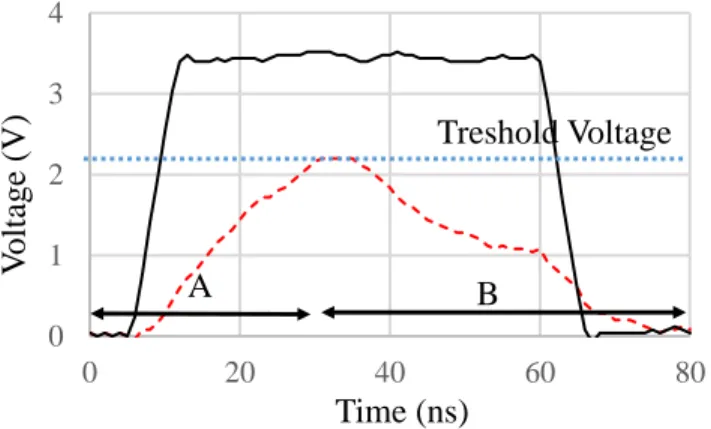
Within indirect heating, crystallization is known to be the most energy consuming phase transition because of the time needed to re-arrange atoms in a periodic pattern [11]-[14]. Within direct heating, a different physical phenomenon occurs during PCM crystallization. The principle is based on the possibility to create a conductive filament through direct actuation, which for a given geometry is only depending on the level of the voltage applied via the RF IN and OUT ports, named as threshold voltage, 𝑉𝑇𝐻, as in [18]. It is somewhat a misnomer in the literature that 𝑉𝑇𝐻 is given in V/µm as any disruptive electric field. In this paper, the disruptive electric field will be written 𝐸𝑇𝐻 while 𝑉𝑇𝐻 equal 𝐿. 𝐸𝑇𝐻. Once threshold voltage has been reached, an almost instantaneous crystallization occurs. As aforementioned, the same pulse shape as applied for amorphization is used for crystallization, i.e. a waveform with 5-ns rise time, 50-ns duration time and 5-ns fall time. This is the reason why this technique can reduce significantly the switch power consumption as compared to indirect heating. Fig. 3 shows that the filament is created at 30 ns, for a voltage at the GeTe electrodes equal to 2.15 V. Then, a voltage drop occurs due to an evolution of the GeTe conductivity. Phase change is reached; material is in its crystalline phase (Fig. 3, part B). Threshold voltage is considered as an intrinsic limitation. Its impact has been discussed in [12] and [18] where a pondering between threshold voltage and breakdown RF power was proposed when dealing with RF power handling. A deep insight analysis concerning this phenomenon is proposed here with the introduction of analytical equations that could help for design by considering not only the FoM given by the cut-off frequency but also power handling. Notably, power handling should depend on the switch configuration series or shunt. These specific issues will be discussed in section IV.
To conclude about direct actuation, Table I compares direct and indirect heating in terms of the total consumed energy per PCM volume per cycle (corresponding to an ON-OFF transition followed by an OFF-ON transition). Direct heating is very efficient to reduce energy consumption. Particularly, the main advantage of direct heating is for crystallization, as the creation of a conductive filament is a shorter phenomenon than a long thermal re-arrangement approach. Here, series direct heating consumes 330 nJ/µm3 per cycle, mainly for amorphisation,
whereas series indirect heating as presented in [11] and [12] consumes 2.5 times more. Shunt configuration, where two devices are in parallel, has not been measured but should obviously consume twice than the series one, due to
Fig. 2. Pulse generator voltage versus time for amorphization. Voltage at the pulse generator electrodes (solid line) and at the PCM switch electrodes (red dotted line). Part A: GeTe in crystalline phase. Part B: melting. Part C: tempering. Part D: GeTe is amorphized. Switch under test is the one of Fig. 1a, with W = 19 µm, T = 300 nm, L = 1 µm. 0 2 4 6 8 0 20 40 60 80
V
olt
age
(
V)
Time (ns)
A
B
C
D
TABLEI.SUMMARY OF MEASUREMENT RESULTS
Paper Actuation ON-state DC resistance (Ω) Size : 𝑾* (µm), 𝑳 (µm), 𝒕 (nm) Insertion Loss (dB) @10 GHz/ @40 GHz Isolation (dB) @10 GHz/ @40 GHz Cut-Off Frequency (THz) Switching time (ns) per cycle Pmax (dBm) OFF-state Pmax (dBm) ON-state Energy consumption (nJ/µm3) per cycle [11][18] - Series Indirect ≈ 1 30, 0.9, 110 ≈ 0.1 / ≈ 0.1 >20 / ≈ 10 ≈ 11 1.6 .103 28.5 >28.5 820 [12] - Series Indirect 3.9 12, 0.6, 250 ≈ 0.4 / < 0.5 ≈ 22 / > 18 ≈ 4 404 .103 > 20 - 845 [14] - Series Indirect 2.4 50, 2, - ≈ 0.25 / 0.5 > 28 / > 15 ≈ 11 37.4 40 690 This - Series Direct 1.1 19, 1, 300 ≈ 0.15 / ≈ 0.15 >26 / > 12 ≈ 21 2 X 60 27 32 330 This - Shunt Direct 5.0 2x16*, 1, 300 ≈ 0.4 / ≈ 0.5 >30 / > 25 ≈ 11** 2 X 60 31 > 35 660***
amorphization, as dimensions are almost doubled (19 µm series against 2X16 µm shunt are compared in Table I).
III. SMALL SIGNAL ANALYSIS
In order to model the switch, either in a series or in a shunt mode, S-parameters measurements have been carried out from 40 MHz to 40 GHz using RF-probes (Z-probes) with a 150-µm pitch, on a measurement set-up composed of a semi-automatic probe station linked to a ANRITSU ME7808C vector network analyzer. SOLT (Short, Open, Load, Thru) calibration was performed. Prober shows termination loads of 50 Ω.
Fig. 4 gives the electrical equivalent circuit of the switch in series (Fig. 4.a) or in shunt (Fig. 4.b) configuration. Be careful that ON-state refers to the switch state while GeTe phase is described as amorphous or crystalline. As a general rule, R equals 𝑅𝑂𝑁 (𝑅𝑂𝐹𝐹 respectively) referring to the PCM resistance at the ON- (OFF- respectively) state of the switch. For series configuration, 𝑅𝑂𝑁 is the very low resistance obtained for crystalline GeTe whereas 𝑅𝑂𝐹𝐹 is the five or six orders of magnitude higher resistance obtained for amorphous GeTe. 𝐶𝑂𝐹𝐹 is the parallel capacitance, observable during OFF-state only. For shunt configuration, this is the contrary. 𝑅𝑂𝐹𝐹 is the very low resistance of the crystal whereas 𝑅𝑂𝑁 is the five or six orders of magnitude higher resistance obtained for amorphous PCM. 𝐶𝑂𝑁 is the parallel capacitance, observable during ON-state only. 𝐿// models the inductive effect of the extra widths coming out from ground strips and necessary to contact the parallel PCMs, as in Fig. 1b. This model is somewhat similar to that proposed in [19] for parallel PCM with a slight change in the position of 𝐿//, in series with the parallel R-C, much more suited to our devices.
The widths of the central and ground strips of the feeding lines on both sides of the PCM are 100 µm, with a gap separation equaling 54 µm. These dimensions correspond to a 50-Ω characteristic impedance 𝑍0. As shown in the inset of Fig. 1a, the central strip reduces to 20 µm in the GeTe area; the gap reduces as well to maintain a 50-Ω characteristic impedance. For the shunt RF switch, the feeding lines stay the same but the central strip is simply not cut.
Results up to 40 GHz are given in Fig. 5 for both configurations. Note that the loss due to the matched feeding lines has been de-embedded at anytime.
For serial configuration, insertion loss at ON-state is lower than 0.15 dB up to 40 GHz and almost constant over the whole frequency band. A simple 𝑅𝑂𝑁 (ON-state resistance) with a value of 1.1 Ω can be used as an equivalent circuit. An isolation at OFF-state higher than 14 dB, up to 40 GHz is observed. The equivalent electrical model for the OFF-state corresponds to a parallel RC circuit with a resistance 𝑅𝑂𝐹𝐹 of 100 kΩ and a capacitance 𝐶𝑂𝐹𝐹 of 6.8 fF. This leads to a cut-off frequency equal to 21 THz, at the state-of the art to the authors’ best knowledge, as shown in Table I.
For shunt configuration with two parallel shunt PCMs, performing results are also achieved up to 40 GHz with an isolation at OFF-state better than 24 dB corresponding to 𝑅𝑂𝐹𝐹 = 0,7 Ω in series with 𝐿// ~ 7 fH. At ON-state, insertion loss varying between 0.4 and 0.5 dB over the whole band enable to evaluate the ON-capacitance as 𝐶𝑂𝑁 = 20 fF. Meanwhile there is no sensitivity on the extraction of 𝑅𝑂𝑁, that can be thus neglected in the model. An equivalent Figure-of-Merit dedicated to shunt configuration can be given as in equation (2): 𝐹𝑜𝑀𝑠ℎ𝑢𝑛𝑡= 1/(2𝜋𝑅𝑂𝐹𝐹𝐶𝑂𝑁) (2) For the shunt switch of Fig. 1b, a Figure-of-Merit equal to 11 THz is obtained with (2). It is not surprising to get a value of 𝐶𝑂𝑁−𝑠ℎ𝑢𝑛𝑡 almost twice the one of 𝐶𝑂𝐹𝐹−𝑠𝑒𝑟𝑖𝑒𝑠 as there are two PCMs in parallel in the shunt configuration. However, the triangular feeding lines to PCM are not exactly the same shape
Fig. 3. Pulse generator voltage versus time for crystallization. Voltage at the pulse generator electrodes (solid line) and at the PCM switch electrodes (red dotted line). Part A: GeTe is still in amorphous state. Part B, GeTe crystallizes. Switch under test is the one of Fig. 1a, with W = 19 µm, T = 300 nm,
L = 1 µm. 0 1 2 3 4 0 20 40 60 80
Time (ns)
V
olt
age
(V
)
A
Treshold Voltage
B
Fig. 4. Electrical equivalent circuit of the GeTe switch in its environment bench. The influence of GeTe is modeled with a variable resistor and a capacitor. The terms 𝑍0 represent the 50-Ω prober termination ports. a. Series
GeTe switch. b. Shunt GeTe switch (in practice, two PCM in parallel).
𝑳 = in ON-state (OFF-state) (a) (b) Fig. 5. Measured de-embedded switch performance for a 300-nm thick GeTe film. Insertion loss with switch in ON-state in series (solid line) and shunt (dash line) configurations. Isolation with switch in OFF-state in series (solid line) and shunt (dash line) configurations. Series configuration: W = 19 µm,
T = 300 nm, L = 1 µm. Shunt configuration: two PCM in parallel, W = 16 µm, T = 300 nm, L = 1 µm.
in series or shunt configurations which explains why we observe practically 𝐶𝑂𝑁−𝑠ℎ𝑢𝑛𝑡 > 2𝐶𝑂𝐹𝐹−𝑠𝑒𝑟𝑖𝑒𝑠. Concerning 𝑅𝑂𝐹𝐹−𝑠ℎ𝑢𝑛𝑡, it should be equal to half of 𝑅𝑂𝑁−𝑠𝑒𝑟𝑖𝑒𝑠, if the widths, 𝑊, were the same. This is not totally true (19 µm in series and 16 µm in shunt) so that 𝑅𝑂𝐹𝐹−𝑠ℎ𝑢𝑛𝑡> 𝑅𝑂𝑁−𝑠𝑒𝑟𝑖𝑒𝑠⁄ . 2 This is the raison why the same 𝐹𝑜𝑀 is not observed. It has to be noted that 𝐿// has no influence on 𝐹𝑜𝑀𝑠ℎ𝑢𝑛𝑡.
IV. LARGE SIGNAL ANALYSIS A. Power Handling
Power handling is an important figure of merit to evaluate RF switch performance. Depending on the application, it can even be a core issue.
Power handling capability was tested for both ON- and OFF-states. Likewise, two configurations of switch were tested: serial switches as presented in Fig. 1a and shunt switches depicted in Fig.1b. As it will be discussed, the voltage and current flow through the devices are related to the configuration; so conclusions about power handling are also directly linked to the serial or shunt configuration. Finally, the influence of the switch geometry on the power handling is performed for each case (ON- / OFF-states, serial / shunt configurations). Indeed switches of various geometrical dimensions were characterized: GeTe width 𝑊 was varied from 300 nm to 19 µm, and two GeTe lengths 𝐿 were considered (0.5 µm and 1 µm). Likewise, samples with two different GeTe thicknesses T (100 nm and 300 nm) were fabricated and measured. The geometries of the different switches discussed below are given in Table II. For any switches up to 5 identical devices have been characterized to consider potential dispersion due to fabrication.
All power handling measurements presented below were carried out using RF-probes (Z-probes) with a 150-µm pitch on
the same measurement bench composed of a 100kHz – 20GHz signal generator (ROHDE & SCHWARZ SMB 100A) and of a broadband amplifier (ROHDE & SCHWARZ BBA150) allowing to deliver a maximum power of 40 dBm. A 20-dB coupler (MCLI HDL-33-20/200) separates signal between two paths. One is used to supply power to the device while the other one measures the latter by means of a power sensor (ROHDE & SCHWARZ NRP18S) connected to a power meter. A second power sensor is used for a similar measurement at the output of the device. SOLT calibration was performed. In practice, a 2.7 GHz CW signal was applied to the switches with a RF input power discretely ramped-up from -10 dBm to +40 dBm. For each step of 1 dB, both input power 𝑃𝐼𝑁 and output power 𝑃𝑂𝑈𝑇 were measured. For reminding, Fig. 4 gives the electrical equivalent circuit of the switch in series configuration (Fig. 4a) and in shunt (Fig. 4b). 𝑅𝑂𝑁 (𝑅𝑂𝐹𝐹 respectively) is the switch resistance of the ON- (OFF-) state and 𝐶𝑂𝐹𝐹(𝐶𝑂𝑁 respectively) the capacitance that can be determined only during OFF-state for the series configuration (ON-state for the shunt one respectively), as stated in part III. Probers present a 50-Ω load at each terminal, named 𝑍0. For reminding, the characteristic impedance of the transmission lines also equals 𝑍0=50 Ω.
To study the link between power handling and device geometry, it is interesting to consider the current flowing through the switch. This can be done for the series and shunt configurations as depicted in Fig. 4. Thus, analytical expressions which describe the relationship between the input power and the intensity of the current flow through the device for both configurations can be derived as below:
𝐼𝑠 = √2 𝑍0. 𝑃𝐼𝑁 𝑠 ∙ (2𝑍0)2+(2𝑅𝐶𝑂𝐹𝐹𝜔𝑍0)2 (𝑅+2𝑍0)2+ (2𝑅𝐶𝑂𝐹𝐹𝜔𝑍0)2 (3) 𝐼𝑠ℎ= 1 |𝑍𝑠ℎ|. √2𝑍0. 𝑃𝐼𝑁 𝑠ℎ. (2𝑅)2 (2𝑅+𝑍0)2+ (𝑅𝐶 𝑂𝑁𝜔𝑍0)2 (4) TABLEII
SUMMARY OF MEASUREMENT RESULTS OF ON-STATE SERIES SWITCHES, CRYSTALLINE GETE
Device Width W (µm) Thickness T (µm) Length L (µm) Resistance RON (Ω) Area W×T (µm²) 𝒎𝒂𝒙−𝒅𝑩𝒎 (dBm) 𝒎𝒂𝒙 (mW) Current 𝒎𝒂𝒙 (mA) Voltage 𝑽𝒎𝒂𝒙 (V) SE1-W1 0.58 0.1 1.0 155 0.06 5.58 3.61 4.790 0.72 SE1-W2 1.76 0.1 1.0 51.7 0.18 9.65 9.23 12.39 0.68 SE1-W3 7.62 0.1 1.0 11.9 0.76 18.8 75.9 47.90 0.72 SE1-W4 19 0.1 1.0 4.8 1.90 27.0 501.2 129.9 1.17 SE1-W5 31 0.1 1.0 2.9 3.10 31.2 1320 223.1 0.65 SE3-W1 0.58 0.3 1.0 51.5 0.18 6.4 4.36 8.75 0.45 SE3-W2 1.76 0.3 1.0 17 0.53 12.44 17.54 22.4 0.40 SE3-W3 7.62 0.3 1.0 3.9 2.29 23.7 234.4 92.0 0.48 SE3-W4 19 0.3 1.0 1.5 5.70 32 1580 245.6 0.61 SE1-W5-L2 31 0.1 1.5 4.4 3.10 30.2 1050 196 0.84 SE1-W5-L3 31 0.1 2.0 5.9 3.10 28.6 724 174 0.99 SE1-W5-L4 31 0.1 3.0 8.8 3.10 28 631 154 1.28
where 𝐼𝑠 and 𝐼𝑠ℎ correspond respectively to the current flow through the PCM, in series for the series switch and in shunt for the shunt one, expressed in Ampere. 𝑃𝐼𝑁 𝑠 is the input power in the series configuration, 𝑃𝐼𝑁 𝑠ℎ in the shunt one, both expressed in Watt. 𝑍𝑠ℎ, the impedance of the switch in shunt configuration, is equal to 𝑅
1+𝑗𝑅𝐶𝑂𝑁𝜔. As a general rule, R value will depend on the switch configuration and state: 𝑅 = 𝑅𝑂𝑁/𝑂𝐹𝐹𝑠/𝑠ℎ .
1) Crystalline GeTe characterization
The goal of this study is not only to define the limits of the device in terms of power handling, but to correlate power handling capability with the switch configuration (series / shunt) and the switch geometry. As the geometrical parameters
W, T, and L are independent from each other, it will be assumed
that the maximum input power before failure 𝑃𝑚𝑎𝑥𝑠 is given by the following formula:
𝑃𝑚𝑎𝑥𝑠 (𝑊, 𝑇, 𝐿) = 𝑓𝑊(𝑊) ∙ 𝑓𝑇(𝑇) ∙ 𝑓𝐿(𝐿) (5) where 𝑓𝑊(𝑊) (𝑓𝑇(𝑇) and 𝑓𝐿(𝐿) respectively) is a function of W (of T and L, respectively); and where these geometrical parameters are given in micrometer units. The objective here is to identify for the first time these unknown functions.
a) Series configuration of the switch
Firstly, the study is focused on series switch. The GeTe width, W, (see Fig. 1a) is varying between 0.58 µm and 31 µm. Two different values of GeTe thickness T (100nm or 300nm) are considered. To begin with, length L is fixed to 1µm.
Fig. 6 presents the switch output power 𝑃𝑂𝑈𝑇 versus input power 𝑃𝐼𝑁 for different GeTe widths W and thicknesses T. Open circuit and short circuit RF transmission lines, used for calibration, are also given for comparison. When the maximum RF power is reached, the GeTe is dramatically destroyed and the switch behaves like an open circuit. The 1-dB compression point does not occur before failure.
The maximum input power before failure, 𝑃𝑚𝑎𝑥𝑠 , measured with the bench, and the corresponding current flow through the
device, 𝐼𝑚𝑎𝑥𝑠 , and voltage, 𝑉𝑚𝑎𝑥𝑠 , are given in Table II and plotted in Fig. 7. Note the 𝐼𝑚𝑎𝑥𝑠 is derived from 𝑃𝑚𝑎𝑥𝑠 by using equation (1). In this figure, the maximum input power 𝑃𝑚𝑎𝑥𝑠 is plotted versus the GeTe width W, for the two thickness values. Each point corresponds to an average value of the exactly same devices. A fitting curve is extracted from these results so that (5) can be re-written as follow, where 𝑃𝑚𝑎𝑥𝑠 is given in mW:
𝑃𝑚𝑎𝑥𝑠 (𝑊, 0.1,1) = 1.375 ∙ 𝑊2 (6) 𝑃𝑚𝑎𝑥𝑠 (𝑊, 0.3,1) = 4.32 ∙ 𝑊2 (7) So for the two thickness of GeTe under consideration, the maximum power 𝑃𝑚𝑎𝑥𝑠 that can be handled by the device is a function of the square of 𝑊.
From (6) and (7) it is now possible to extract 𝑓𝑇(𝑇) for values of T between 100 nm and 300 nm. In that range 𝑓𝑇(𝑇) is proportional to T. Equation (5) can thus be rewritten as in (8):
𝑃𝑚𝑎𝑥𝑠 (𝑊, 𝑇, 1) = 13.75 ∙ 𝑊2∙ 𝑇 (8) Hence, it can be seen that the maximum power handling of the series switch at OFF-state, corresponding to amorphous GeTe, is function of the square of its width and is proportional to its thickness. As in [20], when the cross sectional area of the GeTe is reduced, the maximum power handling is also reduced. The variation of the maximum current 𝐼𝑚𝑎𝑥𝑠 before failure is also plotted in Fig. 7. Same approach has been done; a linear curve can be used to fit the results. The following expression can be used to model the variation of 𝐼𝑚𝑎𝑥𝑠 (expressed in Amperes) with the GeTe geometry:
𝐼𝑚𝑎𝑥𝑠 (𝑊, 𝑇, 1) = 22.6 ∙ 𝑊 ∙ 𝑇1 2⁄ (9) The relative error (not shown here) between the measured values 𝑃𝑚𝑎𝑥𝑠 (see table II) and the formula 𝑃𝑚𝑎𝑥𝑠 (𝑊, 𝑇, 𝐿) in equation (6) is lower than 6% for W varying between 7.62 µm and 31 µm and T in the range of 100 – 300 nm.
A study on how 𝑃𝑚𝑎𝑥𝑠 and 𝐼𝑚𝑎𝑥𝑠 are affected by the GeTe length L was also performed. Output power 𝑃𝑂𝑈𝑇versus the input power 𝑃𝐼𝑁 for different GeTe lengths L are given in Fig. 8.
Fig. 6. Series GeTe switch in ON state versus 𝑊 and 𝑇. 𝐿=1 µm. Output power versus input power when a 2.7-GHz CW signal is applied. Same switches (fabrication repeatability study) are superimposed on the plot (same trace, same color). Switches with different widths, W, are plotted with different color; 100nm thick GeTe are in solid line. 300nm thick GeTe are in dotted line.
Fig. 7. Failure power 𝑃𝑚𝑎𝑥𝑠 and current 𝐼𝑚𝑎𝑥𝑠 of the series 1-µm length GeTe
switch in ON state versus 𝑊 for two values of the thickness: measurements are given by marker symbols (up triangle for 100 nm thick and down triangles for 300 nm thick), and the corresponding fitting curve (6), (7) in solid and dash lines respectively for power and current.
Is max100 nm Ps max100 nm Is max300 nm Ps max300 nm
Contrarily to W and T, an increase in L will decrease 𝑃𝑚𝑎𝑥𝑠 . As it will be confirmed in the next paragraph by a thermal analysis, the longer is the switch, the higher is the temperature at the middle of the GeTe.
The maximum input power before failure, 𝑃𝑚𝑎𝑥𝑠 , measured with the bench, and the corresponding current flow through the device, 𝐼𝑚𝑎𝑥𝑠 , are plotted in Fig. 9. The results can be fitted with a simple expression and the following formulas can finally be used to model the variation of 𝑃𝑚𝑎𝑥𝑠 and 𝐼𝑚𝑎𝑥𝑠 with W, T and L:
𝑃𝑚𝑎𝑥𝑠 (𝑊, 𝑇, 𝐿) = 233.4 ∙ 𝑊2∙ 𝑇/(𝐿 + 3.12)2 (10) 𝐼𝑚𝑎𝑥𝑠 (𝑊, 𝑇, 𝐿) =∙ 93.1 ∙ 𝑊 ∙ 𝑇1 2⁄ /(𝐿 + 3.12) (11)
In the geometrical parameter range considered for the study, the maximum power is proportional to 𝑊2∙ 𝑇 and inversely proportional to 𝐿. Note that 𝑊2∙ 𝑇 does not correspond to the square of the transverse section of the GeTe (𝑊 ∙ 𝑇)2. One explanation can be found from a thermoelectric modeling of the switch. Indeed, the influence of W and T in terms of heat transfer may differ. As it can be seen in Fig. 1, the main heat
spreader is the metallic line that contacts the GeTe backside. Hence, the way in which thermal dissipation occurs does not depend on the thickness of GeTe but mainly on its width. Anyway, even if W and T do not play the same role in terms of thermal dissipation: the thicker the GeTe is, the harder it is to dissipate heat.
It is clear that the GeTe geometry plays an important role on power handling for crystalline GeTe. A thermoelectric modeling of the proposed device has been performed to check by simulation the validity of (10) and (11) extracted from RF measurements based on a limited number of devices. As the failure is caused by too high a temperature in the GeTe [20], a thermoelectric modeling allows to connect RF excitation with the internal temperature of the structure. A 2D multi-physics simulator, COMSOL, has been used to simulate the GeTe switch. Electrical and thermal conductivity of the different materials that compose the switch are given in Table III, on the basis of data available in the literature. The phase change of the GeTe has been modeled as a variation versus temperature of its thermal conductivity. In this thermoelectric modelling, to simulate direct heating excitation, a current step comparable to the one that has been used during the measurements was set between the two RF lines. The same rise, hold and fall time (respectively 5 ns, 50 ns and 5 ns) were considered in simulation.
The device temperature profile is plotted in Fig. 10 after 55 ns, just before the pulse generator stops. The figure shows the spots where the temperature is higher than 1000°K, i.e. above melting temperature. It is clear that the highest temperature is reached in the center of the device, especially at the GeTe layer. Generally speaking, too much temperature rise will cause device failure. More precisely, the failure may come from several factors that are exacerbated with the increase in temperature, such as current crowding, phase change nucleation mechanisms, presence of defects, or even crystalline orientation. These phenomena consisting in considering the non-ideal nature of the switch are difficult to simulate accurately. Thus, to retrieve the measurement results, we followed a two-step approach. First a temperature t0 (typically
higher than melting temperature) is chosen. Then an observation point is chosen, numbered N°1, N°2 or N°3 as depicted on Fig. 10. Second, for each geometrical quantity (W,
T or L), the current magnitude, 𝐼𝑡0, that leads to temperature t0
at point N°i,is derived from simulation. Results are summarized
Fig. 8. Series GeTe switch in ON state versus 𝐿. 𝑊=31 µm. 𝑇=0.1 µm. Output power versus input power when a 2.7-GHz CW signal is applied. Same switches (fabrication repeatability study) are superimposed on the plot (same trace, same color).
L = 1 µm L = 1.5 µm L = 2 µm L = 3 µm
Fig. 9. Failure power 𝑃𝑚𝑎𝑥𝑠 and current 𝐼𝑚𝑎𝑥𝑠 of the series 31-µm wide and
100-nm thick GeTe switch in ON state versus 𝐿. Measurements are given by marker symbols. Corresponding fitting curve of equations (10) and (11) are in solid and dash lines respectively for power and current.
a. b. Is max100 nm Ps max100 nm POUT (dB m ) PIN(dBm) TABLEIII
ELECTRICAL AND THERMAL CONDUCTIVITY OF
MATERIALS Material Electrical Conductivity (S/m) Thermal Conductivity (W/m/K) TiN 1 M 21.9 Amorphous GeTe ≈ 5* 4 Crystalline GeTe ≈ 100 k* 7 SiN 1 p 30 AlCu 35 M 237 SiO2 1 f 1.4 Si 1 130
in Fig. 11, where Fig. 11a plots the variation of 𝐼𝑡0 with 𝑊, Fig.
11b with 𝑇 and Fig. 11c with 𝐿. For each case, an analytical expression as in (11) is used to model the observed variation. As for the empirical case, a very good match is obtained between simulation and analytical fit. Coefficients may be somewhat different between simulation fit and measurement fit. This is due to the observed currents which are not the same. 𝐼𝑡0
enables to reach 𝑡0 at point N°i in simulation. 𝐼𝑚𝑎𝑥𝑠 is the failure current across PCM in measurements.
b) Shunt configuration of the switch
Depending on the configuration (shunt or series), the switch will be affected differently by the RF power. Consequently, a similar work as previously was carried out in the case of the shunt switch.
Failure appears when temperature rise induced by the current flow through the PCM device (as described on Fig. 4 with 𝐼𝑠 and 𝐼𝑠ℎ) is too high. Hence, on the basis of similar PCM sizes either in shunt or in series configuration (which means 𝑅 = 𝑅𝑂𝑁𝑠 = 𝑅𝑂𝐹𝐹𝑠ℎ ), failure corresponds to identical maximum current:
𝐼𝑚𝑎𝑥𝑠 = 𝐼𝑚𝑎𝑥𝑠ℎ (12) 𝐼𝑠 and 𝐼𝑠ℎ are related to 𝑃𝐼𝑁 𝑠 and 𝑃𝐼𝑁 𝑠ℎ through (3) and (4) respectively. Moreover, in crystalline state, assumption (13) can be done:
𝑅𝐶𝑂𝐹𝐹𝜔𝑍0≪ 𝑍0 and 𝑅𝐶𝑂𝑁𝜔𝑍0≪ 𝑍0 (13) On the basis of (3), (4) and (13), equation (12) can be rewritten as equation (14):
𝑃max _𝑐𝑟𝑦𝑠 𝑠 = (𝑅+2𝑍0)2
(2𝑅+𝑍0)2∙ 𝑃max _𝑐𝑟𝑦𝑠
𝑠ℎ (14)
With (14), it is clear that for the same electrical power dissipated by the switch, the input power at which the failure occurs depends on the series or shunt configurations.
Fig. 10. Temperature profile in a 2D-COMSOL simulation.
1
Length
0,4 µm 0,8 µm
2
Fig. 11. Thermoelectric modeling of the GeTe. Input current 𝐼𝑡0versus the
GeTe geometrical parameters for a specific temperature 𝑡0. a) W is varying,
T=0.3 µm, L=1 µm, b) T is varying, W=20 µm, L=1 µm, c) L is varying, T=0.3 µm, W=20 µm. N°i corresponds to various locations along the GeTe
length at which the temperature t0 is considered. When no location is precised,
temperature is measured at the center of the GeTe. Dash line fits the data.
TABLEIV
SUMMARY OF MEASUREMENT RESULTS OF OFF-STATE SHUNT SWITCHES, CRYSTALLINE GETE
Device Width 2xW (µm) Thickness T (µm) Length L (µm) Resistance ROFF (Ω) Area W×T (µm²) 𝒎𝒂𝒙−𝒅𝑩𝒎 (dBm) 𝒎𝒂𝒙 (mW) Current 𝒎𝒂𝒙 (mA) Voltage 𝑽𝒎𝒂𝒙 , (V) SH1-W1 1.17 0.1 1.0 77.6 0.117 9.2 9.77 9.84 0.47 SH1-W2 3.52 0.1 1.0 26.0 0.352 12 15.85 24.0 0.42 SH1-W3 12.9 0.1 1.0 7.0 1.29 18.8 75.86 86.4 0.38 SH1-W4 32.0 0.1 1.0 2.8 3.20 27.0 501.2 240.0 0.69 SH3-W1 1.17 0.3 1.0 25.9 3.52 10.9 12.30 14.6 0.47 SH3-W2 3.52 0.3 1.0 8.6 1.05 14.9 30.90 40.9 0.47 SH3-W3 12.9 0.3 1.0 2.4 3.87 22.6 182.0 141 0.47 SH3-W4 32.0 0.3 1.0 1.0 9.60 31 1259 408 0.65
For 𝑅 < 𝑍0, the allowable power in a series switch is greater
than in a shunt switch presenting equal dimensions, and vice versa for 𝑅 > 𝑍0. In order to have 𝑅 as low as possible both in
the series (for low insertion loss) and shunt (for high isolation) configurations (i.e. R<<Z0), a series device can handle four
times more power than a shunt device. For practical consideration, smaller is the resistance (like for the switch with a thickness of 300 nm as compared to the one of 100 nm), better is the power handling during crystalline phase.
This result also explains why it is important in power handling study to consider these two configurations. It is why, like for the series switch configuration, power handling measurements have been performed on shunt configuration. Geometrical and electrical parameters of the measured devices are given in Table IV. As previously, a study on how 𝑃𝑚𝑎𝑥𝑠ℎ and 𝐼𝑚𝑎𝑥𝑠ℎ are affected by the GeTe geometrical parameters (W and
T) was performed. Fig. 12 shows comparable results as
exploited in the series case. After failure, we do not observe isolation anymore and the RF signal can flow back through the RF transmission lines.
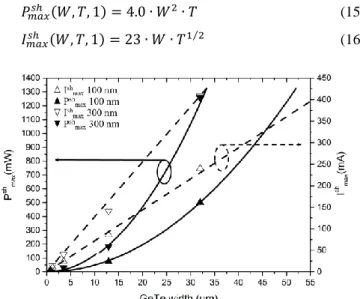
In Fig. 13 the same simple expressions can be used to fit the results and to model the variation of 𝑃𝑚𝑎𝑥𝑠ℎ (in mW) and 𝐼𝑚𝑎𝑥𝑠ℎ (in
A) with 𝑊 (in µm) and 𝑇 (in µm). No fit could be performed in terms of variation with 𝐿 as only one length is available, i.e. 1 µm. Also the analytical formula for shunt has not been confirmed with COMSOL multi-physics simulations but it can be assumed that conclusions would be similar. For measurements, fit gives:
𝑃𝑚𝑎𝑥𝑠ℎ (𝑊, 𝑇, 1) = 4.0 ∙ 𝑊2∙ 𝑇 (15) 𝐼𝑚𝑎𝑥𝑠ℎ (𝑊, 𝑇, 1) = 23 ∙ 𝑊 ∙ 𝑇1 2⁄ (16)
By comparing (15), shunt configuration, with (8) (series configuration), it can be seen that 𝑃𝑚𝑎𝑥𝑠ℎ (𝑊, 𝑇, 1) = 3.42 ∙ 𝑃𝑚𝑎𝑥𝑠 (𝑊, 𝑇, 1). This result is in excellent agreement with (14). As an example, for 𝑊=31 µm in series and 𝑊=32 µm in shunt, with L=1 µm and T=100 nm for both, 𝑅𝑂𝑁𝑠 and 𝑅𝑂𝐹𝐹𝑠ℎ equal 2.9 and 2.8 Ω respectively. By taking 𝑅𝑂𝑁𝑠 =𝑅𝑂𝐹𝐹𝑠ℎ = 2.85 Ω, mid value, a coefficient of 3.41 is expected with (14). This confirms that series configuration supports much more power in case of crystalline GeTe.
Anyway, before concluding in favor of one configuration or another (better isolation for shunt but better power handling for series when GeTe is crystalline), all cases have to be studied. In particular, what is power handling for amorphous GeTe, in both configurations?
Fig. 12. Shunt GeTe switch in OFF state versus 𝑊 and 𝑇. 𝐿=1 µm. Output power versus input power when a 2.7-GHz CW signal is applied. Same switches (fabrication repeatability study) are superimposed on the plot (same trace, same color). Switches with different widths, W, are plotted with different color; 100nm thick GeTe are in solid line. 300nm thick GeTe are in dotted line.
b. a.
Fig. 13. Failure power 𝑃𝑚𝑎𝑥𝑠 and current 𝐼𝑚𝑎𝑥𝑠 of the shunt 1-µm length GeTe
switch in OFF state versus 𝑊 for two values of the thickness: measurements are given by marker symbols (up triangle for 100 nm thick and down triangles for 300 nm thick), and the corresponding fitting curve (15), (16) in solid and dash lines respectively for power and current.
b. a.
TABLEV
SUMMARY OF MEASUREMENT RESULTS OF OFF-STATE SERIES SWITCHES, AMORPHOUS GETE
Device Thickness (µm) Length (µm) 𝒎𝒂𝒙 (dBm) 𝒎𝒂𝒙 (mW) 𝑽𝒎𝒂𝒙− 𝑴𝑺 (V) 𝑽𝒎𝒂𝒙−𝒂𝒗𝒆 (V) 𝑳𝒂 𝑴𝑺 (µm) 𝑳𝒂𝒂𝒗𝒆 (µm) SE3-W1 to SE3-W4 0.3 1 Min: 18.5 Mean: 20.0 Max: 21.5 Min: 70.8 Mean: 100 Max: 141 Min: 3.76 Mean: 4.47 Max: 5.31 Min: 3.39 Mean: 4.02 Max: 4.78 Min: 0.30 Mean: 0.35 Max: 0.42 Min: 0.27 Mean: 0.32 Max: 0.38 SE1-W1 to SE1-W4 0.1 1 Min: 23.5 Mean: 25.5 Max: 27.5 Min: 224 Mean: 355 Max: 562 Min: 6.69 Mean: 8.42 Max: 10.6 Min: 6.02 Mean: 7.58 Max: 9.54 Min: 0.53 Mean: 0.67 Max: 0.84 Min: 0.48 Mean: 0.60 Max: 0.75 SE1-W5 0.1 1 27.5 562 10.6 9.54 0.84 0.75 SE1-W5-L2 0.1 2 34.0 2510 22.4 20.2 1.80 1.60
2) Amorphous GeTe characterization
The study has been performed for GeTe in amorphous state after programming switches through the method described in section II. Switches in series and shunt configurations for thicknesses of 100 nm or 300 nm, lengths of 1 µm and 2 µm, and several widths, have been explored.
a) Series configuration of the switch
Results are exploited in Fig. 14 where output power versus input power evolutions are shown.
For amorphous state, failure corresponds to the maximum RF voltage that can be handled by the material. In fact, the switch failure is explained as a parasitic crystallization that occurs when the equivalent voltage at the GeTe edges should equal the threshold voltage, given by 𝑉𝑡ℎ= 𝐸𝑡ℎ. 𝐿, as studied in [18]. This maximum voltage is thus proportional to the material length. A value of 12.6 V/µm has been obtained for 𝐸𝑡ℎ in [18]. By using the model of Fig. 4a, for series switches, it is possible from (3) to calculate the RF magnitude voltage 𝑉𝑚𝑎𝑥𝑠 across the switch before failure. 𝑉𝑚𝑎𝑥𝑠 = 𝑍𝑠 ∙ √ 2 𝑍0. 𝑃𝑚𝑎𝑥 𝑠 ∙ (2𝑍0)2+(2𝑅𝐶𝑂𝐹𝐹𝜔𝑍0)2 (𝑅+2𝑍0)2+ (2𝑅𝐶𝑂𝐹𝐹𝜔𝑍0)2 (13)
where 𝑍𝑠, the impedance of the switch in series configuration, is equal to 𝑅
1+𝑗𝑅𝐶𝑂𝐹𝐹𝜔. By deriving RMS voltage, 𝑉𝑚𝑎𝑥−𝑅𝑀𝑆
𝑠 , and
average voltage, 𝑉𝑚𝑎𝑥−𝑎𝑣𝑒𝑠 , as in [18], it comes: 𝑉𝑚𝑎𝑥−𝑅𝑀𝑆𝑠 = 𝑉𝑚𝑎𝑥𝑠 √2 (14) 𝑉𝑚𝑎𝑥−𝑎𝑣𝑒𝑠 = 𝑉𝑚𝑎𝑥𝑠 𝜋 (15)
RMS voltage (𝑉𝑚𝑎𝑥−𝑅𝑀𝑆𝑠 ) is equal to the value of the continuous voltage that would produce the same mean power dissipation than the RF voltage in a resistive load. Average voltage (𝑉𝑚𝑎𝑥−𝑎𝑣𝑒𝑠 ) is equal to the average of the rectified voltage. By correlating either 𝑉𝑚𝑎𝑥−𝑅𝑀𝑆𝑠 or 𝑉𝑚𝑎𝑥−𝑎𝑣𝑒𝑠 with 𝐸𝑇𝐻, the length of the amorphous material 𝐿𝑎, (which is shorter than the total GeTe length L) can be calculated.
Switch dimensions, the maximum input power before failure 𝑃max𝑠 and the corresponding RMS and average RF voltage are given in Table V. The calculated length of amorphous GeTe 𝐿𝑎 obtained by considering an 𝐸𝑇𝐻 of 12.6 V/μm with either 𝑉𝑚𝑎𝑥−𝑅𝑀𝑆𝑠 (noted 𝐿𝑎𝑅𝑀𝑆) or 𝑉𝑚𝑎𝑥−𝑎𝑣𝑒𝑠 (noted 𝐿𝑎𝑎𝑣𝑒) are also shown in Table V. Results show that for switches with longer GeTe lengths, 𝐿, it is possible to obtain longer lengths of amorphous GeTe, 𝐿𝑎. This also means that power handling can be improved by using longer GeTe lengths. Note that in Table V, the length of amorphous GeTe is not a perfectly controlled parameter. This explains the dispersion observed in the power handling of devices showing same length and same thickness.
As aforementioned, when the maximum RF power is reached, the switch changes from OFF- to ON-state. This change is not destructive for the switch as it corresponds to a transition from amorphous to crystalline phase. It can be observed for some switches (SE3_W4 in blue curve in Fig. 14) that after failure the switch moves to ON-state. By pursuing the increase in input power, the switch is finally destroyed towards an open state, as previously observed for switches in crystalline phase. However, for other switches (SE3_W3 in green curve, SE1_W4 in blue curve and SE1_W5 in purple curve in Fig. 14), after failure, the switch changes toward an ON-state presenting extremely high insertion losses; it is immediately destroyed afterwards, thus leading to open state.
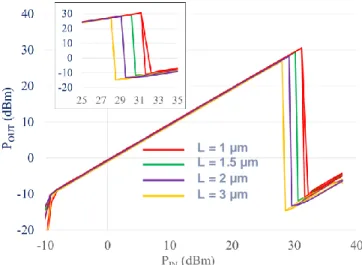
b) Shunt configuration of the switch
Regarding shunt switches, no failure could be detected by means of electrical measurements of the output power. However, a failure was observed by means of optical microscopy on most of the switches at about 30 dBm, Fig. 15. Note that this order of magnitude is in good agreement with the one that can be estimated with the introduced model. Indeed, from (4) it is possible to derive the relation between the maximum input power before failure 𝑃𝑚𝑎𝑥 𝑠ℎ and the voltage across the switch, 𝑉𝑚𝑎𝑥𝑠ℎ :
𝑉𝑚𝑎𝑥𝑠ℎ = √2𝑍0. 𝑃𝑚𝑎𝑥 𝑠ℎ .
(2𝑅)2
(2𝑅+𝑍0)2+ (𝑅𝐶𝑂𝑁𝜔𝑍0)2 (16)
Let’s consider 𝐸𝑡ℎ =12.6 V/μm as the limiting factor for power handling in amorphous phase, and an amorphized material mean length, 𝐿𝑎𝑅𝑀𝑆, of 350 nm for a GeTe thickness of
300 nm (respectively 𝐿𝑅𝑀𝑆𝑎 =670 nm for 𝑇=100 nm), as
determined in the case of series switches in Table V. With these assumptions, and by using (16), it is possible to derive the maximum input power before failure 𝑃𝑚𝑎𝑥 𝑠ℎ . Thus, a maximum input power of 26 dBm has been obtained for switches with 300-nm thick GeTe and of 31.5 dBm for switches with a thickness of 100 nm. These results are in good agreement with the optical observation of the failure.
Fig. 14. Series GeTe switch in OFF state versus 𝑊 and 𝑇. 𝐿=1 µm. Output power versus input power when a 2.7-GHz CW signal is applied. Same switches (fabrication repeatability study) are superimposed on the plot (same trace, same color). Switches with different widths, W, are plotted with different color; 100nm thick GeTe are in solid line. 300nm thick GeTe are in dotted line.
As previously, it is interesting now to compare power handling between the two configurations: shunt and series. For similar GeTe dimensions, leading to 𝑅 =𝑅𝑂𝐹𝐹𝑠 = 𝑅𝑂𝑁𝑠ℎ, and
identical values of the voltage across the switch, as voltage is the limiting factor for amorphous GeTe [18]), it is possible to derive the followings relationships:
𝑉𝑚𝑎𝑥𝑠ℎ = 𝑉𝑚𝑎𝑥𝑠ℎ (17) 𝑃𝑚𝑎𝑥 𝑠 = 1 𝑍𝑠2. (𝑅+2𝑍0)2+(2𝑅𝐶𝑂𝐹𝐹𝜔𝑍0)² (2𝑍0)2+(2𝑅𝐶𝑂𝐹𝐹𝜔𝑍0)² . (2𝑍0𝑅)² (2𝑅+𝑍0)2+(𝑅𝐶𝑂 𝜔𝑍0)². 𝑃𝑚𝑎𝑥 𝑠ℎ (18)
During amorphous state, it is assumed that:
𝑅 + 𝑍0≅ 𝑅
2𝑅 + 𝑍0≅ 2𝑅 (19) 𝑅 + 2𝑍0≅ 𝑅
2𝑍0𝐶𝑂𝐹𝐹𝜔. 𝑅 ≪ 𝑅 and 2𝑍0𝐶𝑂 𝜔. 𝑅 ≪ 𝑅
So, with these assumptions and from (18), it can be stated that:
𝑃max _𝑎𝑚𝑜𝑟𝑝ℎ 𝑠 ≅ 1
4∙ 𝑃max _𝑎𝑚𝑜𝑟𝑝ℎ
𝑠ℎ (20)
Finally, for amorphous GeTe, the shunt switch at ON-state will hold about four times more power than the series one at OFF-state. Also, as a general conclusion for the amorphous phase, small thicknesses seem to be preferable rather than thick ones. The compromises between dimensions and configurations will be discussed in conclusion, after presenting some linearity aspects.
B. Linearity
The linearity of the GeTe switch is characterized at a fundamental frequency of 824 MHz, delivered by the RF power generator Agilent E4438C, and amplified through the amplifier system Ophir 5143. Two power sensors are used: before and after device. Fig. 16 shows the linearity measurement up to 35 dBm of a series device. The tested device is SE3-W4 (Table II), with W=19 µm, L=1 µm and T=300 nm. Rejection is about 100 dBc until destruction of the device at 33 dBm. This result is at the state of the art for PCM RF switches [14] and higher than CMOS [21].
Same study has been carried out for the shunt devices in amorphous phase. Results are shown in Fig. 17. The tested shunt device is SH3-W4 (Table IV), with W=2x16 µm, L=1 µm and T=300 nm. Rejection is about 95 dBc at the worst value of 31 dBm. No failure can be observed
V. COMPARISON WITH THE STATE-OF-ART
The study presented so far in this paper was focused on giving general design rules for GeTe-based switches on the basis of empirical models confirmed through simulations. A compromise has to be made which will be discussed as a general conclusion. Never-the-less many devices were tested and Table I presents the more striking results relative to the state-of-the-art. Insertion loss and isolation are of major
Fig. 15. a. Optical view of an amorphous GeTe switch in shunt before failure. b. Optical view of an amorphous GeTe switch in shunt after failure.
a. b.
Fig. 16. Series device in ON-state (crystalline phase). Measurement of POUT versus PIN at fundamental frequency f0 (black doted, dashed and star line), at 2f0 (black doted, dashed and triangle line) and 3f0 (black doted, dashed and empty triangle line). Reference thru line for f0, 2 f0 and 3 f0 (resp. in red doted and square line, red doted and circle line and red doted and empty circle line). f0=824 MHz.
Fig. 17. Shunt device in ON-state (amorphous phase). Measurement of POUT versus PIN at fundamental frequency f0 (black doted, dashed and star line), at 2f0 (black doted, dashed and triangle line) and 3f0 (black doted, dashed and empty triangle line). Reference thru line for f0, 2 f0 and 3 f0 (resp. in red doted and square line, red doted and circle line and red doted and empty circle line). f0=824 MHz.
importance leading to the presentation of large, thick but short devices as SE3-W4 and SH3-W4. Also the entire measurement campaign has been performed on those latter’s which is not the case for others.
Our device benefits from direct heating: low capacitance due to the lack of heater leading to higher cut-off frequency, low DC programming cycle time leading to lower energy consumption. To the authors’ mind, anyway, direct heating should be dedicated to move from crystalline to amorphous phase only, thus avoiding heater ageing but it may be not appropriate to move from amorphous to crystalline phase as the presence of one conductive nucleated filament may prevent from the crystallization of the whole device (only a small part of the PCM is crystallized). Also programming current may be high with direct heating. In the future, we will try to optimize programming current consumption and make cycling measurements.
VI. CONCLUSION
GeTe phase change material was used to realize RF switches with direct heating. Direct heating enables low energy consumption and prevents heater from ageing. However, a solution based on indirect heating for crystalline transition and direct heating for amorphization should be preferable.
The GeTe switches proposed here-in are categorized according to two configurations: shunt or series. In both cases, many designs were proposed with geometrical variations of the GeTe, in width, thickness and length. This large variety of devices enabled the authors to propose models in order to help future designers.
A small signal analysis from 40 MHz up to 50 GHz enabled, in both configurations, to draw the equivalent circuits, to derive insertion loss and isolation, and to estimate FoM, in terms of cut-off frequency, comparable or overpassing the state-of-the-art, depending on the configuration. Shunt configuration has to be favored for isolation while series one is more suited for extremely low insertion loss. As an example, measurement results confirm the small resistance due to the GeTe thickness (300 nm), with a 𝑅𝑂𝑁 resistance equal to 1.1 Ω while keeping good performance at the OFF-state with an equivalent capacitance of 6.8 fF, leading to a global FoM of 21 THz. The compromise concerning GeTe dimensions is well known for small signal analysis. It goes in favor of an optimized device for the switch ON-state, that is to say in series configuration a large, short and thick GeTe, while in shunt configuration, a minimized shunt parasitic capacitance is awaited. In OFF-state, in series configuration, the parasitic capacitance has to be minimized as well while in shunt configuration, a large, short and thick GeTe improves isolation without degrading the ON-state insertion loss.
Power-handling measurements were also carried out and confirmed that amorphous phase limitation is due to a threshold electric field of 12.6 V/µm [18]. A very detailed approach was proposed concerning power handling of the crystalline phase. Some design laws were derived for the very first time, confirmed by thermal multi-physics simulations. It is
interesting to note that the maximum current before failure is proportional to the GeTe width, the square root of its thickness and inversely proportional to its length, in both configurations. A compromise has thus to be considered concerning the length, as a larger length enables more power handling during amorphous phase but a smaller length is preferable for power handling during crystalline phase. In accordance with small analysis conclusion, an advice would be not to shorten length anymore as long as insertion loss fits the specifications.
Moreover, a power handling balance is presented between series and shunt devices, showing that series configuration is preferred for crystalline phase and shunt configuration for amorphous phase.
Finally, no linearity constraint could be underlined for those passive devices.
REFERENCES
[1] M. Jaffe et al, “Improvements in SOI Technology for RF Switches,” in
2015 IEEE 15th Topical Meeting on Silicon Monolithic Integrated Circuit in RF Systems (SiRF), 26-28 Jan. 2015.
[2] H. Mizutani et Y. Takayama, “DC-110-GHz MMIC travelling-wave switch,” IEEE Trans. on Microwave Theory and Techn., vol. 48, no 5, p. 840‑845, May 2000.
[3] Y. Jin et C. Nguyen, “Ultra-Compact High-Linearity High-Power Fully Integrated DC-20-GHz 0.18µm CMOS T/R Switch,” IEEE Trans. on
Microwave Theory and Techn., vol. 55, no 1, p. 30‑36, Jan. 2007.
[4] K. Y. Lin, W.-H. Tu, P.-Y. Chen, H.-Y. Chang, H. Wang, et R.-B. Wu, “ Millimeter-wave MMIC passive HEMT switches using traveling-wave concept,” IEEE Trans. on Microwave Theory and Techn., vol. 52, no 8, p. 1798‑1808, Aug. 2004
[5] D. Kelly, C. Brindle, C. Kemerling, et M. Stuber, “The state-of-the-art of silicon-on-sapphire CMOS RF switches,” in IEEE Compound
Semiconductor Integrated Circuit Symposium, CSIC ’05, 2005.
[6] F. Souchon, et al., “Thin film Packaged Redundancy RF MEMS Switches for Space Applications,” in IEEE 19th International Conference on
Solid-State Sensors, Actuators and Microsystems, Transducers, Taiwan, 18-22
June 2017.
[7] R. Chan, R. Lesnick, D. Becher, et M. Feng, “Low-actuation voltage RF MEMS shunt switch with cold switching lifetime of seven billion cycles,”
Journal of Microelectromechanical Systems, vol. 12, no 5, p. 713‑719, Oct.
2003.
[8] S. Pi, M. Ghadiri-Sadrabadi, J. C. Bardin, and Q. Xia, " Nanoscale memristive radiofrequency switches," Nat. Commun., vol. 6, 2015. [9] M. Purushothama, A. Vena, B. Sorli, and E. Perret, "Nafion Based Fully
Passive Solid State Conductive Bridging RF Switch," IEEE Microw.
Wireless Comp. Letters, vol. 27, pp. 1104-1106, 2017.
[10] J. A. Nessel, R. Q. Lee, C. H. Mueller, M. N. Kozicki, M. Ren, et J. Morse, “A novel nanoionics-based switch for microwave applications,” in 2008
IEEE MTT-S International Microwave Symposium Digest, 2008, p. 1051‑
1054.
[11] P. Borodulin, et al., “Recent Advances in Fabrication and Characterization of GeTe-based Phase-change RF Switches and MMICs,” in 2017 IEEE
MTT-S International Microwave Symposium (IMS), 4-9 June 2017.
[12] M. Wang, and M. R. Rais-Zadeh, “Directly Heated Four-Terminal Phase Change Switches,” in 2014 IEEE MTT-S International Microwave
Symposium (IMS), 1-6 June 2014.
[13] M. R. King, et al., “Morphological analysis of GeTe in inline phase change switches,” Journal of Applied Physics, vol 118, issue 9, Sept. 2015. [14] J-S. Moon, et al., “11 THz Figure-of-Merit Phase-change RF Switches for
Reconfigurable Wireless Front-ends,” in 2015 IEEE MTT-S International
Microwave Symposium (IMS), 17-22 May 2015.
[15] A. Mennai, et al., “Bistable RF Switches Using Ge2Sb2Te5 Phase Change Material,” in 2015 IEEE European Microwave Conference, Paris, 6 - 11 Sept. 2015.