HAL Id: hal-03209518
https://hal.archives-ouvertes.fr/hal-03209518
Submitted on 27 Apr 2021
HAL is a multi-disciplinary open access
archive for the deposit and dissemination of sci-entific research documents, whether they are pub-lished or not. The documents may come from teaching and research institutions in France or abroad, or from public or private research centers.
L’archive ouverte pluridisciplinaire HAL, est destinée au dépôt et à la diffusion de documents scientifiques de niveau recherche, publiés ou non, émanant des établissements d’enseignement et de recherche français ou étrangers, des laboratoires publics ou privés.
Evidence for methane isotopic bond re-ordering in gas
reservoirs sourcing cold seeps from the Sea of Marmara
T Giunta, Jabrane Labidi, I Kohl, L Ruffine, J Donval, L Géli, M Çağatay, H
Lu, E Young
To cite this version:
T Giunta, Jabrane Labidi, I Kohl, L Ruffine, J Donval, et al.. Evidence for methane isotopic bond re-ordering in gas reservoirs sourcing cold seeps from the Sea of Marmara. Earth and Planetary Science Letters, Elsevier, 2021, 553, pp.116619. �10.1016/j.epsl.2020.116619�. �hal-03209518�
Evidence for methane isotopic bond re-ordering in gas reservoirs sourcing cold
seeps from the Sea of Marmara
T. Giunta
1,2*, J. Labidi
3**, I.E. Kohl
3***, L. Ruffine
1, J.P. Donval
1, L. Géli
1, M. N.
Çağatay
4, H. Lu
5, E.D. Young
31: IFREMER, Unité des Géosciences Marines, 29280 Plouzané, France
2: Université de Bretagne Occidentale, Laboratoire Géosciences Océan, 29280 Plouzané, France
3: University of California Los Angeles, Department of Earth, Planetary and Space Sciences, CA 90095 Los Angeles, USA 4: Istanbul Teknik University, Faculty of Mines, Department of Geological Engineering, TR-34469 Istanbul, Turkey 5: Peking University, Department of Energy & Sciences, College of Engineering, Beijing 100871, China
*Corresponding author: thomas.giunta@univ-brest.fr
** Now at Institut de Physique du Globe de Paris, Laboratoire de Géochimie des Isotopes Stables, 75005 Paris, France *** Now at Thermo Fisher Scientific (Bremen) GmBH, Hanna-Kunath Str. 11 28199, Bremen, Germany
Abstract
The measurement of methane clumped isotopologues (Δ13CH
3D and Δ12CH2D2) allows exploring
isotope bond ordering within methane molecules, and may reveal equilibrium temperatures. Whether such temperature reflects the formation or re-equilibration temperature of the methane is not well understood, but would have critical implications for the use of methane clumped isotopologues as geo-thermometers. Here we investigate gas bubbles from vigorous emissions at cold seeps (n = 14) in the Sea of Marmara, Turkey. These cold seeps are sourced from deeper sedimentary reservoirs. Conventional geochemical tracers such as carbon and hydrogen bulk isotopic ratios (13C/12C and D/H) or n-alkane
molecular ratios, suggest these gases reflect various degrees of mixing between thermogenic and microbial sources. Some samples would generally be considered purely microbial in origin (C1/C2+ > 1500; δ13C <
-60 ‰). We report measurements of Δ13CH
3D and Δ12CH2D2 showing that a fraction of those gases are in
internal thermodynamic equilibrium, with the abundances of the two mass-18 isotopologues indicating concordant temperatures of ~90 °C and ~130 °C . These concordant temperatures are recorded by gases of putative microbial and thermogenic origin; the temperatures of equilibration are irrespective of the 1 2 3 4 5 6 7 8 9 10 11 12 13 14 15 16 17 18 19 20 21 22 23 24 25 26 27 28 29 *Manuscript
Δ12CH
2D2 are best explained by non-enzymatic re-equilibration at two local subsurface temperatures. First
principles suggest that unequal rates of exchange is possible. Disequilibrium signatures where the two isotopologues yield discordant apparent temperatures are exhibited by other samples. In those cases the data define a trend of variable D13CH
3D at nearly constant D12CH2D2. These signatures are enigmatic, and
we investigate and reject multiple possible explanations including mixing, diffusion or Anaerobic Oxidation of Methane. Different rates of re-equilibration between the two rare isotopologues is implied, although lacks experimental foundation at present. In general, all of these data point towards re-equilibration of the mass-18 methane isotopologues as an important process.
1. Introduction
In most natural settings, the generation of hydrocarbon gases results from the degradation in the subsurface of organic-rich sedimentary horizons, either through thermocatalytic cracking (i.e. referred as thermogenic generation), or through microbial reduction of oxidized carbon-bearing species (i.e. microbial methanogenesis). Geochemical investigations of methane and other light hydrocarbons have historically been undertaken using bulk stable isotope ratios of carbon and hydrogen (δ13C and δD), as
well as molecular ratios of light n-alkanes (e.g. Bernard et al., 1976; Schoell, 1988). For example, thermogenic gases are expected to contain methane and variable (but significant) amount of C2+ gases
(i.e. non-methane n-alkanes), with δ13C and δD values evolving as a function of the thermal maturity
(Schoell, 1988; Tang et al., 2000) whereas microbial gases are overwhelmingly composed of methane
(Martini et al., 1998) with δ13C and δD being generally lower than methane of thermogenic origin.
Recent advances in high-resolution mass-spectrometry and in laser absorption spectroscopy have allowed the measurement of the relative abundances of doubly-substituted methane isotopologues (i.e. methane molecules containing two heavy isotope substitutions) 13CH
3D (Stolper et al., 2014a; Ono
et al., 2014; Young et al., 2016) and 12CH
2D2(Young et al., 2016; Eldridge et al., 2019; Gonzalez et al.,
2019). These abundances are usually reported as per mil deviations from the “stochastic” isotopologue 31 32 33 34 35 36 37 38 39 40 41 42 43 44 45 46 47 48 49 50 51 52 53 54 55
abundances that would occur with random distributions of isotopes across all species, D13CH 3D and
D12CH2D2. This novel approach allows the investigation of isotope bond ordering in methane
molecules. At thermodynamic equilibrium D13CH
3D and D12CH2D2 provide independent measurements
of temperature of formation or equilibration. Where the two temperatures do not agree, kinetic processes or mixing is implied.
Rare mass-18 methane isotopologues have been shown to provide apparently reliable formation temperatures in numerous natural settings, from thermogenic (Stolper et al., 2014b; 2015; Wang et al., 2015, Douglas et al., 2016; Young et al., 2017; Giunta et al., 2019), to hydrothermal (Wang et al., 2015, 2018) and even possibly to some microbially-dominated settings (Stolper et al., 2015; Wang et al., 2015; Inagaki et al., 2015). Yet, the idea that methane ‘clumped’ isotopes would reflect the formation temperature requires that methane is synthesized at thermodynamic equilibrium. This later requirement is puzzling because methane generation, whether thermogenic, microbial or abiotic, is always considered to be controlled by kinetic effects rather than by thermodynamic equilibrium (e.g. Berner and Faber, 1996; McCollom, 2013). In the laboratory, the role of kinetic isotope effects on clumped isotopes is clear, especially for microbial generation, and laboratory experiments generally yield disequilibrium signatures (Stolper al., 2015; Wang et al., 2015; Douglas et al., 2016; Young et al., 2017; Shuai et al., 2018; Gruen et al., 2018; Giunta et al., 2019), belying temperature information. Note that these disequilibrium signatures associated with microbial or low-temperature abiotic methane are also observable in nature, especially when measurements of both D13CH
3D and D12CH2D2 are combined
(Young et al., 2017; Giunta et al., 2019). In contrast, thermogenic methane in sedimentary basins seems to show evidence for equilibrium relative abundances of CH4 isotopologues (Young et al., 2017,
Giunta et al., 2019) and it is unclear whether this could reflect a formation temperature or a re-equilibration that occurred after formation.
56 57 58 59 60 61 62 63 64 65 66 67 68 69 70 71 72 73 74 75 76 77 78
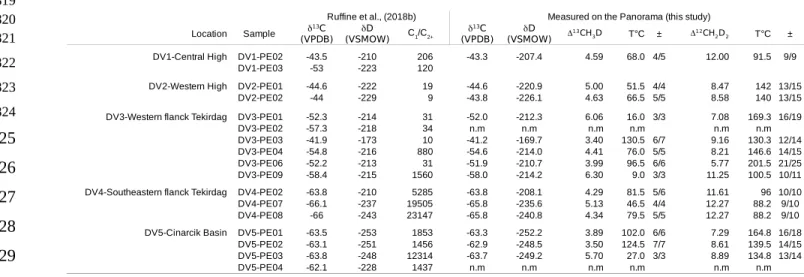
In this study, we investigate methane emitted from vigorous free-gas vents at cold seep sites in the Sea of Marmara (SoM, see Fig. 1) (Geli, et al., 2008; Bourry et al., 2009; Ruffine et al., 2018a). These vents are sourced by underlying sedimentary reservoirs (Ruffine et al., 2018b; Géli et al., 2018). Combining gas composition with carbon and hydrogen stable isotope analyses, two main origins of gas were identified (Ruffine et al., 2018b). Gases sampled on the structural highs, the Western High and Central High, are thought to be thermogenic in origin, whereas gases sampled in the southern flank of the Tekirdağ Basin and in the Çinarcik Basin are thought to be essentially microbial in origin. Other gases from the area were interpreted to reflect various proportions of mixing between these two types of sources. Hydrate formation or destabilization is unlikely to have affected these gases. All gases were collected at locations where thermodynamic conditions for hydrate stabilization are not met with the exception of samples collected in the Western High (Ruffine et al., 2012; 2018b). In contrast, the chemical and isotopic compositions have been all accounted for by mixing. Mixing as illustrated in Fig. 2 using the methane δ13C versus C
1/C2+ ratios (Ruffine et al., 2018b). Thermogenic gases are typically
thought to contain significant amounts of C2+ gases and therefore to show low C1/C2+ ratios together
with relatively enriched methane δ13C values (e.g. Bernard et al., 1976). In contrast, microbial gases are
expected to be dominated by methane with trace amounts of C2+ gases and are therefore expected to
have high C1/C2+ ratios together with relatively low δ13C values. Thus, mixing between thermogenic
and a microbial end members is predicted to produce a characteristic mixing hyperbola (Fig. 2). Some samples from the SoM however – especially gases from the Central High and from the western flank of the Tekirdağ Basin – appear to deviate from this mixing line. These gases were noted to show anomalously heavy propane δ13C (Ruffine et al., 2018b), comprising evidence for biodegradation of
propane (James and Burns, 1984) which could explain the departure from the two endmembers mixing line (Fig. 2). In this study, we explore further these hypotheses by combining the measurement of 79 80 81 82 83 84 85 86 87 88 89 90 91 92 93 94 95 96 97 98 99 100 101
13CH
3D and 12CH2D2 to provide additional constraints on the thermal history of methane in the
sedimentary reservoirs feeding the Marmara cold vents.
2. Geological setting and fluid activity
The Sea of Marmara (SoM) is an interior sea located in the Turkish territory and links the Black sea to the northeast and the Mediterranean sea to the west via the Bosphorus and the Darnaelle straits, respectively. The SoM is composed of three basins, the Tekirdağ Basin, the Central Basin and the Çınarcık Basin, which latter reaches a maximum depth of 1273 m. Each of the basins are separated by push-up structures, the Western High and the Central High (see Fig. 1). The SoM seafloor is cut lengthwise by a dense network of faults belonging to the North Anatolian Fault (NAF) system which accommodates the slip motion between the Eurasian plate and the Anatolian block (e.g. Armijo et al., 1999). In the northern part of this network, the Main Marmara Fault is seismically the most active sequence of fault segments in the region, having caused devastating earthquakes in the past (e.g. Ambraseys and Jackson, 2000).
At the seafloor, cold seeps with fluid and gas emissions are widespread across the SoM, but appear to be more frequent near active faults (e.g. Geli et al., 2008), perhaps suggesting a relationship between pressurized gas reservoirs and seismic activity (Gasperini et al., 2011; Geli et al., 2018). The sampling of free-gas (i.e. bubbles) emanating at the SoM seafloot was first achieved during the Marsite cruise in 2007, after detection of gas seep locations using a SIMRAD-EK60 echo sounder and acoustic anomalies associated to gas bubbles in the water column (Geli et al., 2008). At the time, only three active gas sites were sampled in the Çinarcik Basin, in the Western High and in the Central High
(Bourry et al., 2009). In 2014, a more extensive study on gases discharged at the SoM seafloor along the NAF was undertaken during the Marsite Cruise (Ruffine et al., 2018a,b). Through combination of acoustic survey and ROV dives, new active sites were discovered and sampled in the Çinarcik Basin, in 102 103 104 105 106 107 108 109 110 111 112 113 114 115 116 117 118 119 120 121 122 123 124 125
the Western High and in the Central High, as well as in the Tekirdağ Basin (Ruffine et al., 2018b). Gases that are venting at the seafloor consist mainly of methane-rich mixtures (up to > 99 %-mol), some of which containing significant amount of other hydrocarbon. The contribution of light n-alkanes is thought to reflect hydrocarbon formation within sediments in the SoM via organic matter degradation, both thermocatalytic cracking of organic matter and microbial reduction of oxidized carbon-bearing species have been suggested (Gürgey et al., 2005; Ruffine et al., 2018b).
3. Methods
Gas samples were collected in the course of the Marsite Cruise in November 2014. Method for gas sampling and preservation are outlined in details inRuffine et al., (2015, 2018b). Seafloor gas vents were identified by coupling water column acoustic guiding and visual inspection with the ROV Victor 6000. The most vigorous gas vents were then sampled with the PEGAZ sampler, a sampling device manipulated by the ROV which is designed to sample gas bubbles and preserve them at in situ pressure. Gas aliquots were then sub-sampled at pressure ranging between 2 and 4 bars in 12 mL Labco vials. These Labco vials were then used for measuring the gas composition (light alkanes, N2 and CO2
contents) as well as bulk isotope geochemistry (δ13C, δD) on light alkane (including methane). All these
isotope analyses were performed at ISOLAB in the Netherlands. Results were reported and discussed by Ruffine et al., (2018b).
Methane gas samples were purified and analyzed at UCLA to obtain methane isotopologue abundances. The ratios 13CH
3D/12CH4, 12CH2D2/12CH4, 13CH4/12CH4, and 12CH3D/12CH4 are measured
with the prototype Nu Instruments Panorama, a high-resolution gas-source double-focusing mass spectrometer at UCLA. Mass-18 isotopologue compositions are reported versus a stochastic distribution (Wang et al., 2004), representing a theoretically infinite temperature, and expressed in per mil using the capital delta notation:
126 127 128 129 130 131 132 133 134 135 136 137 138 139 140 141 142 143 144 145 146 147 148 149
Δ13CH
3D= [(13CH3D/12CH4)sample/(13CH3D/12CH4)stochastic – 1] x 1000 (1)
and
Δ12CH
2D2= [(12CH2D2/12CH4)sample/(12CH2D2/12CH4)stochastic – 1] x 1000 (2).
Methods for sample purification and isotope ratio measurements are outlined in detail by Young et al., (2016, 2017) and briefly summarized here. Prior to measurements of isotopologues, methane is purified on a vacuum line interfaced with a gas chromatograph (GC). Two GC columns are coupled in series using He as the carrier gas. The first column consists of a 3-m long, 1/8-inch OD stainless steel tubing, packed with 5A molecular sieve and is used to separate H2, Ar, O2 and N2 from CH4 and other alkanes.
The second column is used to separate CH4 from other hydrocarbons and consists of a 2-m long
1/8-inch OD stainless steel tubing packed with HayeSep D porous polymer. Peaks are identified on a passive TCD. In order to measure 12CH
4+, 13CH4+, 12CH3D+, 13CH3D+ and 12CH2D2+ ion currents, the mass
spectrometer is set to a mass resolving power equal to or greater than 40000. This allows resolving of the two mass-18 isotopologues (13CH
3D and 12CH2D2), both measured on the axial collector with an
electron multiplier. Meanwhile, mass-16 and mass-17 isotopologues are measured on Faraday collectors with amplifier resistors of 1011 Ω. Sample and reference bellows are adjusted so that ion
current intensities are balanced. The current intensities are rebalanced after each measurement cycle. At first, the magnet is set to measure simultaneously 12CH
3D+/12CH4+ and 12CH2D2+/12CH4+ ratios, with 12CH
2D2+ (18.04385 amu) being measured on the axial collector. In a second setting, the magnet is set to
measure 13CH
3D+ (18.04090 amu) on the axial collector, and 13CH4+/12CH4+ and 13CH3D/12CH4+ ratios are
measured simultaneously. Overall, the external 1σ error (n= 5) including both the accuracy and the 150 151 152 153 154 155 156 157 158 159 160 161 162 163 164 165 166 167 168 169 170 171 172 173
reproducibility is estimated to be ± 0.1 ‰ for Δ13CH
3D, ± 0.8 ‰ for Δ12CH2D2, ± 0.1 ‰ for δ13C, and
of approximately ± 0.3 ‰ for δD. Note that the measurements of methane δ13C and δD values
performed conjointly with the rare methane isotopologues are within uncertainties of measurements previously performed at ISOLAB.
4. Results
The measurements of Δ13CH
3D and Δ12CH2D2 allow the description of methane isotopic
bond-ordering in a given sample. At thermodynamic equilibrium both Δ13CH
3D and Δ12CH2D2 should be
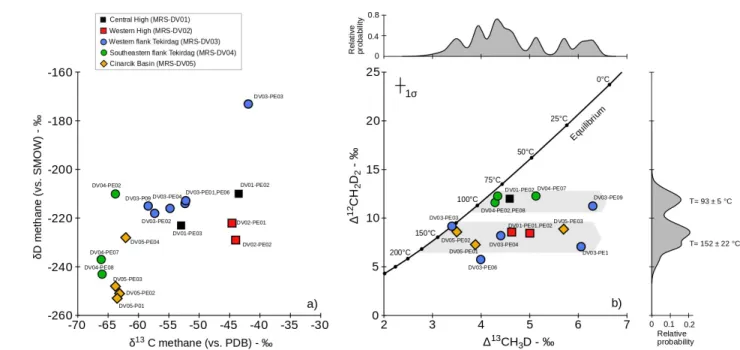
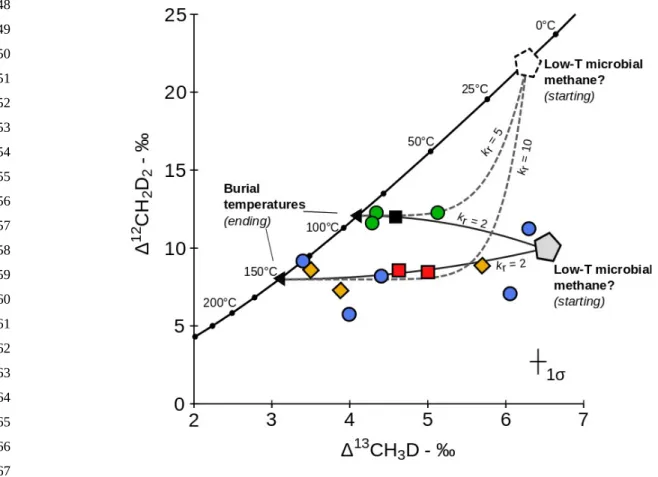
concordant in recording the same temperature of equilibrium. The data are shown in Figure 3, together with the theoretical thermodynamic equilibrium curve (Young et al., 2016). Samples DV04-PE02, DV04-PE08, DV01-PE02, DV03-PE03 and DV05-PE02 appear close to equilibrium, though they show two populations of Δ13CH
3D and Δ12CH2D2 values (Fig. 3b). The first group composed of samples
DV03-PE03 and DV05-PE02 define average Δ13CH
3D and Δ12CH2D2 values of 3.45 ± 0.1 ‰ and
8.88 ± 0.4 ‰ yielding apparent concordant temperatures of 127− 5+ 5°Cand 135−7+7°C , respectively.
These consistent temperatures are indistinguishable, and suggest that isotope ordering was in response to thermodynamic equilibrium in these samples. The second group composed of samples DV01-PE02, DV04-PE02 and DV04-PE08, define average Δ13CH
3D and Δ12CH2D2 of 4.40 ± 0.16 ‰ and
11.96 ± 0.32 ‰, yielding nearly concordant apparent temperatures of 77− 8+7°C and 92− 4+4°C, respectively.
The remaining samples appear shifted to the right of the equilibrium curve to varying degrees, i.e. they show higher Δ13CH
3D values at a given Δ12CH2D2 relative to equilibrium (Fig. 3b). For these, it is not
clear whether any temperature information can be a priori obtained from either D13CH
3D or D12CH2D2.
Probability density plots indicate that the distribution of Δ12CH
2D2 values is bi-modal (Fig. 3b), with
peaks at 8.01 ± 1.08 ‰ and 11.88 ± 0.44 ‰, corresponding to apparent temperatures of 152±22 °C and 93±5 °C, respectively. These two temperatures are remarkably similar to maximum temperatures 174 175 176 177 178 179 180 181 182 183 184 185 186 187 188 189 190 191 192 193 194 195 196 197
reached by two main source rocks in the area, the Eocene Hamitabad Formation and the Oligocene Mezardere Formation (Huvaz et al., 2005; Gürgey, 2009).
Samples from the western flank of the Tekirdağ Basin (DV03) may be taken as a telling illustration of the overall complexity of our dataset. These gases show the widest variability in methane doubly-substituted isotopologue signatures, with Δ13CH
3D ranging from 3.4 to 6.3 ‰, and Δ12CH2D2
ranging from 5.7 to 11.2 ‰. These samples also show the largest variability in C1/C2+ values ranging
from 10 to 1560 (Fig. 2), and bulk δ13C ranging from -41.2 to -58 ‰ (Fig. 2, Fig.3a). However,
perhaps most curious is that two samples, DV03-PE01 and DV03-PE06 are nearly identical both in their gas composition and in their bulk isotopic signatures (Fig. 2, Fig. 3a), and yet show significantly different Δ13CH
3D values at a given Δ12CH2D2, being members of the two distinct groups defined by the
two peaks in Δ12CH
2D2 values (Fig. 3b). This is also true for samples from the Çinarcik Basin (DV05)
and, though less significant, for samples from the southeastern flank of the Tekirdağ Basin (DV04. All of these samples have been previously interpreted as dominantly microbial in origin (Ruffine et al.,
2018). In other words, we observe a decoupling between conventional tracers and clumped methane
signatures.
Decoupling also appears for some samples which are distinct in gas composition and in bulk isotope signatures but are similar in the isotopologue space (Fig. 3b). The most striking case are the DV03-PE03 (Tekirdağ Basin) and the DV05-PE02 (Çinarcik Basin) samples. They both plot on (or near) the equilibrium curve at an equivalent temperature of 130°C. However, they have distinct bulk isotope compositions. Sample DV03-PE03 shows relatively high 13C (of -41.2 ‰) together with low
C1/C2+ (of 10) which could reflect a thermogenic end-member (Ruffine et al., (2018b) similar to
oil-associated gases found in the Thrace Basin (Huvaz et al., 2005; Gürgey, 2009). An apparent equilibrium temperature of ~130°C derived from both Δ13CH
3D and Δ12CH2D2 would indicate a
temperature generally consistent with the typical range expected for thermogenic gas generation (Tissot
198 199 200 201 202 203 204 205 206 207 208 209 210 211 212 213 214 215 216 217 218 219 220 221
and Welte, 1978). On the other hand, based on the lack of C2+ (C1/C2+ = 1456) and low 13C and D
values -63 ‰ and -251 ‰ respectively, sample DV05-PE02 appears microbial in origin (i.e. derived from microbial methanogenesis). For this sample, apparent temperatures of [12CH
2D2]t=[ 12CH 2D2]EQ+ 12CH 2D2 é ë ùûo -12CH 2D2 é ë ùûEQ
{
}
e-k1t and 139 − 13 +14°C, derived from Δ13CH3D and Δ12CH2D2 respectively, are within uncertainty of the upper temperature limit
for life of ~ 121 °C (Kashefi and Lovley, 2003; Takai et al., 2008).
Overall, variations observed in the Δ13CH
3D and Δ12CH2D2 space do not correlate with bulk
isotope ratios or in C1/C2+. This suggests that the isotope bond ordering is responding to forcings that
are not obviously related to gas composition or bulk isotope ratios.
5. Discussion
5.1. Isotope-bond reordering
First studies on methane isotopologues have provided consistent observations when investigating methane of thermogenic or microbial origin. Apparent agreement between Δ13CH
3
D-based temperatures and measured environmental temperatures, or expected formation temperatures were observed for most thermogenic gases (Stolper et al., 2014b, 2015, 2017; Wang et al., 2015; Douglas et al., 2016). In addition, concordant temperature from both Δ12CH
2D2 and Δ13CH3D in the
same samples supports the idea that thermogenic methane in natural settings is generally at ‘bond ordering’ equilibrium (Young et al., 2017; Giunta et al., 2019). Yet, the mechanism by which isotopologues reach equilibrium in nature is still unclear, as thermogenic generation is generally thought to be controlled by kinetics (e.g. Clayton, 1991; Tang et al., 2000; Stolper et al., 2017; Xia and Gao, 2019). Recently, experimental and modeling works have also shown that disequilibrium signatures could be expected during gas generation and/or accumulation in reservoirs (Shuai et al., 2018; Xia and Gao, 2019), yet it does not seem to be common in most natural settings.
222 223 224 225 226 227 228 229 230 231 232 233 234 235 236 237 238 239 240 241 242 243 244
On the other hand, microbial methane is associated with large isotopologue disequilibrium under laboratory conditions, often yielding negative Δ13CH
3D (Wang et al., 2015; Stolper et al., 2015;
Young et al., 2017; Douglas et al., 2017 Gruen et al., 2018; Giunta et al, 2019) and markedly negative Δ12CH
2D2 values (Young et al., 2017; Giunta et al, 2019; Gonzalez et al., 2019) (Fig. 4). The causes of
the disequilibrium are beyond the scope of this study but may include: the rate of methanogenesis (e.g.
Wang et al., 2015, Stolper et al., 2015), the metabolic pathways (Giunta et al., 2019; Young 2019), statistical combinatorial effects (Young et al., 2017; Cao et al., 2019; Taenzer et al., 2020), and/or quantum tunneling effects (Young et al., 2017; 2019). In natural settings, disequilibrium signatures similar to those observed in laboratory are commonly observed (e.g. Wang et al., 2015; Douglas et al., 2016; Giunta et al., 2019; Young, 2019), however, there are certain environments, such as in marine sediments, where isotopologue signatures appear closer to equilibrium with environmental temperatures (e.g. Wang et al., 2015; Stolper et al., 2015; Douglas et al., 2016; Inagaki et al., 2015; Giunta et al., 2019; Ash et al., 2019). This led some authors to propose that isotopologue signatures during microbial methanogenesis would be largely controlled by the degree of metabolic reversibility
(Wang et al., 2015; Stolper et al., 2015), and may sometimes, especially in the deep biosphere, result in methane in isotopologue equilibrium. Young et al. (2017) argued that microbial communities may drive methane towards equilibrium in nature, and Young (2019) presented preliminary evidence for the potential role of methanotrophic organisms performing Anaerobic Oxidation of Methane (AOM) in re-ordering atomic bonds within methane molecules towards the equilibrium (also supported by Giunta et
al., 2019). Ash et al. (2019) presented evidence that AOM causes methane to achieve equilibrium
Δ13CH
3D and D12CH2D2 values in the sediments from the Bornholm Basin, Baltic Sea. Both proposed
mechanisms for equilibration lack unequivocal experimental validation at present.
In SoM gases, samples DV03-PE03 and DV01-PE02 were identified as dominantly thermogenic in origin (Ruffine et al., 2018b) and define two distinct but concordant temperatures of 245 246 247 248 249 250 251 252 253 254 255 256 257 258 259 260 261 262 263 264 265 266 267 268
~130 °C and ~90 °C, respectively (Fig. 3b). Both temperatures are consistent with the ‘gas window’ for thermogenic generation (Tissot and Welte, 1978) and with maximum temperatures reached by two main source rocks in the area, the Eocene Hamitabad Formation and the Oligocene Mezardere Formation (Huvaz et al., 2005; Gürgey, 2009). We therefore interpret these data as recording characteristic regional temperatures for methane equilibration.
In contrast, samples DV05-PE02, DV04-PE02 and DV04-PE08 are considered to be dominantly microbial in origin on the basis of 13C < -60 ‰ and C
1/C2+ > 1000, but nonetheless plot on (or near)
the equilibrium curve at temperatures of ~90 and ~130 °C, the same two temperatures recorded by the thermogenic samples (Fig. 3b). It is unlikely that these relatively high temperatures for nominally microbial gases are the result of hyper-thermophilic activity in sediments of the SoM. A temperature of ~130 °C slightly exceeds the upper temperature limit for life of ~ 121 °C, a maximum that has so far only been observed for optimal laboratory conditions and for archeal strains that are typical of energy-rich hydrothermal vent environments (Kashefi and Lovley, 2003; Takai et al., 2008). The temperature limit for microbial degradation of organic matter in subsurface sedimentary settings that are nutrient-starved systems [REF] is considered to be 80-90°C (Head et al., 2003), and possibly even lower at ~60 °C in deeply buried sediments (Inagaki et al., 2015). For these reasons, we conclude that an equilibrium temperature of ~ 130 °C for natural methane with microbial traits must necessary reflect a ‘non-enzymatic’ (i.e. abiotic) re-equilibration to a temperature reached during sediment burial, rather than the actual temperature of formation of microbial methane in the subsurface. This explanation may also hold true for putative microbial methane equilibrated at temperatures of ~ 90 °C (DV04-PE04 and DV04-PE08). The implication is that the production and accumulation of microbial methane occurred prior to burial, after which it re-equilibrated upon the heating that attended burial. Accordingly, we this can not exclude that thermogenic gases now appearing on the equilibrium D12CH
2D2 vs. D13CH3D curve 269 270 271 272 273 274 275 276 277 278 279 280 281 282 283 284 285 286 287 288 289 290 291
have inherited their equilibrium signature from a similar re-equilibration mechanism, rather than from their actual formation.
Rates for re-equilibration of 13CH
3D/12CH4 and 12CH2D2/12CH4 isotopologue ratios, especially at
relatively low temperatures, are unknown. Wang et al., (2018) have speculated that rates for re-equilibration of 13CH
3D may follow the rates for ‘external’, or inter-species re-equilibration of D/H
ratios between methane and water in hydrothermal systems. They extrapolated from a small body of experimental data at 200, 323 and 400 °C that the timescale for CH4 isotopic bond re-ordering in the
absence of a metal catalyst would be on the order of 109 years for temperature of 150 °C, and > 1010
years below 100 °C. This would suggest that the relative abundances of methane isotopologues are not subject to resetting in most sedimentary settings. This conclusion appears to be contradicted by our observations. In fact, our dataset argues in favor of faster isotopologue re-ordering rates than those for inter-species isotope exchange with environmental (reservoir) waters. Our data requires that methane re-equilibration at rather cool (< 150 °C) subsurface conditions can occur, promoted or catalyzed by a mechanism that remains to be identified. Recently, a similar process was suggested to account for
12CH
2D2 re-ordering down to 65 °C with no resolvable 13CH3D re-equilibration in well characterized
marine hydrothermal vent fluids (Labidi et al., 2020).
From this data-set, it is clear that we cannot determine with certainty whether methane achieved bond equilibrium via exchange with other molecules. Source reservoirs are not readily accessible to sampling, precluding assessments of inter-species (e.g., CH4 and H2O) isotopic exchange. The fact that
samples DV05-PE02 and DV05-PE03 have identical δD values, but distinct Δ13CH
3D values, one at
equilibrium based on concordance with D12CH
2D2, and the other not, may indicate that re-equilibration
among methane molecules can occur without significant isotope exchange with other molecular species that would cause shifts in the methane bulk δD values. The alternative is that these two samples have reached D/H equilibrium with the same source of hydrogen but did not reach mass-18 isotopologue 292 293 294 295 296 297 298 299 300 301 302 303 304 305 306 307 308 309 310 311 312 313 314 315
equilibrium. In either case, it appears as though rates for bond equilibration and for inter-species re-equilibration are decoupled.
The probability distributions in Fig. 3b suggest that D12CH
2D2 has experienced a greater degree
of re-equilibration than D13CH
3D. We investigate the prospects for this in greater detail in Section
5.2.4. The catalysis of hydrogen isotope exchange among alkanes has been studied for almost a century (see recent review by Sattler, 2018), but remains poorly understood for temperatures and timescales that might be relevant for geological applications. Transition metals are well known to catalyze hydrogen exchange with methane (Horibe and Craig, 1995) and have been shown to promote isotopologue equilibrium at temperatures above 150 °C (Stolper et al., 2014; Ono et al., 2014; Young et al., 2016). Recent studies have also demonstrated the potential of aluminum oxide (in the form of γ-alumina) in promoting re-equilibration of methane to temperatures as low as 1 °C (Wang et al., 2019; Eldridge et al., 2019). In both cases, it is not clear how this type of catalysis can be relevant to sedimentary environments. Alternatively, exchange mediated by clay mineral surfaces might be a process to consider, as clays are known to promote hydrogen exchange on larger organic molecules
(Alexander et al., 1982, Sessions et al., 2004).
5.2. Departures from Equilibrium 5.2.1. Mixing
Methane samples that do not record concordant temperatures of ~90 and ~130 °C exhibit variable but significant degrees of disequilibrium, all plotting to the right of the equilibrium curve in Fig. 3b and exhibiting relatively large variations in D13CH
3D and relatively small variations in
D12CH2D2. Based on bulk isotope ratios and molecular ratios, these gases may have D12CH2D2 and
D13CH3D values resulting from mixing between thermogenic and microbial gases (Fig. 2; Ruffine et al.,
2018b). However, mixing, if it occurred, may now be disguised by varying degrees of re-equilibration 316 317 318 319 320 321 322 323 324 325 326 327 328 329 330 331 332 333 334 335 336 337 338 339
based on the evidence summarized in Fig. 3b. Nonetheless, vestiges of disequilibrium in isotopologue space due to mixing may persist. In general, the samples showing the largest offset from the equilibrium curve (DV03-PE01, DV03-PE09 and DV05-PE03) are considered to be dominantly microbial in origin based on bulk isotope ratios and the molecular concentrations comprising the gas. This suggests that one end-member for mixing was microbial, perhaps having D12CH
2D2 and D13CH3D
values characteristic of microbial methanogenesis in the laboratory and in some natural settings. The magnitude of the disequilibrium observed in our data is much less than that obtained from microbial methanogenesis in laboratory cultures (Young et al., 2017) and from samples of microbial methanogenesis origin in natural settings investigated to date where both Δ13CH
3D with Δ12CH2D2 have
been measured (Giunta et al., 2019; Young 2019) (Fig. 4). Invoking a microbial end-member with a signature similar to those measured in the laboratory would imply that the most disequilibrated samples in this study are composed of no more than 40 to 60 % microbial methane (Fig. 4). While mixing of this end-member with a thermogenic component explains the isotopologue data (Fig. 4), this relatively low fraction of microbial methane would be inconsistent with their C1/C2+ > 1000 usually considered
indicative of a nearly pure microbial origin (e.g. Bernard et al., 1976). This observation may in turn suggest that microbial methane in deep biosphere do necessarily resemble laboratory cultures (e.g. Wang et al., 2015; Stolper et al., 2015; Douglas et al., 2016; Giunta et al., 2019).
Gases from the Western High (DV02-PE01 and PE02) identified as mainly thermogenic also have disequilibrium D13CH
3D and D12CH2D2 values (Fig. 3b.) while showing little evidence of a
microbial contribution (low C1/C2+ of ~15). Therefore, thermogenic gases may also have contributed to
disequilibrium D13CH
3D and D12CH2D2 values in mixtures. Deciphering the impact of mixing is
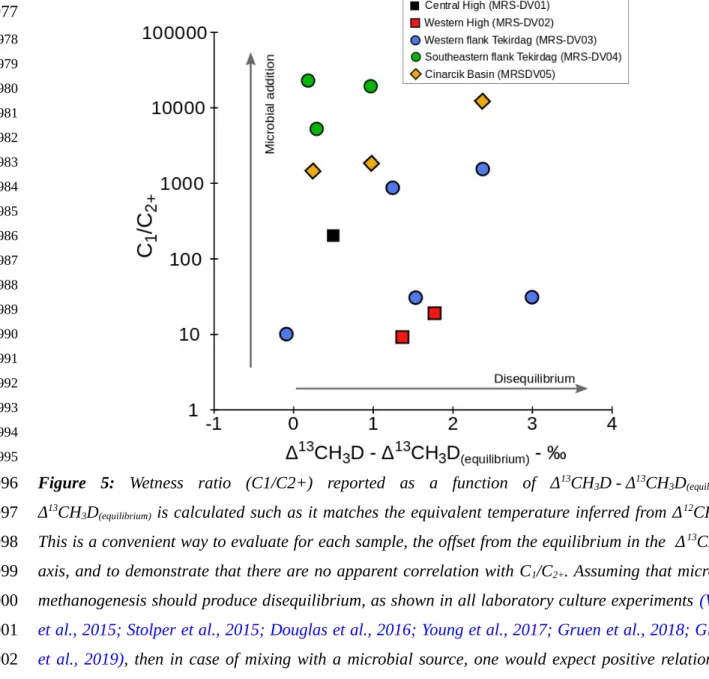
exacerbated by a lack of correlation between C1/C2+ and disequilibrium isotopologue signatures (Fig 5).
In any event, the Δ13CH
3D and Δ12CH2D2 data from the SoM fail to follow a simple two-component
mixing in which thermogenic gases with low C1/C2+ ratios are mixed with microbial gases with
340 341 342 343 344 345 346 347 348 349 350 351 352 353 354 355 356 357 358 359 360 361 362 363
elevated C1/C2+ ratios. Mixing does not seem to be the primary cause of variable mass-18 isotopologues
in these samples.
5.2.2 Mass-dependent fractionation during migration
An alternative explanation for the disequilibrium trend of highly variable D13CH
3D values and
relatively minor variations in D12CH
2D2 is mass fractionation of the SoM gases during their migration
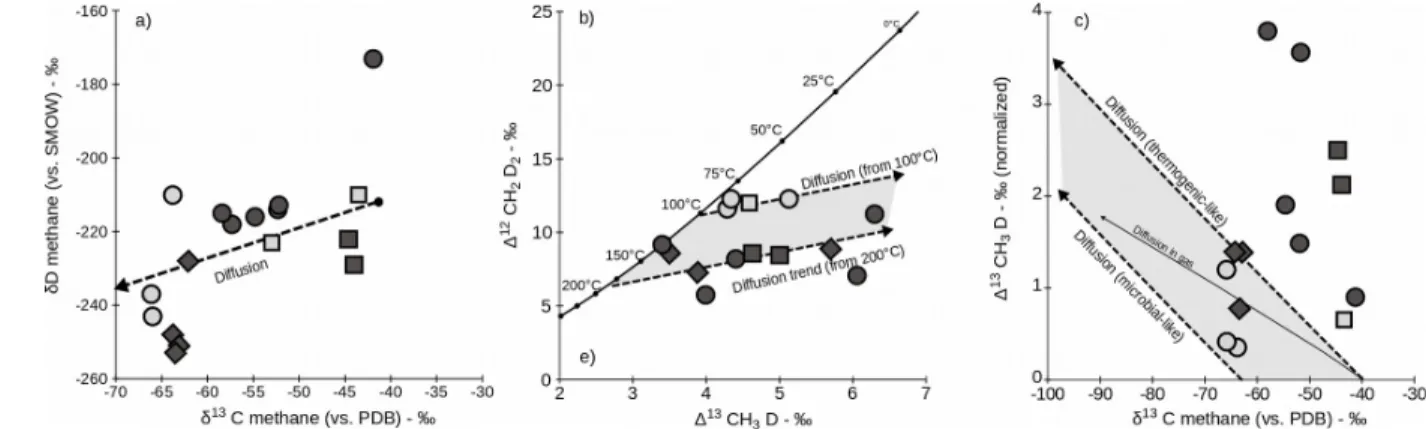
in the subsurface (i.e. for example from source rock to reservoir or from reservoir to reservoir) and/or to the seafloor. Though migration of free gas (bubbles) to the seafloor is an advective process and is therefore not a mechanism for fractionating isotopologues, diffusive transport prior to gas saturation can segregate methane molecules according to their masses. Diffusion favors the light isotopologues for the diffused gas (as opposed to the residual gas) resulting in decreases in δ13C and δD values but
increases in D13CH
3D and D12CH2D2 values. In Δ12CH2D2 vs. Δ13CH3D space both axes refer to the same
integer mass ratio of 18/16, and any fractionation by molecular mass, including by diffusion, should produce a 1:1 slope in this space (Young et al., 2017). A 1:1 relationship is also expected for gases affected by diffusion in δD vs. δ13C space since both axes refer to integer mass ratios of 17/16. In the
SoM gas samples, the slope-1 relationship expected between δ13C and δD values by mass segregation
according to molecular weight is only crudely evident when taken in aggregate (Fig. 6a). However, the data are more consistent with a diffusive fractionation process if one considers that Δ13CH
3D and
Δ12CH
2D2 are distributed along two distinct diffusion trends starting from two equilibrium temperatures
of about ~100 and 200 °C (Fig. 6b). These temperatures are at the high-temperature ends of the two groups of samples shown in Fig. 3b.
If diffusion is at play, samples showing the largest offset from the equilibrium curve in mass-18 isotopologue space should be relatively low in bulk δ13C and δD. In detail however, when assigning
self-consistent diffusion coefficients to all methane isotopologues, it appears that an enrichment of 364 365 366 367 368 369 370 371 372 373 374 375 376 377 378 379 380 381 382 383 384 385 386 387
> 3 ‰ in Δ13CH
3D as observed in our data should be associated with a shift in bulk δ13C by ~ -50 ‰
(Fig. 6c). This is not observed; our entire suite of data do not range over more than ~ 25 ‰ in δ13C, so
that the overall observed range of variations in Δ13CH
3D appears intrinsically inconsistent with
diffusion (or any mass-dependent process) being a dominant mechanism at play in the subsurface of the SoM. We conclude that diffusion is not a principal mechanism affecting the mass-18 isotopologue abundances in our methane samples.
5.2.3 Microbial methane oxidation
Apparent temperatures inferred from Δ13CH
3D range from 131−7+6°C (DV03-PE03) to 9− 3+3°C
(DV03-PE09), perhaps representing a range from a deep reservoir temperature to a near seafloor temperature (~ 14°C) if taken at face value. Thus, one may speculate that venting gases had their Δ13CH
3D values
equilibrated during their ascent towards a near-seafloor temperature, without significantly re-equilibrating Δ12CH
2D2 values. Several recent studies have stressed the potential importance of
microbial Anaerobic Methane Oxidation (AOM) in re-ordering isotopic bond associations in methane gas, and thus causing methane to progressively evolve towards equilibrium at ambient temperatures for both mass-18 isotopologues (e.g. Young et al., 2017; Giunta et al., 2019; Ash et al., 2019). The uptake of methane by methanotrophic organisms, in particular by archeal strains performing AOM, is a widespread process generally occurring in the first few meters of marine sediments, thus at a temperature that should not be drastically different from those at the seafloor. AOM has been recognized as a major methane sink in sediments from the SoM (e.g. Crémière et al., 2012), including in those surrounding the gas seeps studied here (Teichert et al., 2018). However, our samples were all collected as free-gas (i.e. bubbles), which is generally considered non-accessible to AOM (Luff and
Wallmann 2003; Treude et al., 2003). For AOM to have impacted the gas studied here, it would be
required to have occurred prior to gas saturation. AOM is expected to yield a progressive enrichment of 388 389 390 391 392 393 394 395 396 397 398 399 400 401 402 403 404 405 406 407 408 409 410 411
both δ13C and δD in the residual methane (e.g. Whiticar, 1999; Holler et al., 2011), however there is no
specific relationship between off-equilibrium signature and bulk signatures in our data-set (Fig. 6c may illustrate that too). In marine sediments however, AOM is expected to occur with significant reversibility effects (e.g. Yoshinaga et al., 2014), perhaps implying that a classic kinetic framework is not relevant for this type of settings. The study of methane in shallow sediments from the Bornholm Basin, Baltic Sea, yielded showed evidence for re-equilibration in Δ13CH
3D and Δ12CH2D2 to
environmental temperature with little effects on the bulk δ13C and δD signatures (Ash et al., (2019).
This study suggests that shifts in Δ13CH
3D and not Δ12CH2D2, as observed in our data, being the result
of AOM is unlikely.
A caveat to this conclusion arises because of preliminary experimental results suggesting that AOM under a set of restrictive conditions may yield signatures similar to our disequilibrated samples
(Young, 2019). These preliminary results suggest that under low sulfate content (< 1 mM), AOM mediation would re-equilibrate Δ13CH
3D to environmental temperatures while maintaining the
Δ12CH
2D2 virtually unchanged. It is unclear how these results may be extrapolated to marine settings,
but the similarity with our data-set suggests that effects on methane isotopologues due to AOM cannot be ruled out entirely. We note that the presence of a largely D13CH
3D AOM effect driving equilibration
towards colder temperatures would not be inconsistent with non-enzymatic re-equilibration as described above. The AOM would simply modify the isotopologue abundances equilibrated at ~90 and ~130 °C, prior to AOM.
5.2.4. Different re-equilibration rates for D 13 CH
3D and Δ12 CH 2D2 ?
In the above sections we have discussed two mechanisms that could cause re-equilibration of methane isotopologue abundances. We suggested that non-enzymatic (i.e. abiotic) intra-methane exchange could cause re-equilibration of microbial (and perhaps thermogenic) gases formed at low 412 413 414 415 416 417 418 419 420 421 422 423 424 425 426 427 428 429 430 431 432 433 434 435
temperatures to higher temperatures characteristic of known temperatures reached during sediment burial in the area (section 5.1). The bi-modal distribution of Δ12CH
2D2 values suggests re-equilibration
to two distinct temperatures of ~152 °C and ~90 °C that appear consistent with the thermal history of sediments beneath the SoM. Enzymatic (i.e. biotic) facilitated exchange of isotopes among methane gas molecules could have caused Δ13CH
3D to partially re-equilibrate to near seafloor temperatures, perhaps
during gas ascent to the seafloor (section 5.2.3). As discussed before, the bi-modal distribution of Δ12CH
2D2 data seem to point towards two distinct temperatures of ~152 °C and ~90 °C that appear
consistent with the thermal history of sediments beneath the SoM. The variable D13CH
3D data span a
range of apparent temperatures from ~130 °C to ~10 °C. Based on these observations, one may speculate that our data illustrate that re-equilibration rates for the relative abundances of 13CH
3D and 12CH
2D2 may be different.
More specifically, the bi-modal Δ12CH
2D2 values at two geologically plausible temperatures
suggest isotopic bond re-ordering to equilibrium or near-equilibrium values, while Δ13CH
3D values are
are more variable, perhaps as a result of only partial re-equilibration. This would imply that Δ12CH 2D2
re-equilibrates faster than Δ13CH
3D, and that Δ13CH3D carries a memory of pre-reset conditions. Note
this scenario does not allow the microbial methane, prior to re-equilibration, to be as low in Δ13CH 3D as
observed in culture studies (< 4 ‰ ; e.g. Young et al., 2017) and would rather suggest a microbial methane (prior re-equilibration) with Δ13CH
3D ~ 6 ‰ (equivalent to T ~ 15°C), consistent with the idea
of a deep biosphere methane being nearly equilibrated with environmental temperatures in Δ13CH 3D.
In order to explain our data as being purely the result of different rates of equilibration for
12CH
2D2 and 13CH3D, we use a simple kinetic model for exchange. In this model, we consider the
intra-methane exchange reaction:
12CH D +12CH D a1k1 ¾¾® ¬¾¾ 12CH D +12CH 436 437 438 439 440 441 442 443 444 445 446 447 448 449 450 451 452 453 454 455 456 457 458
where a1 is the equilibrium fractionation factor and k1 is the rate constant. A simple rate equation for this reaction is d 12CH 2D2 é ë ùû dt =a1k1 12CH 3D é ë ùû 2 - k1é12CH2D2 ë ùû 12CH 4 é ë ùû (4)
For simplification, the concentration of 12CH
4 is set to unity ([12CH4] = 1), making what follows all
relative to 12CH
4. We also invoke the approximation that a1k1[12CH3D]2 is a constant. This is justified
since the concentration of 12CH
2D2 relative to CH4 is about 10-8 while that of 12CH3D is 10-4, so
[12CH
3D] >> [12CH2D2] even when working at the per mil level. In other words, we treat the change in
the [12CH
2D2]/[12CH4] ratio as a change in [12CH2D2] only in the rate equation. With this approximation,
and some rearrangements, one obtains the solution to the differential equation as being
[12CH 2D2]t=[ 12CH 2D2]EQ+ 12CH 2D2 é ë ùûo -12CH 2D2 é ë ùûEQ
{
}
e-k1t (5) .where t is the time of the observation, the EQ subscript indicates equilibrium, and the o subscript indicates the initial value. Notice that as t →∞, Equation (x) reduces to [12CH
2D2]t = [12CH2D2]EQ. This
equation can be further rearranged into a more convenient form by dividing through by the equilibrium concentration of CH2D2, yielding [12CH 2D2]t- [ 12CH 2D2]EQ 12CH 2D2 é ë ùûo -12CH 2D2 é ë ùûEQ =e-k1t (6) 460 461 462 463 464 465 466 467 468 469 470 471 472 473 474 475 476 477 478 479 480
The left-hand side of Equation (x) is the fractional approach to equilibrium. The analogous exchange reaction for 13CH 3D is 12CH 3D + 13CH 4 a2k2 k2 ¾¾¾® ¬¾ ¾¾ 13CH3D + 12CH 4 (7) and results in [13CH 3D]t- [ 13CH 3D]EQ 13CH 3D é ë ùûo -13CH 3D é ë ùûEQ =e-k2t . (8) The form of Equations (7) and (8) show that if the rate constants are the same, and so the e-folding times being ti = 1/ki are the same, then the relative rates of equilibration depend on the degree of
disequilibrium. For example, for an initial gas -50‰ out of equilibrium in D12CH
2D2 and -2‰ out of
equilibrium in 13CH
3D, after t = 2t, we obtain D12CH2D2 = -7‰ relative to equilibrium (a total shift of
+43‰) and 13CH
3D is -0.3‰ relative to equilibrium (a total shift of +1.6‰). So, if the rate constants
for D/H exchange, for example, are the same for the two isotopologues, we should see much larger shifts in 12CH
2D2 relative to those in 13CH3D, but, when the former is at equilibrium, the latter should be
also.
We find that unequal rate constants are required to explain our data if the methane prior to re-equilibration was in equilibrium at the lower temperatures suggested by the highest D13CH
3D values.
Indeed, for such initial conditions, we calculate that the rate for re-equilibrating Δ12CH
2D2 would have
to be 5 to 10 times that of Δ13CH
3D to explain a nearly-horizontal relationship as observed in Figure 7.
Whether such large difference of re-equilibration rates between the two isotopologues is likely or not will have to be explored in future experimental work. However, based on an analysis of the rates of equilibration based on the symmetry numbers for reactants and transition states (see Labidi et al., 2020
and Supplementary material), we conclude that one should not expect k1/k2 (i.e., the rate constant for
481 482 483 484 485 486 487 488 489 490 491 492 493 494 495 496 497 498 499 500 501 502
suggests that the initial mass-18 isotopologue composition was below the equilibrium curve (Fig. 7). An initial composition such as this for a microbial gas is not unreasonable given the propensity of microbial methanogenesis to produce low D12CH
2D2 values in general, even in some marine
environments (e.g., Ash et al., 2019).
6. Implications for the use of methane isotopologues as geothermometers
Three pathways for methane generation (abiotic, thermogenic and microbial) are generally expected to be controlled by kinetic effects rather than by thermodynamic equilibrium. It is thus remarkable that in many instances in nature, especially for thermogenic gases, the ‘clumped’ composition appears consistent with bond equilibrium. Hence, assessing whether such equilibrium is inherited: 1) from the formation of the methane itself; or 2) from isotopic bond-order re-equilibration under conditions and timescales that remain to be defined, is critical for understanding the true meaning of ‘clumped’-based temperatures. In the first case, the ‘clumped’ composition may accurately record the formation temperature of the methane, whereas in the second case, it is overprinted by a re-equilibration temperature experienced at a point in time in the thermal history of the gas.
We suggest that pristine Δ13CH
3D and Δ12CH2D2 signatures inherited from methane generation,
in particular of microbial methanogenesis, have been fully or partially overprinted by re-equilibration within the subsurface of the SoM. This conclusion thus supports the idea that in sedimentary reservoirs, isotopologue equilibrium might sometimes be reached after CH4 formation. The timescales for
re-equilibration remain to be established. Though these rates certainly depend on the associated mineralogy as well as on the presence of H-bearing molecules, they likely scale with temperature
(Stolper et al., 2017). This suggests that ‘clumped’-based temperatures are more prone to record the highest temperatures experienced by the gases. Considering that thermogenic gases are formed continuously during burial, thus spanning a wide range of temperatures, methane formed at lower 504 505 506 507 508 509 510 511 512 513 514 515 516 517 518 519 520 521 522 523 524 525 526 527
temperatures eventually re-equilibrates to the highest temperature reached. This hypothesis would explain why temperatures derived from ‘clumped’ isotopologues for thermogenic gases often match the maximum burial temperatures (Stolper et al., 2014, 2017).
On the other hand, data from sedimentary reservoirs in Southwest Ontario and Michigan basins
(Giunta et al., 2019) show considerable Δ12CH
2D2 disequilibrium, illustrating a mixing relationship
between thermogenic and microbial methane (see Fig. 4). Those disequilibrium signatures are similar to those observed in laboratory cultures, and suggests that re-equilibration in these reservoirs was limited (if any), thus contrasting with the Marmara system studied here. A possible explanation is that samples from Southwest Ontario and Michigan basins come from sedimentary units that never experienced temperatures greater 40-50 °C. We thus speculate that an activation temperature exist, below which rates for re-equilibration are too slow for significant effects on Δ13CH
3D and Δ12CH2D2
over geological timescales. Identifying threshold temperatures would help define where to expect re-equilibration of microbial methane that is generally formed at lower temperatures than thermogenic gases. From our data, isotopologue equilibrium measured for samples of apparent microbial origin, samples DV05-PE02, DV04-PE04 and PE08, indicates that re-equilibration to temperatures down to 90 °C likely occurs. Not withstanding that re-equilibration rates are likely a function of in situ chemical and mineralogical conditions, the contrasting results of these two studies may in turn suggest that a temperature of 40-50 °C is not sufficient for significant re-equilibration of methane isotopic bond ordering.
5/ Conclusion
We measured Δ13CH
3D and Δ12CH2D2 from methane-rich cold seeps emanating at the seafloor
of the sea of Marmara (SoM). The variability observed among the samples further demonstrates the occurrence of a multitude of distinct gas reservoirs in the subsurface of the SoM, which is consistent 528 529 530 531 532 533 534 535 536 537 538 539 540 541 542 543 544 545 546 547 548 549 550 551
with previous observations based on gas geochemistry (Ruffine et al., 2018b), as well as on seismic imaging (Geli et al., 2018).
Although Δ13CH
3D and Δ12CH2D2 have been recently used to infer the dominant production
mechanism (including sometimes, formation temperature) or mixing relationship between different sources of methane (e.g. Giunta et al., 2019), here we show that methane isotopologues signatures in the SoM cannot be simply explained by mixing. Instead, methane effusing from the SoM seafloor appear to be affected, to varying degrees, by bond re-equilibration, a process in which the isotope bond-ordering inherited from the formation of the methane is subsequently ‘re-set’ to thermodynamic equilibrium during residence at sufficiently high temperatures. This conclusion may suggest that apparent isotopologue equilibrium like overwhelmingly displayed among thermogenic gases (Stolper et al., 2014, 2015, 2017; Wang et al., 2015; Young et al., 2017; Giunta et al., 2019) can in some cases be acquired after formation and therefore, that isotopologue apparent temperatures may trace re-equilibration temperatures rather than the actual formation temperature.
Acknowledgments
We thank the captain an his crew on-board the RV Pourquoi pas? This study was supported by fundings from the European programme “MARsite” under the call ENV.2012.6.4-2, as well as by LabexMER (ANR-10-LABX-19) through the project MicroGaMa. The authors wish to thank Nina Tanguy for providing the bathymetric map. They also thank Dr. David T. Wang, one anonymous reviewer and Dr. Laura Robinson for their helpful comments.
552 553 554 555 556 557 558 559 560 561 562 563 564 565 566 567 568 569 570 571 572 573 574 575
Appendices
Isotopologue relationship to temperature
The relationship between Δ13CH
3D and Δ12CH2D2 and temperature can be predicted through ab initio
calculations (e.g. Ma et al., 2008; Webb and Miller, 2014; Liu and Liu, 2016). In this study, we used the recent expressions proposed by Young et al., (2016, 2017):
Δ13CH 3D (T) ≈ 1000 ln (1 + 0.0355502/T – 433.038/T2 + 1270210.0/T3 – 5.94804 x 10⁸/T4 + 1.196630 x 10¹¹/T5 – 9.07230 x 10¹²/T6) A.1 and Δ12CH 2D2 (T) ≈ 1000 ln (1 + 0.183798/T – 785.483/T2 + 1056280.0/T3 + 9.37307 x 10⁷/T4 – 8.919480 x 10¹⁰/T5 + 9.901730 x 10¹²/T6) A.2
where T is in Kelvin. The differences between the different computational methods to predict relationship between Δ values and temperatures are less than the analytical uncertainties (Webb and Miller, 2014; Liu and Liu, 2016, Young et al., 2017).
576 577 578 579 580 581 582 583 584 585 586 587 588 589 590 591 592 593 594 595 596 597 598 599 600 601 602 603 604 605 606 607 608 609 610 611 612 613 614 615 616 617 618
References
Alexander, R., Kagi, R. I., & Larcher, A. V. (1982). Clay catalysis of aromatic hydrogen-exchange reactions. Geochimica et
Cosmochimica Acta, 46(2), 219-222.
Ambraseys, N. N., & Jackson, J. A. (2000). Seismicity of the Sea of Marmara (Turkey) since 1500. Geophysical Journal
International, 141(3), F1-F6.
Armijo, R., Meyer, B., Barka, A., de Chabalier, J. B., Hubert-Ferrari, A., & Cakir, Z. (2000). The fault breaks of the 1999 earthquakes in Turkey and the tectonic evolution of the Sea of Marmara: a summary. The 1999 İzmit and Düzce
earthquakes: preliminary results, 55-62.
Ash, J., Egger, M., Treude, T., Kohl, I., Cragg, B., Parkes, R. J., ... & Young, E. D. (2019). Exchange catalysis during anaerobic methanotrophy revealed by 12CH2D2 and 13CH3D in methane. Geochemical Perspective Letters, 10, 26-30. Bernard, B. B., Brooks, J. M., & Sackett, W. M. (1976). Natural gas seepage in the Gulf of Mexico. Earth and Planetary
Science Letters, 31(1), 48-54.
Berner, U., and Faber, E., 1996, Empirical carbon isotope/maturity relationships for gases from algal kerogens and terrigenous organic matter, based on dry, open-system pyrolysis: Organic Geochemistry, v. 24, no. 10-11, p. 947-955. Bourry, C., Chazallon, B., Charlou, J. L., Donval, J. P., Ruffine, L., Henry, P., ... & Moreau, M. (2009). Free gas and gas hydrates from the Sea of Marmara, Turkey: Chemical and structural characterization. Chemical Geology, 264(1-4), 197-206. Çağatay, M. N., Yıldız, G., Bayon, G., Ruffine, L., and Henry, P., 2018, Seafloor authigenic carbonate crusts along the submerged part of the North Anatolian Fault in the Sea of Marmara: Mineralogy, geochemistry, textures and genesis: Deep Sea Research Part II: Topical Studies in Oceanography.
Cao, X., Bao, H., & Peng, Y. (2019). A kinetic model for isotopologue signatures of methane generated by biotic and abiotic CO2 methanation. Geochimica et Cosmochimica Acta, 249, 59-75.
Clayton, C. (1991). Carbon isotope fractionation during natural gas generation from kerogen. Marine and petroleum
geology, 8(2), 232-240.
Crémière, A., Pierre, C., Blanc-Valleron, M. M., Zitter, T., Çağatay, M. N., & Henry, P. (2012). Methane-derived authigenic carbonates along the North Anatolian fault system in the Sea of Marmara (Turkey). Deep Sea Research Part I:
Oceanographic Research Papers, 66, 114-130.
Douglas, P. M. J., Stolper, D. A., Smith, D. A., Anthony, K. W., Paull, C. K., Dallimore, S., ... & Sessions, A. L. (2016). Diverse origins of Arctic and Subarctic methane point source emissions identified with multiply-substituted isotopologues.
Geochimica et Cosmochimica Acta, 188, 163-188.
Eldridge, D. L., Korol, R., Lloyd, M. K., Turner, A. C., Webb, M. A., Miller, T. F., & Stolper, D. (2019). Comparison of Experimental vs. Theoretical Abundances of 13CH3D and 12CH2D2 for Isotopically Equilibrated Systems From 1-500° C.
ACS Earth and Space Chemistry.
Gasperini, L., Polonia, A., Bortoluzzi, G., Henry, P., Le Pichon, X., Tryon, M., Cagatay, N., and Geli, L., 2011, How far did the surface rupture of the 1999 Izmit earthquake reach in Sea of Marmara?: Tectonics, v. 30.
Géli, L., Henry, P., Zitter, T., Dupré, S., Tryon, M., Çağatay, M. N., ... & Natalin, B. (2008). Gas emissions and active tectonics within the submerged section of the North Anatolian Fault zone in the Sea of Marmara. Earth and Planetary
Science Letters, 274(1-2), 34-39. 620 621 622 623 624 625 626 627 628 629 630 631 632 633 634 635 636 637 638 639 640 641 642 643 644 645 646 647 648 649 650 651 652 653 654 655 656 657 658 659 660 661 662 663 664 665 666 667 668 669
Géli, L., Henry, P., Grall, C., Tary, J. B., Lomax, A., Batsi, E., ... & Sengör, A. M. C. (2018). Gas and seismicity within the Istanbul seismic gap. Scientific reports, 8(1), 6819.
Giunta, T., Young, E. D., Warr, O., Kohl, I., Ash, J. L., Martini, A., ... & LaRowe, D. E. (2019). Methane sources and sinks in continental sedimentary systems: New insights from paired clumped isotopologues 13CH3D and 12CH2D2. Geochimica
et Cosmochimica Acta, 245, 327-351.
Gonzalez, Y., Nelson, D.D., Shorter, J.H., McManus, J.B., Dyroff, C., Formolo, M., Wang, D.T., Western, C.M. and Ono, S., 2019. Precise measurements of 12CH2D2 by tunable infrared laser direct absorption spectroscopy. Analytical Chemistry, 91(23), pp.14967-14974.
Gruen, D. S., Wang, D. T., Könneke, M., Topçuoğlu, B. D., Stewart, L. C., Goldhammer, T., ... & Ono, S. (2018). Experimental investigation on the controls of clumped isotopologue and hydrogen isotope ratios in microbial methane.
Geochimica et Cosmochimica Acta, 237, 339-356.
Gürgey, K., Philp, R., Clayton, C., Emiro lu, H., and Siyako, M., 2005, Geochemical and isotopic approach to maturity/source/mixing estimations for natural gas and associated condensates in the Thrace Basin, NW Turkey: Applied Geochemistry, v. 20, no. 11, p. 2017-2037.
Gürgey, K. (2009). Geochemical overview and undiscovered gas resources generated from Hamitabat petroleum system in the Thrace Basin, Turkey. Marine and Petroleum Geology, 26(7), 1240-1254.
Head, I. M., Jones, D. M., & Larter, S. R. (2003). Biological activity in the deep subsurface and the origin of heavy oil.
Nature, 426(6964), 344.
Holler, T., Widdel, F., Knittel, K., Amann, R., Kellermann, M. Y., Hinrichs, K. U., ... & Wegener, G. (2011). Thermophilic anaerobic oxidation of methane by marine microbial consortia. The ISME journal, 5(12), 1946-1956.
Inagaki, F., Hinrichs, K. U., Kubo, Y., Bowles, M. W., Heuer, V. B., Hong, W. L., ... & Kaneko, M. (2015). Exploring deep microbial life in coal-bearing sediment down to~ 2.5 km below the ocean floor. Science, 349(6246), 420-424.
James, A.T. and Burns, B.J., 1984. Microbial alteration of subsurface natural gas accumulations. AAPG Bulletin, 68(8), pp.957-960.
Kashefi, K., & Lovley, D. R. (2003). Extending the upper temperature limit for life. Science, 301(5635), 934-934.
Labidi, J., Young, E. D., Giunta, T., Kohl, I. E., Seewald, J., Tang, H., ... & Früh-Green, G. L. (2020). Methane thermometry in deep-sea hydrothermal systems: evidence for re-ordering of doubly-substituted isotopologues during fluid cooling.
Geochimica et Cosmochimica Acta.
Luff, R., & Wallmann, K. (2003). Fluid flow, methane fluxes, carbonate precipitation and biogeochemical turnover in gas hydrate-bearing sediments at Hydrate Ridge, Cascadia Margin: numerical modeling and mass balances. Geochimica et
Cosmochimica Acta, 67(18), 3403-3421.
Martini, A. M., Walter, L. M., Budai, J. M., Ku, T. C., Kaiser, C. J., & Schoell, M. (1998). Genetic and temporal relations between formation waters and biogenic methane: Upper Devonian Antrim Shale, Michigan Basin, USA. Geochimica et
Cosmochimica Acta, 62(10), 1699-1720. 670 671 672 673 674 675 676 677 678 679 680 681 682 683 684 685 686 687 688 689 690 691 692 693 694 695 696 697 698 699 700 701 702 703 704 705 706 707 708 709 710 711 712 713 714 715 716 717 718
Prinzhofer, A., & Pernaton, E. (1997). Isotopically light methane in natural gas: bacterial imprint or diffusive fractionation?.
Chemical Geology, 142(3-4), 193-200.
Reeves, E. P., Seewald, J. S., & Sylva, S. P. (2012). Hydrogen isotope exchange between n-alkanes and water under hydrothermal conditions. Geochimica et Cosmochimica Acta, 77, 582-599.
Ruffine, L., Dennielou, B., Giovanni, B., Namik, Ç. M., Grall, C., Jean-Luc, C., ... & Etoubleau, J. (2012). Geochemical
dynamics of the natural-gas hydrate system in the Sea of Marmara, offshore Turkey. INTECH Open Access Publisher.
Ruffine, L., Ondreas, H., Blanc-Valleron, M. M., Teichert, B. M., Scalabrin, C., Rinnert, E., ... & Donval, J. P. (2018a). Multidisciplinary investigation on cold seeps with vigorous gas emissions in the Sea of Marmara (MarsiteCruise): Strategy for site detection and sampling and first scientific outcome. Deep Sea Research Part II: Topical Studies in Oceanography,
153, 36-47.
Ruffine, L., Donval, J. P., Croguennec, C., Burnard, P., Lu, H., Germain, Y., ... & Madre, D. (2018b). Multiple gas reservoirs are responsible for the gas emissions along the Marmara fault network. Deep Sea Research Part II: Topical Studies in
Oceanography, 153, 48-60.
Ruffine, L., Germain, Y., Polonia, A., de Prunelé, A., Croguennec, C., Donval, J. P., ... & Grall, C. (2015). Pore water geochemistry at two seismogenic areas in the Sea of Marmara. Geochemistry, Geophysics, Geosystems, 16(7), 2038-2057. Sattler, A. (2018). Hydrogen/Deuterium (H/D) exchange catalysis in alkanes. ACS Catalysis, 8(3), 2296-2312.
Sessions A. L., Sylva S. P., Summons R. E. and Hayes J. M. (2004). Isotopic exchange of carbon-bound hydrogen over geologic timescales. Geochim. Cosmochim. Acta 68, 1545–1559
Schoell, M. (1988). Multiple origins of methane in the Earth. Chemical geology, 71(1-3), 1-10.
Shuai, Y., Douglas, P. M., Zhang, S., Stolper, D. A., Ellis, G. S., Lawson, M., ... & Hu, G. (2018). Equilibrium and non-equilibrium controls on the abundances of clumped isotopologues of methane during thermogenic formation in laboratory experiments: Implications for the chemistry of pyrolysis and the origins of natural gases. Geochimica et Cosmochimica
Acta, 223, 159-174.
Stolper, D. A., Sessions, A. L., Ferreira, A. A., Neto, E. S., Schimmelmann, A., Shusta, S. S., ... & Eiler, J. M. (2014). Combined 13 C–D and D–D clumping in methane: Methods and preliminary results. Geochimica et Cosmochimica Acta,
126, 169-191.
Stolper, D. A., Lawson, M., Davis, C. L., Ferreira, A. A., Neto, E. S., Ellis, G. S., ... & Sessions, A. L. (2014). Formation temperatures of thermogenic and biogenic methane. Science, 344(6191), 1500-1503.
Stolper, D. A., Martini, A. M., Clog, M., Douglas, P. M., Shusta, S. S., Valentine, D. L., ... & Eiler, J. M. (2015). Distinguishing and understanding thermogenic and biogenic sources of methane using multiply substituted isotopologues.
Geochimica et Cosmochimica Acta, 161, 219-247.
Stolper, D. A., Lawson, M., Formolo, M. J., Davis, C. L., Douglas, P. M., & Eiler, J. M. (2017). The utility of methane clumped isotopes to constrain the origins of methane in natural gas accumulations. Geological Society, London, Special
Publications, 468, SP468-3. 719 720 721 722 723 724 725 726 727 728 729 730 731 732 733 734 735 736 737 738 739 740 741 742 743 744 745 746 747 748 749 750 751 752 753 754 755 756 757 758 759 760 761 762 763 764 765 766