Determinants of Energy Intensity in Industrializing Countries A Comparison of China and India
By Feiya Huang Master of Science
South-Central University for Nationalities, China (2003) Submitted to the Department of Urban Studies and Planning
in partial fulfillment of the requirements for the degree of Master in City Planning
at the
MASSACHUSETTS INSTITUTE OF TECHNOLOGY
June 2006
© 2006 Feiya Huang. All Rights Reserved
The author hereby grants to MIT permission to reproduce and to distribute publicly paper and electronic copies of this thesis document in whole or in part in any medium now known or hereafter created.
I! ,,r'
MASSACHUSETTS INSTMJTE
OF TECHNOLOGY
OCT 2 6 2006
LIBRARIES
Department of Urban StudiVs and Planning May 25, 2006 I I
Certified by
Accepted by
Professor Karen R. Polenske Department of Urban Studies and Planning Thesis Supervisor
Professor Langley Keyes Chair MCP Committee Department of Urban Studies and Planning
ARCHIVES
Determinants of Energy Intensity in Industrializing Countries A Comparison of China and India
By
Feiya Huang
Submitted to the Department of Urban Studies and Planning On May 25, 2006 in partial fulfillment of the
Requirements for the Degree of Master in City Planning
ABSTRACT
The amount of final energy per unit of economic output (usually in terms of gross domestic product, or GDP), known as energy intensity, is often used to measure the effectiveness of energy use and the consumption patterns of different economies.
China and India are both developing countries with large population and rapid economic growth. China has decreased its energy intensity by 67% from 1978 to 2003; while India only decreased its energy intensity by 5% over the same period. By applying shift-share analysis on each country's industry sector, I decompose their changes of industrial energy intensity into two factors: structural change and efficiency change; then, I explore the determining factors of energy intensity in China and India, and analyze why they are different.
The result shows that, in China, the driving force of energy-intensity change is the improvement of energy efficiency, which decreases the energy intensity. Meanwhile, structural-mix changes played a low, but positive, role in decreasing the energy intensity. In India, energy efficiency also plays a positive role. However, the industrial structure has become more energy-intensive because of the increasing share of energy-intensive
sub-sectors, which offsets the impact of energy efficiency on energy intensity; thus, the overall energy intensity only decreased slightly in India over time.
Thesis Supervisor: Karen R. Polenske
Title: Professor of Regional Political Economy and Planning
Thesis Reader: John Reilly
Title: Associate Director for Research for Joint Program on the Science and Policy of Global Change
AKNOWLEGEMENT
I would like to express my sincere gratitude to my research and thesis supervisor, Professor Karen R. Polenske, who provided me great support and encouragement
throughout my study and research at MIT. I also thank Dr. John Reilly for reviewing my thesis and giving me insightful comments and suggestions.
My sincere appreciation is extended to Dr. Sharon Stanton Russell, for providing me most of the financial support without which I could not have made my study at MIT. Her attitude about work and life will always guide me.
I am grateful to Professor Hong Wei and Xin Han, who gave me enormous support during my hard time.
Thanks to Catherine Seaborn, my co-worker at the energy-intensity research group, for discussing the research work and cooperating with me. Many thanks to Chia-Chin Cheng , Anjali Mahendra, and Rajendra Kumar for providing me valuable data sources. Thanks to Hongliang Zhang for giving me suggestions on conversions of data.
Thanks to my parents and my sister, for their continual support and love.
Finally, I want thank my husband, Xiaodong Wang, who has shared with me all the difficulties and successes, and supported me all the time with his love.
CONTENTS
Abstract ... 2
Acknowledgement ... 3
Contents ... 4
Figures and Tables...5
Chapter 1 Introduction ... 6
H ypothesis ... 9
Literature review ... ... 10
Chapter 2 Methodology and Data ... 16
Comparative Analysis ... 16
Shift-Share A nalysis ... ... 16
D ata sources and lim itations ... ... 19
Chapter 3 Comparative Analysis of the Energy Intensity Differences between China and India ... 21
Energy intensity change ... ... 21
Econom ic structure ... ... 22
Sum m ary ... 30
Chapter 4 Shift-Share Analysis of the Energy Intensity in India, 1982-1998 ... 32
Overall results ... 32
The effects of structural change ... 38
The effects of efficiency change ... 43
Sum m ary ... 45
Chapter 5 Shift-Share Analysis of the Energy Intensity in China, 1980-2003... 48
Overview of previous study results... 48
Construction of Data ... ... 50
Overall Results ... 51
The effects of structural change ... 54
The effects of efficiency change ... 56
Sum m ary ... 57
Chapter 6 Comparison of Energy-Intensity Determinants: China and India ... 60
Sum m ary ... ... 63
Chapter 7 Conclusion and Policy Implications... ... ... 65
Policy im plication ... 67
Limitations and future studies... 69
Reference ... 72
FIGURES
Figure 1 Energy intensity in selected countries, 1980-2003 ... 7
Figure 2 Energy Intensity of China and India, 1980-2003 ... ... 22
Figure 3 Composition of GDP in China and India ... ... 23
Figure 4 Sector Share of Energy Consumption in China... ... 26
Figure 5 Sector Share of Energy Consumption in India... ... 26
Figure 6 Energy Consumption by Source in China ... ... 29
Figure 7 Energy Consumption by source in India ... 29
Figure 8 Share of Energy Consumption by Source in China, 1980-2003 ... 30
Figure 9 Share of Energy Consumption by Source in India, 1980-2003 ... 30
Figure 10 Industrial Energy Intensity, India, 1982-1997... 33
Figure 11 Energy Intensity of Industrial Sub-Sectors in India, 1982-1998 ... 40
Figure 12 Composition of Industrial Output in India, 1982-1998 ... 41
Figure 13 Energy Intensity of Industry Sector in China... ... 51
Figure 14 Energy Intensity of China's Industrial Sub-Sectors ... 55
Figure 15 Shift Share analysis of Energy Intensity in India (1980-1998) ... 60
Figure 16 Shift Share Analysis of Energy Intensity in China, 1993-1998 ... 61
TABLES Table 1 Shift-Share Analysis of Energy Consumption in... 35
Table 2 Shift-Share Analysis of Energy Intensity in ... ... 37
Table 3 Changes in Energy Intensity in... ... 38
Table 4 Shift-share Analysis of Energy Intensity in China's Industrial Sector, 1980-1988 ... 4 8 Table 5 Shift-Share Analysis of Energy Intensity in China's Material Production Sector, 1986-1995 ... 49
Table 6 Shift-Share Analysis of Energy Intensity in China's Industrial Sectors, ... 52
Table 7 Shares of Two Factors of Energy Intensity in China's Industrial Sector, 1993-200 1 ... 54
Table 8 Changes in Composition of Industrial Output in China, 1993-2001 (Percent of total industrial output)... 56
Table 9 Energy Intensity of Industrial Sectors ... 57
Table 10 Percentage of industrial share in India, 1982-1997 ... 62
Chapter 1
Introduction
Energy intensity measures the overall energy use relative to economic output, usually
Gross Domestic Product (GDP), which measures output purchased by final users. It
indicates the effectiveness of energy use and the consumption patterns of different
economies, and provides a rough basis for projecting energy consumption. Structure and
level of demand for energy services, together with the performance of end-use
technologies, largely determine the magnitude of final energy demand. The degree of
interdependence between economic activity and energy use is neither static nor uniform
across regions. Therefore, energy intensity differs among different countries and
changes over time.
Figure 1 presents the energy-intensity levels in different countries from 1980 to 2003
(EIA, 2005). Between 1978 and 2003, the energy intensity of the United States fell by
37%; in China, the energy intensity dropped by 67%; while in India, another Asian
developing country, the energy intensity fluctuated slightly over time, and overall it only
14.U S4.UU m 3.50 S3.00
'2.50
- 2.00 ";c 1.50 -W 2 1.00>C 0.50
*
0.00
-.- United States U Brazil AIran
-*-- China-
n-
niala
0)0)0) CD )0))0 W) (DO - 00) C)) 0) )0" " C)0))) ) 0 C) M)Year
Energy intensity= Energy consumption (Kgce) per unit of GDP (Constant 2000 U.S. dollars using Market Exchange Rates)
Kgce= Kilogram of coal equivalent
Source: Energy Information Administration (EIA), International Energy Annual 2003.
Figure 1 Energy Intensity in Selected Countries, 1980-2003
Energy is universally recognized as one of the most significant inputs for economic growth and human development. China and India both have a remarkable economic and population growth. China has a population of 1.3 billion with an area of 9.6 million square kilometers (km2) in 2004, while India has a population of 1.1 billion with an area of 3.2 million km2 in 2004 (CIA, 2005). Both China and India's GDP growth has been twice the global rate in the past 20 years. China has grown at an annual average of 9.7% since the economic reforms were initiated in 1978; India's GDP has expanded at 5.8% a year since the economy was opened up in 1991 (Ahya, et al. 2004).
Rapid growth of the economy and population usually requires a growing consumption of energy, and typically energy consumption grows faster than GDP in developing countries. This is, as Lin (1992, p. 195) indicated, the result of several major changes associated with development: industrialization, increases in the capital-to-labor ratio, substitution of
commercial energy for traditional energy, the construction of modem infrastructure, and urbanization, all of which usually lead to increases in energy consumption and
energy/GDP ratio.
However, as industrialization proceeds and incomes rise, saturation effects, as well as an expansion of the service sector (which is less energy intensive), decrease the energy
intensity after it reaches a peak. In developing countries, technological leapfrogging (i.e. , bypassing some of steps followed in industrialized countries in the past and jumping
directly to modem technologies) to the use of highly efficient appliances, machinery, process, vehicles and transportation systems, and other energy technologies, offers considerable potential for energy efficiency improvements (WEA, 2000). China follows this route as its energy intensity has been falling rapidly since 1975 while India also decreased its energy intensity but only modestly.
Most energy-intensity analysts attribute the change of energy intensity to the effects of sectoral shift and technology change. To explore the underlying determinants of the different trends of energy intensity in China and India, I conduct a comparative analysis to examine if such effects are different in these two countries. I focus more on the industrial sector, because both countries are in the process of industrialization, and industry sectors generate a large proportion of GDP--5 1.1% in China and 26.4% in India in 2001 (ADB, 2002), while consuming the largest proportion of primary energy. For
example, in 2001, the industry sector in China accounted for 45.2% of total commercial energy consumption; in India, it accounted for 36.5% (WRI, 2005).
Hypothesis
Energy intensity in a given economy is determined by two major factors: industrial
structure and energy efficiency (Lin 1992). I believe that such factors functioning
differently in determining the energy intensity in India and China. My hypothesis is that
in China, the industrial structure has a positive impact on reducing the energy intensity, reinforcing the impact of energy efficiency on energy intensity; thus, the energy intensity
in China has declined in recent years. In India, these two factors both change fairly
slightly hence contribute trivially to the change of energy intensity; or, these factors
played opposite roles and offset each other of the impact on energy intensity.
Industrial structure indicates the effect of structural changes on energy use. In my
research, I examine two levels of industrial structure: sectoral structure and sub-sectoral
structure. Sectoral structure means the composition of sectors in the national economy:
agriculture, industry, commerce, etc. By sub-sectoral structure, I refer to the detailed
structure within the industry, especially the manufacturing industries: food, chemicals, metallurgy, textiles, etc. Generally, industry is more energy intensive than commerce
(Kambara 1992), while, by definition, heavy industry is more energy intensive than light
industry. For example, in China, the energy intensity of iron and steel (heavy industry) is
2.48 kgce/dollar in 2001, while the energy intensity of textile (light industry) is 0.3
kgce/dollar. Therefore, different economic structures and industrial structures cause
Efficiency change measures the change in energy efficiency in a specific sector or sub-sector over time. For a specific sub-sector, a negative (positive) efficiency change indicates that the energy efficiency in this sector has improved (declined) over time. In China, because the energy intensity declined dramatically overtime, I expect to find that both the industrial mix and efficiency improvement played positive role in reducing the energy intensity. In India, the overall energy intensity only changed slightly; therefore, I expect to find a lower contribution of both factors, or, these factors played opposite roles and offset each other of the impact on energy intensity.
Literature review
Scholars have been interested in explaining why aggregate energy intensity of an economy has changed over time, and they have developed different methods to decompose or attribute it to underlying causes. Such analyses mainly differ in the methodology used and the empirical findings.
(1) Methodology
Many analysts of energy intensity use the method of structural decomposition analysis (SDA), which decomposes the energy intensity into different components, such as output effect, intensity effect, and structure effect (Sun 1998; Lin 1994; Zhang 2003). Using this method, analysts assume that the aggregate industrial energy consumption is the sum of consumption in m different sectors (e.g. food, textiles, metal products, etc.). The aggregate energy intensity is the summation of the sectotal production share multiplied by its energy intensity (sectoral energy consumption divided by its industrial output). The variation of the aggregate energy intensity from time 0 to time t is expressed as the
summation of structural change and sectoral intensity. Different decomposition methods differ mainly in the means of calculating structural change and sectoral intensity.
The most often used decomposition methods are Laspeyres and arithmetic mean divisia index (AMD). Generally speaking, analysts use the Laspeyres index decomposition method to compare each of the components of energy usage patterns with a fixed base year, while holding the other components constant. Arithmetic means divisia index
(AMD) method uses integral index number to capture the year-to-year change rate (Ang and Zhang, 2000).
The Shift-Share analysis is a Laspeyres-based decomposition method. Lin (1992) used this method to examine the change of China's energy intensity for the period of
1980-1988, using 1980 as a fixed base year. He divided energy use into three components: constant share, industrial mix, and efficiency change. He found that the improvements in energy efficiency rather than changes in industrial structure were the dominant forces behind China's energy intensity reduction during 1980-1998. I explain the framework of this method in Chapter 2.
Econometric analysis is an AMD-based decomposition method. Analysts use time-series methods to apply either a rolling base year or an annually changing weighting scheme (Greening et al. 1997). This type of method captures how energy consumption has
which allows for changing weights or parameter values through time in response to changing energy inputs and outputs (Liu et al. 1992; Ang and Lee 1994).
Generally, energy-intensity analysts rely on the method of decomposition, because only by decomposing can they capture the factors that determine energy usage, particularly the technological aspects, or the mix of energy-using activities.
(2) Empirical findings on determinations of energy intensity
Many analysts used different methodologies to explore the determination of energy intensity in different countries. Comillie et al. studied the decrease of energy intensity in central and East Europe transition countries during 1992- 1998 by decomposing energy data with the use of econometric analysis. They used panel data to identify the main factors driving the improvements in energy intensity. Their finding was that energy prices and progress in enterprise restructuring were the two most important drivers for more efficient energy use. Howrath et al. (1993) used the Laspeyres method to examine the trends in the structure and intensity of final energy demand in five Organisation for Economic Co-operation and Development (OECD) countries between 1973 and 1988. They concluded that the changes in the structure of a nation's economy would lead to substantial changes in its energy/GDP ratio, which was unrelated to the changes in the technical efficiency of energy utilization. Ang (1994) used the time-series data of industrial energy intensity for Singapore and Taiwan. The results showed that changes in sectoral electricity intensities (efficiency change) was the major reason causing the changes of overall energy intensity in Singapore from 1974-1984; and structural change
was the major contributor of energy intensity change during 1985-1990. In the case of Taiwan, the efficiency change was the predominant factor through 1971-1991.
(3) Analysis of China's declining energy intensity
China's dramatic decline in energy intensity during 1980-2000 has triggered many
studies. The results of these studies varied in terms of major contribution to the declining energy intensity in three respects:
* Efficiency improvement
Most of the analysts, including Sinton and Levine (1994), Lin and Polenske (1994), Garbaccio et al. (1999), and Zhang (2003), argued that the improvement in energy efficiency was the primary factor explaining the decline of China's energy intensity. They used the decomposition methodology based on a fixed base year, which measured the difference between would-be (if the energy intensity is equal to the base year) and actual energy intensity of a specific year. The results indicated a large contribution of efficiency improvement.
* Structural shift
In contrast to the above studies, Kambara (1992) argued that a structural shift from more energy-intensive industrial sub-sectors to less energy-intensive ones was the major cause of the energy-intensity decline in China. Such different results were mainly due to the methodology he used. Kambara did not use the decomposition model; instead, he compared the regional energy consumption and economic activity in China. He found
that, because of the different economic structure, East and South China, which have more energy-efficient sectors than other parts of the country, generated a larger proportion of
GDP, while their energy consumption was much lower than that in the West and North
China, which have more energy-intensive sectors.
* Multifactor determination
Other scholars, Sinton and Fridley (2000) and Fisher-Vanden, et al. (2004) for instance, provided a multifactor explanation. They stressed the importance of some other factors, such as environmental and energy-efficiency policies, research and development
expenditures, and ownership reform in enterprise sectors.
Compared with the studies on China's energy intensity, there is much less research conducted on India's energy intensity. This is partially because the energy intensity in India did not show a significant change during the same period (1980-2003).
Mukhopadhyay et al. (2005) used input-output tables (1983, 1989, 1993, and 1998) to measure direct and indirect energy intensity. They found that energy intensity in different sectors had decreased but still could be reduced further by changing technologies and improving energy efficiency in economic activities.
Although China and India are both regarded as large energy consumption countries and both have rapid economic growth, very few scholars have probed into why there are different trends of energy intensity in these two nations. By comparing the underlying determinants of their different energy- intensity trends, I provide some policy
implications in terms of energy conservation and structural improvements to both China and India.
Chapter 2
Methodology and Data
The methodologies I use are mainly based on previous literature.
Comparative Analysis
Focacci (2005) used comparative analysis to examine the environmental and energy polices in Brazil, China, and India, focusing on different macroeconomic indicators. Focacci's major finding was that a gradual increase in the importance of service sectors and the corresponding reduction in manufacturing industry explained the reduction in
energy intensity. I will use a comparative analysis of energy and economic indicators to show the different performances of the indicators in China and India. The indicators include (1) energy intensity over time; (2) sources of final energy consumption; (3) composition of GDP in terms of economic structure; (4) energy consumption in each sector over time; (5) composition of GDP in terms of sub-sectors of industry; and (6) energy consumption in each sub-sector during time. I will also compare the extent of contribution of energy-efficiency improvement and structural shift to energy intensity in both countries.
Shift-Share Analysis
Based on the analysis by Lin (1992), I will examine energy intensity changes in industrial sector in China and India.
* Shift-share technique
The shift-share technique analyzes the changes in energy use over time. Using this
technique, analysts divide energy use into three components: constant share, industrial
mix, and efficiency change. Algebraically, the three components are defined as follows
(Lin, 1992):
Et= eo*Ot+ -[(ei, o - eo)*O, t] + -[(ei t -ei,o)* Oi,t] (1) (Constant share) (Industrial mix) (Efficiency change)
Where
Et = actual energy consumption in the industrial sector in year t;
Ot = total industrial output in year t;
Oi,t = output of industrial i in year t;
eo = overall industrial energy intensity at base year;
ei, = energy intensity for industry i at base year; and
ei,t= energy intensity for industry i, year t,
Constant share indicates the energy consumption that would have occurred if the energy
intensity had remained at the same level as the base year.
By dividing both sides of Equation (1) by Ot, I obtain the following equation, which describes the impact of industrial structure and energy efficiency on energy intensity:
et =eo + Y[(ei,o -eo)*Oi,t]/ Ot + C [(ei,t -ei,o)*O,t] /Ot (2)
i i
Where et is Et / Ot, which is the energy intensity for the industrial sector as a whole in a given year. The industrial mix and efficiency change measure the effects of structural shift and efficiency improvement, respectively.
Using Equation (2), I obtain data to show the contributions of structural shift and efficiency improvement to the change of energy intensity in China and India over time. Comparing the contribution of these components, I can examine which factors are the main determinants of energy intensity in both countries and how large such impacts are; moreover, I can examine which country will have the most potential improvement in these components.
* Strengths and weaknesses of the technique
The energy shift-share technique is a useful method to decompose the energy intensity changes over time into effects of industrial shift and efficiency shift. Therefore, we can analyze the contribution of each factor to the overall change of energy intensity, and hence examine how governments can affect these changes. Analysts also use shift-share analysis to forecast long-term energy demand and conservation possibilities. Energy intensity is usually used to project future energy consumption assuming that the ratio of energy consumption to output is relatively stable overtime. By decomposing the energy intensity into industrial mix and efficiency, analysts can use the technique to adjust the values of energy intensity in future years according to projected or planned industrial structure and efficiency levels. This should be more accurate than the projection based only on the energy consumption/output ratio.
However, the shift-share analysis has its limitations. First, it is a descriptive method, which only shows how much of the change in energy intensity is caused by industrial mix change or efficiency change. However, it cannot explain why these two factors change. Second, the results of shift-share analysis are not invariant to industrial disaggregation. For any given year, the industrial mix and efficiency shift might change if the
classification of industries is changed. As Lin (1992) pointed out, an infinite
disaggregation would reduce the efficiency shift to zero and contribute all changes in energy consumption and energy intensity to industrial mix. On the other extreme, aggregating all industries into one will attribute all the changes to efficiency differences. Finally, the choice of base year may also bias the results. Because the impacts of industrial mix and efficiency change are calculated through the difference of actual energy intensity and base year intensity, the result might be biased if the base year is not "normal" in the study period.
Data sources and limitations
The major data sources in my research are the national statistical data. Data of China mainly come from China Statistical Yearbook and China Energy Statistical Yearbook; data of India mainly come from India Industrial Annual Survey, obtained from
www.indiastat.com. These official data are fairly reliable; however, there are also limitations. First, there are variations among different official statistical books and international statistics (e.g., EIA and other data). Second, the classifications of some key indicators are different in two countries. In my research, in order to make the comparison, I adjust the data into the same classification in some cases, which might cause errors in
the analysis. Third, because not all the data of these two countries can be adjusted to the
same classification, the comparison is not absolutely sufficient. For example, the energy
intensity in China is measured by primary energy consumption divided by total value of
industrial output; while for India, the energy intensity is measured by fuels consumption
divided by total value of industrial output. Therefore, the data and analysis I present here
Chapter 3
Comparative Analysis of the Energy-Intensity Differences between
China and India
Energy-intensity change
As I stated in Chapter 1, the energy-intensity trend in India and China is very different. In 1982, the energy intensity was 3.67 kgce (kilograms of coal equivalent) per constant U.S. dollar (Year 2000) in China and 0.96 in India (EIA, 2003). The former is 3.6 times the latter. Over the time period of 1980-2003, the energy intensity in China has been
dramatically decreased by 67%. In India, however, it increased from 0.96 kgce/U.S. dollar in 1980 to 1.04 in 1984, and since then kept increasing until it reached the highest point at 1.18 in 1995. After 1995, the energy intensity in India began to decrease and returned to below 1.0. The overall drop from 1980 to 2003 is only 5%, a very minor
change compared to China's change of 67% (Figure 2).
Energy intensity is a measurement of the effectiveness of energy use and the consumption patterns of different economies. According to the World Energy
Assessment (WEA), economies with a large share of services in GDP and a large share of electricity in the final energy mix usually have lower final energy intensities than do economies based on materials and smokestack-based industries and fuelled by coal and oil (WEA, 2000). Therefore, to compare the determinants of energy intensity in China and India, I first compare their economic structures and energy consumption patterns.
Energy intensity = Energy consumption per unit Exchange Rate)
Kgce = Kilogram of coal equivalent
Source: Energy Information Administration, 200
of GDP (constant 2000 U.S. dollar using Market
Figure 2 Energy Intensity of China and India, 1980-2003
Economic structure
Although both China and India are industrializing countries and the industry sector
represents a large part of their GDP, the composition of GDP still differs in two countries.
4.00 3.80 - 3.60 M 3.40 uj 3.20 :j 3.00 2.80 2.60 * 2.40 . 2.20 0 2.00 8 1.80 1.60 S 1.40 d 1.20 1.00 S0.80 - 0.60 0.40 0.20 m 0.00 .-4-- India .2.-- China -Year -Year Share of Agriculture in GDP 45.0 40.0 35.0 e 30.0 0 25.0 20.0 8 15.0 n. 10.0 5.0 0.0 ~ 25.0 *China .~ 0. *Ilndia 1980 1990 2001 Year
Share of Industry in GDP
Note: Data are based on GDP at current factor cost.
Source: Asian Development Bank (ADB), Asian Development Outlook 2002.
Figure 3 Composition of GDP in China and India
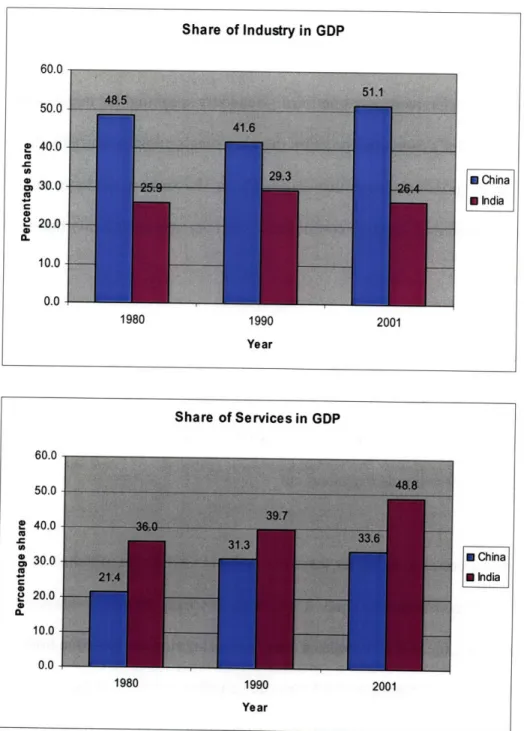
On the other hand, from Figure 3, it is obvious that the industry sector accounts for much more GDP in China than in India - taking 2001 for example, in China, the percentage of
GDP created by industry sector is more than 50%, while that in India is only about 25%.
60.0 50.0 • 40.0 & 30.0 S20.0 10.0 0.0 a China SIndia 1980 1990 2001 Year Share of Services in GDP 60.0 50.0 E 40.0 (A D 30.0 P 20.0 10.0 0.0 '· *China 'U U India 1980 1990 2001 Year
On the other hand, the share of the service and agriculture sectors in GDP in India is larger than those in China: in 2001, almost one-half of India's GDP is created by the service sector, while that in China is only one-third. Generally speaking, the larger share of the service sector in India's economic structure than in China's explains partially the fact that energy intensity in India is lower than that in China. In contrast, the large share of industry in China's economic structure contributes to its high energy intensity during time.
Energy-consumption pattern
Because the composition of the economy structure is different in China and India, the energy consumption of each sector in these two countries is also different. From Figures 4 and Figure 5, there are three trends that stand out.
First, the industry sector consumes a larger share of energy in China than in India. In 1990, the industry sector consumed 56.5% of total energy in China, while in India it was 44%. From 1990 to 2001, the share of industry energy consumption decreased in both China and India. In China, it dropped by 16.5 percentage points, while in India, it
dropped by 17.8 percentage points. Because the industry sector has increased its share of GDP in China from 1990 to 2001, while it has decreased in India (Figure 3), the
reduction of energy consumption share indicates a better improvement of energy efficiency in China than in India.
Second, the transportation sector consumes a larger share of energy in India than in China. The transportation sector consumed 24.1% of total energy in 1990 in India, while in China it was only 7.8%. However, over 1990-2001, the transportation sector decreased its energy consumption share by 12.4 percentage points in India; while in China, it increased but only by 1.8 percentage points. The growing numbers of vehicles, increased urbanization and traffic congestion caused the increase of transportation energy
consumption in China, and such a growth is larger than that in India. According to EIA, China is the key market that will lead the transportation energy consumption growth in the Asian emerging economies (EIA, 2005).
Third, the share of the residential energy consumption in both countries is close in 1990, both being around 20%; however, in 2001, it increased to 38.2% in China, and a much larger increase happened in India, reaching 56.6%. High energy consumption in the residential sector is typical in developing countries; while in developed countries, the residential sector energy consumption always counts for only 15% to 20% of the total (WEA, 2000). The large residential energy consumption in China and India is mainly due to the rapid population growth and urbanization. However, different energy
technologies for cooking, heating, lighting, electrical appliances, and building insulation will have different impacts on the energy consumption in this sector.
Percentage Share = percent of total final energy consumption Source: World Resource Institute, 2005.
Figure 4 Sector Share of Energy Consumption in China
Non Energy Use & Other Residential Commercial &Public Services Agriculture Transportation Industry 0 10 20 30 Percentage Share 40 50 60
Percentage Share = percent of total final energy consumption Source: World Resource Institute, 2005.
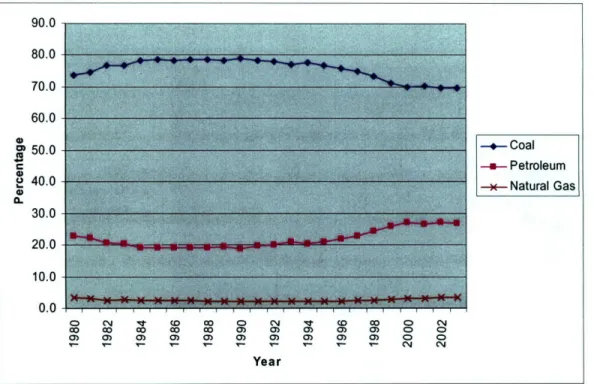
Figure 6 and 7 show the energy consumption by major sources in each country. Figure 8 and 9 show the share of primary energy consumption by major sources in each country. Here the major primary energy sources in both China and India include coal, petroleum and natural gas; nuclear and renewable are not included, given their small share in the total primary energy consumption. Comparing the energy-consumption patterns in the two countries, I find five major characteristics.
(1) For each energy source, China consumes much more than India does. From Figure 6 and 7, in 1980, China consumed 5.6 times as much coal, 9.9 times as much natural gas, and 1.4 times as much petroleum as in India. In 2003, China consumed 4.3 times as much coal, 1.5 times as much natural gas, and 2.2 times as much petroleum as in India.
(2) The consumption of coal and petroleum in India is increasing more rapidly than that in China. From 1980 to 2003, coal consumption in China increased by 140%, while in India it increased by 229%; petroleum consumption increased by 199% in China and by 251% in India. This indicates a more rapid increase of primary energy consumption in India over time. It is possible that India will catch up China in terms of energy
consumption in the near future, given its rapid growth of population and GDP.
(3) Coal is the dominant energy source in both China and India. It satisfied more than 70% of China's primary energy demand and about 60% of India's energy demand in 2003. However, the share of coal consumption in both countries has slightly declined
over time. China and India can both improve their overall energy intensity by improving
the efficient use of coal, given the large share of coal consumption.
(4) Petroleum takes a larger share of energy consumption in India than that in China. It
accounts for about 35% of India's total energy consumption, while in China it accounts
for only about 20%. However, in China the petroleum share of total energy consumption
increased from 21% in 1980 to 24% in 2003, while in India it decreased slightly from
34% to 32% over the same period. This is the consequence of the more rapid growth in
China's transportation sector, which is the major consumer of petroleum.
(5) Natural gas is a minor fuel in the overall energy mix in both China and India, mainly
because of the small reserve of this energy source. Natural gas only accounts for about
3% of energy consumption in China over time. In India, it accounted for less than 3%
Source: Energy Information Administration, 2003.
Figure 6 Primary Energy Consumption by Source in China, 1980-2003
Source: Energy Information Administration, 2003
Figure 7 Primary Energy Consumption by Source in India, 1980-2003
30 25 m S20
0
15 0 10 5 0 *-- Coal SNatural Gas x Petroleum o C14 q D O 0 C '4t C 0 0 0 C.j 0 0 0O CO 00 0) 0) 0) 0) 0) 0o 0co oO cO cO co o• o• o) o'• o• O o
0) 0) 0Y) 0) 0) M 0) 0) 0) 0) 0 o - - V- - CV year 8 7 6 35 m 4
3
as 2 1 0 -- Coal - Natural Gas - Petroleum o C'.4 'q O 0O 0 C14 CO 0 0 CNI Go co 0 O G o 0 0) 0) 0) 0D 0) 0> 0 0 0 0) 0) 0) 0) 0) 0) 0) 0) 0 0 V - T V- V C14 CNI Year90.0
Source: Energy Information Administration, 2003
Figure 8 Share of Primary Energy Consumption by Source in China, 1980-2003
Source: Energy Information Administration, 2003
Figure 9 Share of Primary Energy Consumption by Source in India, 1980-2003
80.0 70.0 60.0 I 50.0 u 40.0 30.0 20.0 10.0 0.0 - Coal -a- Petroleum - Natural Gas 00 CO Co ) o c0 0 0) 0) 0) 0) 0) 0 0) 0) 0) 0) 0) 0) 0) 0) 0) 0) 0 0C Yearr V C14 0
Year
70.0 60.0 50.0 S40.0 30.0 20.0 10.0 0.0 -4- Coal --- Petroleum -- Natural Gas o C04 T (0D CO 0> C4 ' (0 O 0 C14 cO CO cO cO Co 0) 0) 0) M) 0) 0 0 0) 0) 0) 0) 0) 0) 0) 0) 0) 0) 0 0 04 C14 YearSummary
Generally speaking, the energy intensity in China is higher than in India overtime, although we mush take great care in using such data for a comparison because the use of the market exchange value (MER). From the economic structure side, China has a larger
share of output from industry, while India has a larger share of output from services. Such a disparity in economic structure helps to explain the fact that China has a higher energy intensity than India. From the energy-consumption side, China consumes more coal than India, which also contributes to the higher energy intensity in China. However, China reduced its energy intensity more than India. This is largely because China had extremely high energy intensities in the 1980s, and it therefore had a greater potential to reduce its energy intensity compared to India.
However, in the industrial sector, although both China and India reduced the energy consumption share, China increased its GDP share, while India decreased its GDP share. This indicated that China decreased its energy intensity in industrial sector, while India did not, or reduced its energy intensity to a lesser extent than China.
To explore the energy-intensity change in the industrial sector in each country, and then further examine the determinants of energy-intensity change in industrial sector, I conduct a shift-share analysis.
Chapter 4
Shift-Share Analysis of the Energy Intensity in India, 1982-1998
Using the Shift-Share technique, described in Chapter 2, I decompose the components of
energy intensity in India's industrial sector. I obtain the major indicators for energy
consumption and industrial output for this analysis from the India Annual Industrial
Survey, 1982-1998 (see Appendix 1 for the detailed data construction).
Overall results
By dividing the energy consumption by output, I obtain the energy intensity of industrial
sector (Figure 10) and sub-sectors over time. Here, the value of energy consumption and output are both in monetary value of Rs. Lakhs. I deflated the energy consumption value by the Wholesale Price Index (WPI) (Base: 1981 = 100) of fuel, which measures the changes of fuel prices over time. For industrial output, I deflated the value by the Index of Industrial Production (IIP) (Base: 1981= 100), which eliminates price changes.
Therefore, the value of energy intensity has no unit. It indicates the proportion of energy consumption and output. For example, the energy intensity of the food industry in the year 1982-1983 is 0.026, which means to produce one Rs. output of food product, this industry needs to spend 0.026 Rs. on energy. This calculation is different from the
method using physical value of energy consumption. However, due to the data limitation, I could not find physical energy consumption for each sub-sector in India. Besides, by using the WPI of fuel, I can use the value of energy consumption to approximate the real
intensity is also a reasonable and useful way to measure how much energy is needed in order to produce one unit of output.
Meanwhile, I use energy consumption per unit of output, instead of GDP to measure the energy intensity of the industrial sector. Although there are arguments against using gross output value because of its double-counting, in the sense that it counts both inputs and outputs. I am comparing energy intensity across time and countries, using the same criteria; therefore, the double-counting should not be a major issue. Besides, in most of the industry data, the value of output is given rather than the value of GDP. Furthermore, I intend to show the general pattern rather than an exact estimate of components of the intensity changes.
Note: 1) Energy intensity =energy consumption (Rs)/ value of industrial output (Rs) 2) Period of fiscal year in India is April to March, e.g. year shown as
1982-83 relates to April 1982 through March 1983.
Source: India Annual Survey of Industries, 1982-1983 to 1997-1998
As shown in Figure 10, the energy intensity of the industrial sector in India during 1982-1997 declined slightly with some fluctuations (for convenience, throughout, I refer to the fiscal year only by the first year; for example, 1982 for FY 1982-1983). It increased from 0.083 in 1982 to 0.098 in 1987, and since then, it dropped to 0.083 but increased again between 1987 and 1990. After 1990, the energy intensity kept decreasing from 0.088 to
0.059 in 1997.
The Shift-share analysis decomposes the change of energy intensity during time into two impacts: structural change and efficiency change.
Table 1 shows the actual energy consumption in India's industrial sector for each year between 1982 and 1997 and its constant share, industrial-mix, and efficiency-shift
components. The constant-share component indicates the amount of energy the industrial sector would consume in a given year if its energy intensity in that year were the same as that in 1982. The difference between the actual energy use and constant share, therefore, measures the amount of energy saved using the 1982 energy intensity as a benchmark. For example, in 1983, the constant share was 719,758 Lakhs Rs., but the actual use was 708,086 Lakhs. Rs. The difference, 11,673 Lakhs. Rs., was the energy consumption
saved in 1983. Summing the energy savings of different years, India saved 2,133,722 Lakhs. Rs of energy between 1982 and 1997.
Table 1 Shift-Share Analysis of Energy Consumption in India's Industrial Sector, 1982-1997
( Rs. Lakhs)
Actual Use Constant Share Industrial Mix Efficiency Shift Difference
Year (1) (2) (3) (4) [(1)-(2)] (5) 1982 743,631 743,631 0 0 0 1983 708,086 719,758 22,221 -33,894 -11,673 1984 786,797 746,037 437,478 -396,718 40,759 1985 871,983 780,445 413,285 -321,747 91,537 1986 876,029 794,618 358,364 -276,953 81,411 1987 1,010,298 852,640 302,242 -144,584 157,658 1988 946,941 947,118 317,808 -317,985 -177 1989 1,146,916 1,081,705 571,867 -506,656 65,210 1990 1,238,210 1,164,553 537,135 -463,477 73,658 1991 1,230,309 1,293,792 796,582 -860,065 -63,482 1992 1,413,290 1,563,921 1,035,400 -1,186,032 -150,632 1993 1,322,986 1,702,578 1,294,013 -1,673,605 -379,591 1994 1,447,905 1,897,555 1,387,851 -1,837,501 -449,650 1995 1,703,404 2,153,943 1,653,206 -2,103,745 -450,539 1996 1,749,211 2,220,196 1,954,315 -2,425,300 -470,985 1997 1,649,065 2,316,292 2,262,905 -2,930,132 -667,228 Total 18,845,060 20,978,782 1,334,467,102 -1,547,839,306 -2,133,722
Note: 1 Lakh=100,000, 1 Lakh Rs=2241 USD
Source: Calculated from data in Annual Industrial Survey, 1982-1998. www.indiastat.com
It is obvious that the efficiency shift of each year is negative and it has kept decreasing over time, which indicates that efficiency improvement drives the energy consumption to decrease. However, the industrial mix factor is always positive and it kept increasing, indicating that the industrial mix causes the increase of energy consumption. Therefore, all the energy saving should be attributed to the improvement in energy efficiency.
In Table 2, I present the results of the Shift-Share analysis on energy intensity in India's industry sector. Because I use 1982 as the reference year, the constant share component for all years was equal to the 1982 intensity. The industrial mix component indicated the
degree to which an industrial sector specializes in energy-intensive sub-sectors. The
larger (smaller) the industrial mix, the higher (lower) the share of energy-intensive
industrial sub-sectors. The efficiency-shift component tells us the relative level of energy
efficiency in a given year. A smaller number indicates a higher efficiency. It is not
surprising to see that for each year, the industrial-mix number was positive and increasing,
meaning that the share of energy-intensive industries in the industrial sector has increased
over time. In contrast, the efficiency shift was negative and kept decreasing, which
means that the industrial sector used energy more efficiently. The industrial mix and
energy-efficiency shift components are at work simultaneously, but in different directions.
The negative impact of industrial mix offset the positive impact of efficiency shift, therefore causing the general energy intensity to change only slightly since 1982.
Table 2 Shift-Share Analysis of Energy Intensity in India's Industrial Sector, 1982-1997
Industrial Efficiency
Year Energy Intensity Constant Share Shift
Mix Shift 1982 0.083 0.083 0 0 1983 0.082 0.083 0.003 -0.004 1984 0.088 0.083 0.049 -0.044 1985 0.093 0.083 0.044 -0.034 1986 0.092 0.083 0.037 -0.029 1987 0.098 0.083 0.029 -0.014 1988 0.083 0.083 0.028 -0.028 1989 0.088 0.083 0.044 -0.039 1990 0.088 0.083 0.038 -0.033 1991 0.079 0.083 0.051 -0.055 1992 0.075 0.083 0.055 -0.063 1993 0.065 0.083 0.063 -0.082 1994 0.063 0.083 0.061 -0.080 1995 0.066 0.083 0.064 -0.081 1996 0.065 0.083 0.073 -0.091 1997 0.059 0.083 0.081 -0.105
Note: Energy Intensity =Value of energy consumed to produce 1 constant 1981 Rs. Output. Source: Calculated from data in Annual Industrial Survey, 1982-1998.
www.indiastat.com
Table 3 presents the changes in the energy intensity in India's industrial sector, their
structural-change and efficiency-shift components. Both components change very little, and in most of the years, they offset each other. When the factors driving energy
intensity down were greater than the factors driving energy intensity up, the energy intensity declined. For example, from 1982 to 1983, the efficiency shift decreased 0.004, while the industrial mix drove the energy intensity up by 0.003; therefore, the overall energy intensity decreased 0.001. From 1986 to 1987, the industrial mix changes made overall energy intensity decrease 0.008, but the efficiency shift increased 0.015, thus the overall energy intensity increase 0.007. Only when the two components both decreased did the overall energy intensity show large changes. However, such a situation only
occurred during 1987-1988, when both components decreased, and overall energy intensity decreased by 0.015, which is the largest decline over the study period.
Generally, during 1982-1997, both industrial mix and efficiency shift played important role in determining energy intensity in India's industrial sector.
Table 3 Changes in Energy Intensity in India's Industrial Sector, 1982-1997
Total Energy Industrial Mix Efficiency shift Intensity change Change %of Total Change % of Total
[(2)/(1)] [(4)/(1)] Year (1) (2) (3) (4) (5) 82-83 -0.001 0.003 -190.371 -0.004 290 83-84 0.006 0.046 784.071 -0.040 -684 84-85 0.005 -0.005 -90.739 0.010 190 85-86 -0.001 -0.007 529.556 0.005 -429 86-87 0.007 -0.008 -117.051 0.015 217 87-88 -0.015 -0.002 10.225 -0.014 89 88-89 0.005 0.016 319.354 -0.011 -219 89-90 0.000 -0.006 -2274.376 0.006 2374 90-91 -0.009 0.013 -137.521 -0.022 237 91-92 -0.004 0.004 -98.111 -0.008 198 92-93 -0.011 0.008 -77.371 -0.019 177 93-94 -0.001 -0.002 204.419 0.001 -104 94-95 0.002 0.003 130.018 -0.001 -30 95-96 0.000 0.009 -3799.215 -0.010 3899 96-97 -0.006 0.008 -127.377 -0.014 227
Source: Table 2. Each cell except constant share in Table 2 for each year was subtracted from the corresponding number for the previous year.
The effects of structural change
Energy intensity in an industrial sector depends in part on the mix or composition of industries within the sector. The energy intensity will be high if most industries in the sector are energy intensive. An increasing share of energy-intensive industries will increase the energy intensity of the industrial sector, and vice versa (Lin, 1992).
Energy intensity of different industrial sub-sectors varies significantly. As shown in Figure 11, the highest energy intensity in 1982 was 0.25 in electricity sector; while the lowest was 0.02 in machinery and equipment sector, which is over 20 times less than that of electricity sector. The change of each sub-sector also differed significantly. The energy intensity of electricity sector fluctuated a lot during time, and overall it decreased 0.13 from 1982 to 1997. In contrast, the energy intensity of non-metallic mineral
products increased from 0.189 in 1982 to 0.199 in 1997, peaked at 0.284 in 1988. Another noticeable change is the chemical and chemical products sector: before
1988-1989, its energy intensity stayed around 0.1, then dropped a lot in 1989 to 0.032, and then kept around 0.030. Compared to the energy intensity of industry as a whole, there are four sub-sectors having higher energy intensity than the industry energy intensity: electricity, non-metallic mineral products, basic metal and alloys industries, and paper, printing, publishing and allied industries. The energy intensity of chemicals and
chemical products was higher than the overall industrial energy intensity before 1988; the energy intensity of rubber, plastic, petroleum and coal products was higher than the overall industrial energy intensity after 1989.
Figure 11 also explains why the industrial mix plays an important role in determining energy intensity in India's industrial sector. Using shift-share analysis, I calculate the industrial-mix impact by taking the difference between sub-sectoral energy intensity and overall energy intensity of industry:
0.350 0.300 0.250 c 0.200
0.150
0.100 0.050 0.000 0.000 (N4 co Nt U') (0 rI_ O 0) 0 I T-, 04 I n 1 -*- 30 00 (O WO co W0 (0 M0 (0 0 0M 0) 0) 0) 0) 0) 0) 0) 0) 0) 0) 0) 0M 0M 0) 0) 0) T_ Ir V T V V V1 V_ Ir- _ M1 T_ TNote: Energy intensity = energy consumption / value of industrial output Industrial classification used in Figure 11:
40 Electricity
32 Non-metallic mineral products 33 Basic metal and alloys industries
28 Paper, printing, publishing and allied industries 31 Chemicals and chemical products
23-26 Textiles
27 Wood and wood products
34 Metal products, except machinery and equipment 37 Transport equipment and parts
20-21 Food products
22 Beverages, tobacco and related products 38 Other manufacturing industries
30 Rubber, plastic, petroleum and coal products 29 Leather and products of leather
35-36 Machinery and equipment
Source: India Annual Survey ofIndustries, 1982-1997
Figure 11 Energy Intensity of Industrial Sub-Sectors in India, 1982-1997
Figure 11 shows that the difference between the energy-intensive sub-sectors and overall energy intensity is larger than that between less energy-intensive subs-sectors and overall
Co rc. 0) 0 Yaar -- 40 --- 32 33 ---- 28 -- 31 e-Total -+-- 23-26 - 27 -34 37 20-21 22 --- 38 ---30 -- 29 ... 35-36 Yaar
energy intensity. This makes the sum of the industrial-mix impact to be positive, which offsets the impact of energy-efficiency shift.
Therefore, the industrial structure has impacts on energy intensity. Figure 12 shows the structural composition of sub-sectors in India's industry.
10.UU 16.00 • 14.00 12.00 0 S10.00 c 8.00 o . 6.00 , 4.00 2.00 0.00 - 40 - 32 33 - 28 --- 31 - 23-26 --+--27 -34 --- 37 20-21 . 22 38 ---- 30 --- 29 --- 35-36 Year 0) 0 1 L0 0 0) 0 0 0 0- 0P InCD r_ 0) 0) 0) 0) 0) 0) T_ V_ V_
Industrial classification: Same as Figure 11
Source: India Annual Survey of Industries, 1982-1983
Figure 12 Composition of Industrial
to 2002-2003
Output in India, 1982-1997
In Figure 12, among the six most energy-intensive sectors, there are four sectors
belonging to the large-share group (share of composition of industrial output above 8%): electricity, paper, basic metal and alloys industries, chemicals and textiles. This indicates that the structure of India's industrial sector is fairly energy-intensive. The electricity sector increased from 7% in 1982 to 10% in 1997; the basic metal and alloys industries fluctuated slightly during 1982 to 1997, overall it dropped froml2% to 11%; the chemical
In nn
-- --
and chemical products sector was above 12% before 1998, then decreased and reached 8% since 1991; and the textile sector always stayed around 11%. Totally, these four sectors comprise 43% of total industrial output in 1982, then increased and kept the level at 45% till 1986, after which their share began to drop and in 1997 it was 40%. The overall change from 1982 to 1997 is below 3 percentage points. This indicates that India's industrial mix made very small improvements in terms of shifting from energy-intensive sub-sectors to energy-efficient sub-sectors, which hampered the decline of overall energy intensity.
Another noticeable finding is that the food and machinery and equipment sectors
composed a large share of total industrial output, but they are not energy-intensive. The increase of such sectors in the share of total output would contribute to the decrease of energy intensity. However, the machinery and equipment sector decreased about 6% during this period, and the food sector only increased very slightly.
Generally speaking, the composition of industrial output in India is a complex mix of both energy-intensive sub-sectors and less energy-intensive sub-sectors. The share of
energy-intensive sectors is always larger than that of less-energy-intensive sectors. Such a composition indicates that India's industrial sector is fairly energy intensive. The change of industrial structure did not contribute to the decrease in energy intensity, because the share of energy-intensive sectors increased over time, while the other
which shows that the industrial structure played a negative role in determining the energy intensity in India's industry sector.
The effects of efficiency change
Efficiency change is another factor determining the energy intensity. The energy intensity will decrease if the efficiency is improved. The improvement in energy efficiency can be achieved by a variety of means, such as improving operation and
management of existing plants, replacing and upgrading energy-intensive equipment, and using less energy-intensive technologies and production processes (Lin, 1992). In the shift-share analysis, the changes in energy efficiency are revealed by the changes in energy intensity at the individual industry level over time:
Efficiency change= -[(ei,t -ei,82)*Oi,t] / Ot
If the energy intensity of industry i is decreased, which means it uses energy more
efficiently, the difference between it and its energy intensity in the base year would be negative, then the total energy intensity of industry would be decreased by such impact.
Looking at Figure 11 again, almost all of the five most energy-intensive sectors
encountered intensity change overtime compared to the base year. The most remarkable one is the electricity sector: its energy intensity fluctuated over the study period and overall decreased from 0.25 in 1982 to 0.12 in 1997.
Comparing the trends of electricity energy intensity and industrial energy intensity, they moved fairly much in unison: increasing during 1983 and 1987, decreasing from 1987 to
1988, increasing from 1988 to 1990, and then decreasing since 1990. This indicates that the electricity sector might have a larger impact on overall industrial energy intensity than other sub-sectors because of its large industrial output share and high energy
intensity.
The energy intensity of non-metallic mineral products sector also changed over time: it increased from 0.19 in 1982 to 0.28 in 1988, since then it dropped to 0.20 in 1997.
Overall, the energy intensity increased slightly from 1982 to 1997. This indicates that the energy efficiency did not improve much in the non-metallic mineral products sector and it might have a negative impact on the industrial energy intensity.
The chemicals and chemical products sector decreased its energy intensity remarkably in the year 1989 and since then kept a low level of energy intensity. The overall change of
energy intensity is from 0.09 in 1982 to 0.03 in 1998, a decrease of 56%. Such an
improvement of energy efficiency would have a positive impact to decrease the industrial energy intensity.
Overall, the absolute value of India's industrial energy intensity decreased. It is obvious that the energy efficiency of each sub-sector in India improved during 1982-1997, and each contributed to the decline in the industrial energy intensity.
Summary
In this chapter, I examined the energy intensity in India's industrial sector. From 1982 to 1997, the energy intensity of India's industrial sector decreased by 29% from 0.08 to 0.06. The change of energy intensity was determined by two factors: structural shift and
efficiency improvement. The energy efficiency of each sub-sector generally improved hence drove the energy intensity of industry to decrease; however, such a positive impact was offset by the industrial structure. The industrial structure became more energy-intensive because of the increasing share of energy-energy-intensive sub-sectors.
There are several major industrial sub-sectors playing key roles in the determination of India's industrial energy intensity.
(1) Electricity
The electricity sector is fairly energy intensive and it comprises about 10% of the total industrial output. On one hand, the increasing share of electricity in the total industrial output caused the industrial energy intensity to increase; on the other hand, the energy efficiency of electricity improves over time, which caused the industrial energy intensity to decrease over time. The electricity sector provides energy to almost every industrial sector, and the generation of electricity has to be expanded to meet the demand (EIA, 2005). Therefore, the key means of reducing energy intensity through the electricity sector is to improve its energy efficiency. The energy intensity of electricity is very unstable in India in past years, indicating the possible immature use of energy technology by the sector.
(2) Non-metallic mineral products
This sector only takes a share of 3% in total industrial output but consumes above 10% of the total energy consumption. Its energy intensity is the highest of all sectors in most of the years during 1982-1998. Therefore, it is very important to improve the energy
efficiency in this sector in order to reduce the energy intensity in India.
(3) Basic metal and alloys
This sector shares a larger output than electricity, but it consumes less energy than the
electricity sector. Therefore, its energy intensity is much lower than that of the electricity
sector. However, the energy efficiency of this sector did not change overtime, and there
should be a potential space for this sector to improve its energy efficiency.
(4) Chemicals and chemical products
The energy intensity of this sector declined from 0.09 in 1982 to 0.03 in 1989, and
remained at a low level since then. However, its share of output also decreased since
1989, remaining below 10%. Keeping the low energy intensity level of this sector and
increasing its share in industrial output could be a way to decrease the industrial energy
(5) Textile industry
The textile sector produced about 11% of total industrial output in India, and its energy intensity is less than the overall industrial energy intensity over time. This pattern is beneficial to the industrial energy intensity and should be kept or further improved.
(6) Food industry
The food industry has the lowest energy intensity among those sectors having a large share of output. Its energy intensity was fairly stable around 0.03 during the past 20 years. On the other hand, its output decreased during 1983-1988, and then increased, and it was the highest-output sector from 1989 to 1995.
The other sub-sectors with both stable low energy intensity and a low share of output are leather and products of leather, other manufacturing industries, beverages, tobacco and related products. By increasing the output of these sectors, India could have a positive impact on overall energy intensity. However, whether to increase their output will also depend on many other factors, such as profitability and resource availability.