HAL Id: hal-03022991
https://hal.archives-ouvertes.fr/hal-03022991
Submitted on 25 Nov 2020HAL is a multi-disciplinary open access
archive for the deposit and dissemination of sci-entific research documents, whether they are pub-lished or not. The documents may come from teaching and research institutions in France or abroad, or from public or private research centers.
L’archive ouverte pluridisciplinaire HAL, est destinée au dépôt et à la diffusion de documents scientifiques de niveau recherche, publiés ou non, émanant des établissements d’enseignement et de recherche français ou étrangers, des laboratoires publics ou privés.
Study of Self-Diffraction from Laser Generated Plasma
Gratings in the Nanosecond Regime
S Schrauth, A Colaïtis, R Luthi, R Plummer, W Hollingsworth, C Carr, M
Norton, R Wallace, A Hamza, B Macgowan, et al.
To cite this version:
S Schrauth, A Colaïtis, R Luthi, R Plummer, W Hollingsworth, et al.. Study of Self-Diffraction from Laser Generated Plasma Gratings in the Nanosecond Regime. Physics of Plasmas, American Institute of Physics, 2019, �10.1063/1.5087734�. �hal-03022991�
LLNL-JRNL-763069
Study of Self-Diffraction from Laser
Generated Plasma Gratings in the
Nanosecond Regime
S. E. Schrauth, A. Colaitis, R. L. Luthi, R. C. Plummer,
W. G. Hollingsworth, C. W. Carr, M. A. Norton, R. J.
Wallace, A. V. Hamza, B. J. MacGowan, M. J. Shaw, M.
L. Spaeth, K. R. Manes, P. Michel, J. M. Di Nicola
November 28, 2018
Disclaimer
This document was prepared as an account of work sponsored by an agency of the United States government. Neither the United States government nor Lawrence Livermore National Security, LLC, nor any of their employees makes any warranty, expressed or implied, or assumes any legal liability or responsibility for the accuracy, completeness, or usefulness of any information, apparatus, product, or process disclosed, or represents that its use would not infringe privately owned rights. Reference herein to any specific commercial product, process, or service by trade name, trademark, manufacturer, or otherwise does not necessarily constitute or imply its endorsement, recommendation, or favoring by the United States government or Lawrence Livermore National Security, LLC. The views and opinions of authors expressed herein do not necessarily state or reflect those of the United States government or Lawrence Livermore National Security, LLC, and shall not be used for advertising or product
Study of Self-Diffraction from Laser Generated Plasma Gratings in the Nanosecond Regime
S. E. Schrauth,1 A. Colaitis,1, a) R. L. Luthi,1 R. C. W. Plummer,1 W. G. Hollingsworth,1 C. W. Carr,1 M. A. Norton,1 R. J. Wallace,1 A. V. Hamza,1 B. J. MacGowan,1 M. J.
Shaw,1 M. L. Spaeth,1 K. R. Manes,1 P.Michel,1 and J. -M. Di Nicola1 Lawrence Livermore National Laboratory, 7000 East Avenue, Livermore, California 94550, USA
(Dated: 17 December 2018)
We investigate the formation and diffraction efficiency of plasma gratings generated by the interference of two laser beams crossing at a small angle on the surface of a planar aluminum target. Such gratings were observed during National Ignition Facility experiments with the ratio of energy in the first-order to zeroth order of ≈ 60%. Recently, additional experiments were performed on the Optical Sciences Laser. These experiments, with only two interfering beams showed high normalized energy (ratio of energy in diffracted order to zeroth order), of approximately 10% and 3%, at the first and second diffracted order locations, respectively, for intensities less than 1012 W/cm2. The existence of the higher-orders are characteristic of diffraction
from gratings in the Raman-Nath as opposed to the Bragg regime. In addition, we show conical diffraction from the generated plasma grating. Using numerical simu-lations, we explore the large difference in diffraction efficiency observed in these two experiments, and highlight the role of plasma temperature and density scalelength. The simulations suggest a modulation depth of the plasma grating refractive index ranging from 1.77× 10⁻⁴ to 3.5
× 10−2. These results are relevant to Inertial
Confine-ment Fusion experiConfine-ments or plasma photonics applications of gratings in high-field laser-physics and high-energy density science, specifically in the nanosecond regime.
I. INTRODUCTION
The interaction of electromagnetic waves with other physical waves has long been of interest in the optical sciences, with many studies of light scattering from acoustic waves1–5
and plasmas6–10. A large effort has been devoted to studying light interacting with plasmas.
One of the first numerical simulations on plasma gratings relating to Inertial Confinement Fusion7 was performed for two crossed collimated beams at 0.35 µm with intensities in the
range of 1015-1016 W/cm2. More numerical and theoretical work on plasma gratings was
done for the higher intensity range of 1017-1018W/cm2 for beams at 0.80 µm8. Experiments
on plasma generation at solid surfaces were carried out for the 1016-1018 W/cm2 intensity
regime. This work was performed with ultrashort, 100 fs laser pulses and was primarily interested in the backscattering of laser light9. Other experiments explored the intensity
range below 1016 W/cm2 using ultrashort pulses and probing the plasma with a separate
beam10. The majority of the previous work looked at plasma gratings with ultrashort pulses,
high intensities, or short time scales for plasma evolution. Our present work is focused on ns-scale pulses with intensities of 1012 W/cm2 or lower at 1.053 µm. In addition we also clearly
observe and identify, we believe for the first time in the nanosecond regime, out-of-plane diffraction11 from a plasma grating.
One major field where plasma gratings have been of interest has been in the area of high-energy density physics, specifically indirect drive Inertial Confinement Fusion (ICF). Specifically of interest is the interaction of the picket, the earliest part of a shaped ignition pulse, and the wall of the hohlraum12. The main interest is whether the overlap of multiple
beams at the at the wall result in early time imprint on the target capsule. In addition to the interest related to indirect drive ICF experiments, the study of laser-plasma interactions has resulted in the growing field of plasma photonics. This field involves the generation of a plasma with specific properties depending on the optical element it is designed to mimic. If the properties are correct, a laser beam interacting with the plasma will behave as if interacting with the desired optical element. One of the simplest plasma photonic elements is a plasma mirror. Plasma mirrors have been used in high-field experiments to improve the temporal contrast of ultrashort and ultra-intense laser pulses13 or as a source
for vacuum laser acceleration of relativistic electrons14. Using a plasma grating more like
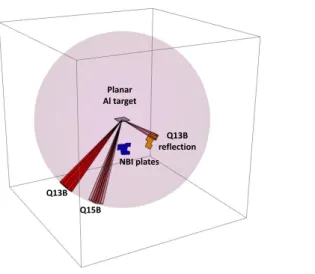
Planar Al target Q13B Q15B NBI plates Q13B reflection
FIG. 1. The experimental setup of the NIF target chamber for the bare aluminum reflectivity measurement.The 8 beams from Q13B and Q15B interact on the planar aluminum target and the reflection of the beams from Q13B are measured on the NBI plate.
for experimental regimes where use of standard diffraction gratings is impossible due to concerns such as damage15or for the generation and diffraction of high-harmonics16. Plasma
gratings have also been used for quasi-phase matching in degenerate four-wave mixing17.
Recently the plasma analogs for optical devices have grown, including other elements, such as near-diffraction limited lenses18and polarization controlling optics such as waveplates and
polarizers19,20. Understanding the parameters that determine the laser-plasma interaction
is very important to the field of plasma photonics.
This paper is organized as follows: In section II we discuss the National Ignition Facility (NIF) experiment that showed evidence of plasma gratings. In section III we discuss the Optical Sciences Laser (OSL) experiment, which was an effort to recreate the grating seen in the NIF experiment. In section IV we discuss the results and compare with theoretical predictions from plasma simulations and the differences between the NIF experiment and the OSL experiment.
II. NIF EXPERIMENT
The initial set of measurements was completed in the National Ignition Facility (NIF)21,22
the UV-converted light is directed into the laser entrance hole for ignition experiments, the unconverted infrared and green light can hit support structures of the target. The goal of the shield is to limit the intensity of specular reflections back into other laser beamlines by reflecting and scattering the unconverted light into high angles. Light propagating backwards down a beamline could damage the front-end after being amplified by the residual gain still available in the main laser amplifiers.
The experimental setup of the NIF target chamber is shown in Fig. 1. The NIF ex-periment utilized 2 quads at 1.053 µm: Q13B and Q15B, incident at angles of 50 and 23.5 degrees on the target, respectively. Both quads served to heat the target and are diffracted on the generated plasma gratings. Given the smaller incidence angle of Q15B, the latter was only considered as a heater beam. Given the interaction geometry, the diffraction pattern of Q13B was imaged on the Near Backscatter Imaging (NBI) plate, shown in yellow in Fig. 1. Each quad of four beams had two beams with one linear polarization and two beams with the orthogonal polarization. At target chamber center the beams within a quad had a crossing angle of about 4◦.
The NIF experiment23 had three shots on planar aluminum targets of interest for this
paper, as well as other shots on dimpled shields not discussed here. The results of the first two shots of interest are summarized in Fig. 2. The first two shots used all four beams in the quads. This is represented in Fig. 3(a). The polarizations are described by the black arrows. The first shot, a control, had very low intensity at the target, less than 108 W/cm2.
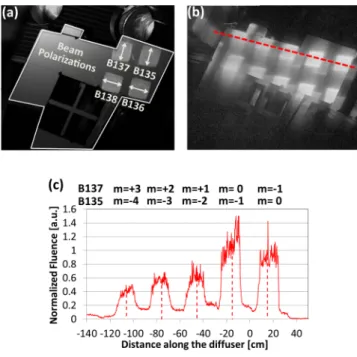
An image of the NBI plate for this low intensity shot is shown in Fig. 2(a). The only beams visible on the plate were the specular reflections of Q13B from the planar target, that is, the target is acting as a simple mirror. For the higher intensity test shots, the laser intensity at the target was consistent with the residual light from multiple beams overlapping on the shield for a typical ICF target shot, approximately 1.5×10¹² W/cm2. The image of the NBI
plate for the first test shot is shown in log-scale in Fig. 2(b) and the difference between the low and the higher intensity shots is striking. The diffracted orders on the NBI plate for the test shot are obvious. The lineout shown in Fig. 2(c) is the fluence normalized to that at the zeroth order location. The lineout corresponds to the location of the dashed red line in Fig. 2(b). The normalized fluence at the first order location for B137 is 60% of the zeroth order energy. Note that due to the process of formation for the plasma grating the diffracted orders of the beams were at the same locations. This can be seen in Fig. 2(c).
FIG. 2. Results of NIF experiment with planar aluminum target. (a) Image of the NBI plate showing the specular reflection from the planar target onto for an intensity less than 108 W/cm2. Also included are the beam labels and the polarization for each beam. (b) Image of the NBI plate, log scale, showing the diffracted orders for a 1 ns square pulse with 1.45 kJ/beam. This corresponds to a total intensity on target of 1.5x10¹²W/cm2 at 1.053 µm. (c) Lineout along red dashed line in (c), showing the normalized fluence of the diffracted orders. The dashed red lines are the expected location of the diffracted orders. The fluence is normalized to that of the zeroth order. Note that due to a reflection in the diagnostic, the faint double image is visible at the right boundary of the spectralon plate but does not change the interpretation and the results
Also note that not all of the laser energy that was incident on the target was diffracted. For an aluminum target at 45◦ and a single beam intensity of 2.0
×1012 W/cm2, simulations
show the integrated reflectively for a 1 ns pulse is 20%. Another interesting result from this experiment was the diffraction into higher orders, which mean the plasma diffraction grating was in the Raman-Nath regime and not the Bragg regime. The third shot was setup as shown in Fig. 3(b). Two beams in each quad were turned off such that there were two beams with orthogonal polarization states. This was done so that the two beams within the same quad would not interfere. Since two beams in each quad were turned off, the energy per beam was doubled to keep the average intensity on target the same as the first two shots.
FIG. 3. Beams and polarizations (denoted by black arrow) used in each quad for (a) The first two NIF shots, with all beams in the two quads turned on. The first shot was low intensity, so no diffraction was seen. The second shot was higher intensity and diffraction orders were observed. (b) The third NIF shot where no diffraction orders were seen, even with the same average intensity.
For this shot, only the specular reflection was visible, no grating structure was observed due to the orthogonal polarization states.
III. OSL EXPERIMENT
Based on the results seen for the NIF experiment, there was interest in performing similar experiments for investigating the possible appearance of diffraction from a plasma grating in a smaller scale, more flexible facility. To perform the experiment we used the Optical Sciences Laser (OSL)24 facility at Lawrence Livermore National Lab. The OSL has wide
tunability in pulse-length, pulse energy, and wavelength. For our experiment we operated the laser with 1 ns square pulses, an energy of 1-8 J, 1/e spot-size of 250 µm for the in-plane experiment, and a wavelength of 1.053 µm, polarized in the horizontal plane. This allowed for intensities at the target in the range of 1011 W/cm2 to 1012 W/cm2.
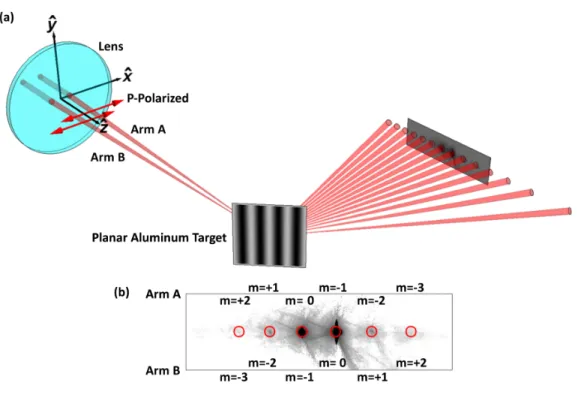
The experimental setup had several sections, beginning with one for beam-splitting and separation. A delay arm with a standard trombone was used to ensure that the two recom-bined arms overlapped in time at the target plane. Following beam-splitting and separation, two alternate paths for beam propagation to the target plane were available as shown in Figs. 4 and 5. The two different paths provided an in-plane diffraction option (Fig. 4) and
FIG. 4. The in-plane experimental setup at the OSL facility. (a) The experimental setup after the beams are separated and the time delay is adjusted to zero. The two input arms are separated in the horizontal (X-Z) plane. The two beams are polarized along X, which is P-polarized with respect to the target. The beams intersect on the planar aluminum target creating the plasma and the interference pattern. The light diffracts off the plasma grating and is measured on a Spectralon plate. (b) An example of a Spectralon image, in log-scale, for an actual shot. The expected locations of the diffracted orders are the red circles. These locations were calculated from direct measurement of the interference pattern at the target plane when firing only the low intensity OSL regenerative amplifier. Note that the diffracted orders all exist in the X-Z plane.
an out-of-plane diffraction option (Fig. 5). The two separated were focused by a large 20 cm diameter lens with a focal length of 1.20 m. The two laser beam paths were not centered on the lens, they were offset from its center by a distance chosen to provide a crossing angle of≈ 3-4◦, which is roughly the crossing angle of two beams in the same quad in NIF. When
the beams overlapped on the target with the same polarization, a simple sinusoidal inter-ference pattern was generated. The period of this interinter-ference pattern depends only on the wavelength of the light and the crossing angle of the beams. As shown in Fig. 6, with the known laser wavelength, a Fourier analysis of the interference pattern was used to precisely determine the beam-crossing angle. Fig. 6(a) is the beam profile in the target plane showing
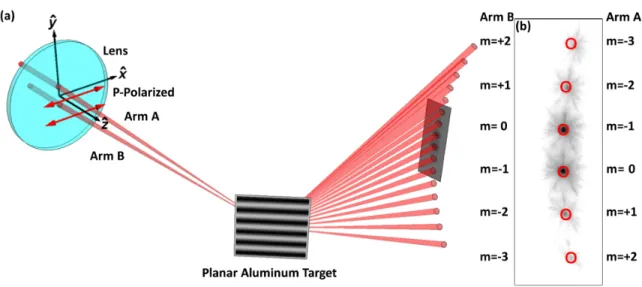
FIG. 5. The out-of-plane experimental setup at the OSL facility. (a) The experimental setup after the beams are separated and the time delay is adjusted to zero. The two input arms are separated in the vertical (Y-Z) plane. The two beams are polarized in the horizontal plane, which corresponds to P-polarized with respect to the target. The beams intersect on the planar aluminum target creating the plasma and the interference pattern. The light diffracts off the plasma grating and is measured on a Spectralon plate. (b) An example of a Spectralon image, in log-scale, for an actual shot. The expected locations of the diffracted orders are the red circles. These locations were calculated from direct measurement of the interference pattern at the target plane when firing only the low intensity OSL regenerative amplifier. Note that the orders are no longer in a straight line. This is conical diffraction.
the interference between two beams. The inset is a close up with better fringe visibility. The Fourier transform along the white line in Fig. 6(a) is shown in Fig. 6(b). The sidebands shown correspond to a fringe spacing of 18.7 µm and a beam crossing angle of 3.2◦. For the
case where the two beams had the orthogonal polarizations, we see no interference pattern. The two different setup options created similar plasma gratings; the differences between them comes in how the two beams were oriented with respect to the generated plasma grating. The system of coordinates we used was set up with the grating vector parallel to the x-direction, the grating normal parallel to the z-direction and the y-direction orthogonal to both x and z. With this coordinate system, the plane defined by the grating vector and the grating normal is the X-Z plane. The in-plane diffraction case, Fig. 7(a), has the input k-vectors (red) in the X-Z plane (translucent blue). For this case, the k-vectors of the
FIG. 6. Determination of the fringe-spacing of the plasma grating for the out-of-plane experiment. (a) Target plane profile of the two overlapping beams from the OSL regenerative amplifier, directly measured by a CCD camera inside the chamber. The magnified inset gives better visibility of the fringes. (b) The Fourier transform along the white line in panel (a). The sidebands correspond to a fringe spacing of 18.7 microns.
diffracted orders (dark blue) are described by the equations,
kx,m = kx,i+ mK (1) ky,m = ky,i= 0 (2) kz,m = q k2− k2 x,m (3)
where kx,i, ky,i, and kz,i are the x, y, and z components of the input k-vector, kx,m, ky,m,
and kz,m are the x, y, and z components of the k-vector for the diffracted order m, K is the
grating vector, and k is the magnitude of the k-vector. The input beams have ky,i = 0 so
the diffracted orders must have the same value, 0, for ky,m. This means that the k-vectors
FIG. 7. Difference between in-plane diffraction and out-of-plane diffraction. For in-plane diffrac-tion, (a) the two input beams are in red and are in the plane defined by the grating normal (Z-axis) and the grating vector (X-axis). The diffracted orders in blue are all in the same plane. For out-of-plane diffraction, (b) the two input beams are in red and are not in the plane defined by the grating normal (Z-axis) and the grating vector (X-axis). The diffracted orders in blue are also not in this plane. They exist on the surface of a cone, hence the name conical diffraction. The arc connecting the ends of the diffracted orders is shown in green.
The out-of-plane diffraction case, Fig. 7(b), had the input k-vectors (red) not in the X-Z plane (translucent blue). For this case, the k-vectors of the diffracted orders (dark blue) are described by the equations,
kx,m = kx,i+ mK (4) ky,m = ky,i6= 0 (5) kz,m = q k2− k2 x,m− ky,m2 (6)
with the same definitions as equations 1 - 3. This results in the diffracted orders existing on the surface of a cone as is visible in Fig. 7(b). This is called conical diffraction or out-of-plane diffraction, because the input and diffracted orders are not in the X-Z plane and the diffracted orders exist on the surface of a cone. The green line connecting the diffracted orders is the arc along the circumference of the base of the cone.
The target consisted of a 2 µm of aluminum on a 5 mm x 5 mm x 250 µm substrate of silicon. The target was held in a small vacuum chamber with entrance and exit windows at 90◦ to each other, in the horizontal plane. The silicon substrate was at 45◦ about the
FIG. 8. Images of the spectralon in log-scale for intensities for the out-of-plane OSL expereiment (a) 1.9×10¹¹ W/cm2, (b) 2.8×10¹¹ W/cm2, and (c) 4.9×10¹¹ W/cm2 . We see the curve of the
diffracted orders due to being in the out-of-plane diffraction orientation. (d) Shows the normalized energy for the three intensities shown at the diffracted order locations.
to the target. Light exiting the chamber could be observed on a Spectralon plate. Laser vaporization of the layer of aluminum was the source of the plasma generation. During an experiment, the presence or absence of diffracted orders in light leaving the exit port could be readily recorded by a camera imaging the Spectralon plate.
The main diagnostic for the experiment consisted of a Spectralon plate approximately 75 cm from the center of the chamber. The Spectralon plate was imaged by a 16-bit sci-grade camera timed to the laser shot. The camera was filtered using RG1000 to block out the visible light and let through only the 1.053 µm light reflecting off the Spectralon. In addition ND filters of varying density were used to limit saturation of the camera. Moreover, the geometric distortions were corrected using a fiducial grid and post-shot image processing so that we could measure the physical locations of any diffracted orders and compare that to what would be expected based on the fringe spacing of the grating.
Fifteen shots were taken on target. Approximately half were taken with the in-plane setup and half were taken with the out-of-plane setup. For the in-plane setup the input beams were in the horizontal plane, and the diffracted orders were found in the same horizontal plane, as visible in Fig. 4. For the out-of-plane setup the beams were in the vertical plane, and the diffracted orders were found to lie on a cone11, as seen in Fig. 5. We were able to
see the curvature of this cone on the Spectralon plate, as visible in Figs. 5(b) 7(b), and in 8.
We can calculate the normalized energy (ratio of energy in diffracted order to energy in zeroth order) at each diffracted order location. The normalized energy is shown in Fig. 8(d). We see that the normalized energy in this intensity regime is on the≈ 10% at the first diffracted order location and ≈ 3% at the second diffracted order location. This is lower than was seen on the NIF experiment. However, we see again that the plasma grating is in the Raman-Nath regime, not the Bragg regime, as made obvious by the observation of diffraction into the second order. We also completed a shot where one of the arms had its polarization rotated so that the two arms had orthogonal polarization. As expected, we saw no interference pattern at the target plane with a low intensity OSL regen shot and no diffracted orders for the higher intensity system shot.
IV. NUMERICAL SIMULATIONS AND DISCUSSION
One of the important questions raised by the comparison of the NIF experiment and the OSL experiment is why the two experiments had different relative energies at the diffracted order locations despite similar laser and target parameters. Indeed, the vacuum laser inten-sity per beam in the OSL in-plane diffraction experiment (2 beams) was ∼ 5 × 10¹¹ W/cm2,
which was higher than in the NIF experiment (8 beams), where each interacting beam was ∼ 3 × 10¹¹ W/cm2 (given the polarization scheme, each beam in the Q13B quad only
in-teracted with one other beam). However, the NIF experiment showed higher normalized fluence into the first order (≈ 60%) than in the OSL experiment (only ≈ 10%). The only significant differences in configuration between the experiments were: (i) the f-number of the beams, ≈ 96 in the OSL experiment and ≈ 22 in the NIF experiment, (ii) the existence of an auxiliary heater quad in the NIF experiment, (iii) the spot sizes, approximately 100 times larger in the NIF experiment.
A. Description of the model
Numerical simulations of the experiments were conducted in order to investigate the influence of these parameters. Time-dependent hydrodynamic parameters of the target ex-pansion were obtained using the radiative-hydrodynamic code HYDRA. The hydrodynamic simulation were set-up differently for the NIF and OSL experiments. In the OSL experi-ment, the beam was rather narrow (250µm measured radius at 1/e), and incident at 45◦ on
the target. Given the lack of laser/target symmetry, we conducted the simulation in full 3D geometry using Eulerian dynamics. This allowed for a realistic treatment of tranversal heat losses through electronic heat conduction. In the NIF experiment, the target was intercept-ing the interactintercept-ing beams 0.5m before their best focus (∼ 30 Rayleigh lengths), producing a focal spot on target of very large size (about 1.8x2.2cm) and smooth profile. Given the large dimensions and the beam spot quality, we conducted the hydrodynamic simulation in 1D for the NIF experiment, with the laser propagation of the 2 quads still described in 3D. Resonant absorption of the laser light during the early part of the interaction was accounted for by using a turning point laser deposition model with absorption efficiencies computed by adapting a common formulation25.
The hydrodynamic simulations were then post-processed using a dedicated laser-plasma interaction code in order to obtain the diffraction efficiencies. A plane wave of frequency ω propagating in a slab of length L with a transverse refractive index perturbation ∆N will accumulate a phase shift ψ = 2∆N L(ω/c) sin(qz− Ωt), where the sine term represents the spatial and temporal variation associated with the acoustic wave. The wave will undergo diffraction in the scattering slab and one can write the intensity of light in each diffraction order l as26:
Il =|A|2Jl(δ)2, (7)
where δ = 2∆N L(ω/c) is the modulation index and the Jl are the Bessel functions of the
first kind. We generalize this approach by computing the total modulation index that the laser field accumulates along its path S in the inhomogeneous plasma as:
δtot = 2(ω/c)
Z
S∆N (s)ds. (8)
the local electron density perturbation ∂ne/ne as: ∆N (s) = ∂ne ne (s) 4q1− ne(s)/nc , (9)
where ne is the electron density and nc is the critical density. The electron density
pertur-bation arises from the ponderomotive beating of the overlapped laser waves in the plasma, and can be written for linearly polarized waves27:
∂ne
ne
(s) = 2|K| sin(θ/2) N
2
1− N2|a1||a2| cos(θpol), (10)
where θ(s) is the local angle between the laser wavefields, N (s) is the local refractive index, a1(s) and a2(s) are the local normalized vector potentials a = vosc/cwhere voscis the electron
quiver velocity in the laser field, θpol(s) is the angle between the polarization vectors (in the
configurations here θpol = θ), and K(s) = χe(1 + χi)/(1 + χe+ χi), with χe(s) and χi(s)
the electron and ion plasma susceptibilities, respectively. Each interacting laser wavefield is sampled in space along R geometrical optics ray trajectories, along which Eq. 8 is integrated. The total power in each diffraction order l at a given time t then reads, for each interacting beam: Plt = R X k=1 pkJl(δtot,k)2, (11)
where pk is the transmitted power of ray k, that accounts for inverse Bremsstrahlung and
resonant absorption of the ray along its path. The hydrodynamic simulations are sampled and post-processed every 100 ps to obtain the values of Pt
l for each time t. We then compute
the total diffracted power in each order as Pl=PPlt.
B. Simulation results and interpretation of the experiments
Results of simulated versus measured diffraction efficiency as a function of diffraction order are shown in Fig. 9. OSL results are from the in-plane diffraction experiment with per beam intensity 5× 10¹¹ W/cm2 and total on target intensity 7× 10¹¹ W/cm2, versus
3×10¹¹W/cm2per beam and 1.5×10¹²W/cm2on target for the NIF case. Simulations were
conducted for various values of the flux limiter parameter fLin order to explore the influence
of temperature Te and density scalelength Ln on the diffraction efficiency. Both the OSL
−8 −6 −4 −2 0 2 4 6 8 Diffraction order 10−5 10−4 10−3 10−2 10−1 100 Normalized P ow er
NIF shot data NIF Sim. f=5% NIF Sim. f=8% NIF Sim. f=3% OSL shot data OSL Sim. f=5% OSL Sim. f=8%
FIG. 9. Power diffracted in each scattering order, normalized to the peak. The diffraction order is given with respect to one of the beam without loss of generality, so that the order 1 in this graph corresponds for the order 0 for the other beam. Experimental results are indicated as squares in the NIF case and stars in the OSL case. Numerical results for various value of the flux limiter are indicated as blue lines for the NIF case and green lines for the OLS case. The most realistic choice of flux limitation has been highlighted as a colored fill between the corresponding lines.
weak dependence on the choice of flux limitation (and hence plasma conditions), contrary to the NIF case. In both cases, the simulations suggest that the diffraction efficiency changes in time, with the first 400-500 ps of the interaction being dominated by direct reflected light due to short density scalelengths when the target is cold. The early zeroth order diffraction is several orders of magnitudes stronger than the other orders, implying that in order to get integrated diffraction efficiencies in the higher modes of the order of 10%, the process must be highly efficient during a long part of the interaction. We now explore several contributions to the diffraction efficiency from various hydrodynamic parameters by studying the flux limitation scaling.
First, in both cases, increasing the flux limitation leads to higher ZTe/Ti ratios. In the
beam and plasma configurations considered here, the plasma wave damping arises mainly from electron Landau damping and electron-electron collisions30, with negligible
contribu-tions from the ions29. In the approach described in Eq. 10, we only consider Landau
damping. We have found that this is a reasonable approximation, with an underestimation of the total damping by a factor of 2 maximum in the worst configurations. In our cases, the increase in ZTe/Ti leads to significant increase of the grating amplitude due to reduction of
ion acoustic wave damping.
Second, there is a large difference in the electron temperature and density scalelength variation with fL between the OSL and NIF cases. In the 3D OSL case, Te and Ln at the
resonant surface (mainly located around the M >∼ 1 surface here) vary weakly with the flux limitation parameter, leading to the small diffraction efficiency differences between the two cases observed in Fig. 9. In the 1D NIF case, Te increases by 50 to 100 eV for each instance
of increase in fL while Ln can double or triple each time. There are a few competing effects
here. Increases in the density scalelength lead to a wider resonance and hence more efficient overall diffraction efficiency (as observed on Fig. 9 between the cases fL= 3% and fL = 5%).
Conversely, an increase in electron temperature lead to more transmitted laser energy at the zero-th order mode during the early part of the interaction and hence reduces the overall diffraction efficiency (as observed between the cases fL = 5% and fL= 8%).
Finally, we have observed in the simulations that the flux limitation also influences the location of the resonant surface for optimal grating amplitude with respect to the laser propagation. In the 1D NIF case, increasing fL displaces the M=1 surface toward the
higher densities, in a way that is weakly dependent on time. For the fL = 5% case, the
surface is closest to the laser turning point for a long time. In the OSL case, the effect of fL on the surface displacement is much weaker, owing to the similar temperatures and
scalelengths.
Using the conclusions drawn in the study of the effect of flux limitation, we can infer the causes for differences between the NIF and OSL cases. Generally, the plasma near the resonant surface tends to be of similar scalelength for both cases, about twice hotter in the NIF case, and also with twice larger ZT e/T i. The distance from the resonant surface to the maximum laser intensity is rather small in the NIF cases throughout the pulse duration. The situation is more complex in the OSL case, where the M=1 surface is far beyond the laser turning point in the first part of the interaction and moves inward and past the maximum laser intensity area in the second part of the pulse.
Disentangling the relative contributions of each of these effect is delicate. Comparisons in simple laser-target configurations suggest that the increase in ZT e/T i has a significant effect, thus advantaging the NIF case. The increase in Te should lead to higher weight of
the m=0 mode, but this can be compensated by a higher amplitude density perturbation. Furthermore, it also appears that in the NIF configuration the position of the laser turning
point, where the intensity locally increases, is coinciding well with the resonant surface position. These combined effect tend to favor the NIF configuration. For simplicity, we have omitted in the discussion other effects such as secondary resonant surfaces occurring from the laser crossing configuration with respect to the plasma flow, and effects of spatial modulation of the resonance surface on the phase matching condition, but we note that all these effects are accounted for in the model and expected to only weakly affect the overall diffraction efficiency. Finally, we have investigated the contribution of differences in beam f-number, beam bandwidth or wavelength shift in the plasma28. These contributions were
found to be of second order to the overall diffraction efficiency.
V. CONCLUSIONS
We have shown that plasma gratings can be generated at the surface of oblique metallic surface for intensities below 1012 W/cm2 and with 1 ns square pulses at 1.053 µm. The
plasma gratings generated at NIF show normalized energy (compared to the energy in the zeroth order) of 60% and 40% for the first and second diffracted orders. The plasma gratings generated at OSL show normalized energy (compared to the energy in the zeroth order) of 10% and 3% for the first and second diffracted orders. Due to the presence of the second-order diffraction, plasma gratings were in the Raman-Nath regime, something not previously considered for ICF conditions. We have also shown conical diffraction from plasma gratings. Future work at the 1.053 µm wavelength should focus on optimizing the diffraction efficiency of the plasma grating for plasma photonics applications. This could include finding the optimum pulse energy and pulse length for good diffraction efficiency. At the same time future work at the 0.351 µm wavelength should be focused on how these plasma grating impact ICF research. This could include using common pulse shapes and energies from ICF studies and see how they interact with curved surface, which would approximate the inside wall of a hohlraum.
ACKNOWLEDGMENTS
This work performed under the auspices of the U.S. Department of Energy by Lawrence Livermore National Laboratory under Contract DE-AC52-07NA27344. LLNL-JRNL-763069.
REFERENCES
1D. C. Auth and W. G. Mayer, J. Appl. Phys. 38, 5138 (1967). 2D. C. Auth, Appl. Phys. Lett. 16, 521 (1970).
3W. R. Klein and B. D. Cook, IEEE T. Son. Ultrason. SU-14, 123 (1967). 4M. G. Moharam and L. Young, Appl. Optics 17, 1757 (1978).
5R. J. D. Miller, R. Casalegno, K. A. Nelson, M. D. Fayer, Chem. Phys. 72, 371 (1982). 6V. A. Manasson, L. S. Sadovnik, A. Moussessian, and D. B. Rutledge, IEEE T. Microw.
Theory 41, 2288 (1995).
7V. V. Eliseev, W. Rozmus, V. T. Tikhonchuk, and C. E. Capjack, Phys. Plasmas 3, 2215
(1996).
8L. Plaja and L. Roso, Phys. Rev. E 56, 7142 (1997).
9A. A. Andreev, K. Y. Platonov, and R. R. E. Salomaa, Phys. Plasmas 9, 581 (2002). 10Z. -M. Sheng, J. Zhang, and D. Umstadter, Appl. Phys. B 77, 673 (2003).
11J. E. Harvey and C. L. Vernold, Appl. Optics 37, 8158 (1998).
12J. Lindl, O. Landen, J. Edwards, E. Moses, Phys. Plasmas 21, 020501 (2014).
13G. Doumy, F. Qu´er´e, O. Gobert, M. Perdrix, Ph. Martin, P. Audebert, J. C. Gauthier, J.
-P. Geindre, and T. Whittmann, Phys. Rev. E 69, 026402 (2004).
14M. Th´evenet, A. Leblanc, S. Kahaly, H. Vincenti, A. Vernier, F. Qu´er´e, and J. Faure, Nat.
Phys. 12, 355 (2016).
15S. Monchoc´e, S. Kahaly, A. Leblanc, L. Videau, P. Combis, F. R´eau, D. Garzella, P.
D’Oliveira, Ph. Martin, F. Qu´er´e, Phys. Rev. Lett. 112, 145008 (2014).
16A. Leblanc, S. Monchoc´e, C. Bourassin-Bouchet, S. Kahaly, and F. Qu´er´e, Nat. Phys. 12,
301 (2016).
17J. Wang, C. -H. Pai, M. -W. Lin, K. -H. Lee, L. -C. Ha, S. -Y. Chen, and J. -Y. Lin, in
Nonlinear Optics: Materials, Fundamental and Applications: 2007, Kona, Hawaii United States, 30 July 2007-3 August 2007 (Optical Society of America, Washington D.C., 2007), ThB4.
18Y. Shou, H. Lu, R. Hu, C. Lin, H. Wang, M. Zhou, X. He, J. E. Chen, and X. Yan, Opt.
Lett. 41, 139 (2016).
20D. Turnbull, P. Michel, T. Chapman, E. Tubman, B. B. Pollock, C. Y. Chen, C. Goyon,
J. S. Ross, L. Divol, N. Woolsey, and J. D. Moody, Phys. Rev. Lett. 116, 205001
21C. A. Haynam, P. J. Wegner, J. M. Auerbach, M. W. Bowers, S. N. Dixit, G. V. Erbert,
G. M. Heestand, M. A. Henesian, M. R. Hermann, K. S. Jancaitis, K. R. Manes, C. D. Marshall, N. C. Mehta, J. Menapace, E. Moses, J. R. Murray, M. C. Nostransd, C. D. Orth, R. Patterson, R. A. Sacks, M. J. Shaw, M. Spaeth, S. B. Sutton, W. H. Williams, C. C. Widmayer, R. K. White, S. T. Yang, and B. M. Van Wonterghem, Appl. Optics 46, 3276 (2007).
22M. L. Spaeth, K. R. Manes, D. H. Kalantar, P. E. Miller, J. E. Heebner, E. S. Bliss, D. R.
Speck, T. G. Parham, P. K. Whitman, P. J. Wegner, P. A. Baisden, J. A. Menapace, M. W. Bowers, S. J. Cohen, T. I. Suratwala, J. M. Di Nicola, M. A. Newton, J. J. Adams, J. B. Trenholme, R. G. Finucane, R. E. Bonanno, D. C. Rardin, P. A. Arnold, S. N. Dixit, G. V. Erbert, A. C. Erlandson, J. E. Fair, E. Fegienbaum, W. H. Gourdin, R. A. Hawley, J. Honig, R. K. House, K. S. Jancaitis, K. N. LaFortune, D. W. Larson, B. J. Le Galloudec, J. D. Lindl, B. J. MacGowan, C. D. Marshall, K. P. McCandless, R. W. McCracken, R. C. Montesanti, E. I. Moses, M. C. Nostrand, J. A. Pryatel, V. S. Roberts, S. B. Rodriguez, A. W. Rowe, R. A. Sacks, J. T. Salmon, M. J. Shaw, S. Sommer, C. J. Stolz, G. L. Tietbohl, C. C. Widmayer, and R. Zacharias, Fusion Sci. Technol. 69, 25 (2016).
23J-M. Di Nicola (private communication, 2011).
24M.C. Nostrand, T.L. Weiland, R.L. Luthi, J.L. Vickers, W. D. Sell, J. A. Stanley, J. Honig,
J. M. Auerbach, R. P. Hackel, and P. J. Wegner, in Proceedings of SPIE Volume 5273: Laser-Induced Damage in Optical Materials: 2003, Boulder, Colorado United States, 22 September-24 September 2003, edited by G. J. Exarhos, A. H. Guenther, N. Kaiser, K. L. Lewis, M. J. Soileau, and C. J. Stolz (SPIE, Bellingham, 2003), pp. 325-333.
25W. L. Kruer, The Physics of Laser Plasma Interactions, (Westview, 2003). 26R. W. Boyd Nonlinear Optics, (Academic, 2003).
27P. Michel, W. Rozmus, E. A. Williams, L. Divol, R. L. Berger, S. H. Glenzer, and D. A.
Callahan, Phys. Plasma 20, 056308 (2013).
28T. Dewandre, J. R. Albritton, and E. A. Williams, Phys. Fluids 24, 1958 (1981).
29V. Yu. bychenkov, J. Myatt, W. Rozmus and V. T. Tikhonchuk, Phys. Plasma 1, 2419
30V. Yu. bychenkov, J. Myatt, W. Rozmus and V. T. Tikhonchuk, Phys. Plasma 52, 6759