HAL Id: hal-01489116
https://hal.archives-ouvertes.fr/hal-01489116
Submitted on 26 Apr 2019
HAL is a multi-disciplinary open access
archive for the deposit and dissemination of
sci-entific research documents, whether they are
pub-lished or not. The documents may come from
teaching and research institutions in France or
abroad, or from public or private research centers.
L’archive ouverte pluridisciplinaire HAL, est
destinée au dépôt et à la diffusion de documents
scientifiques de niveau recherche, publiés ou non,
émanant des établissements d’enseignement et de
recherche français ou étrangers, des laboratoires
publics ou privés.
Copyright
Anti-heat shock protein autoantibody profiling in breast
cancer using customized protein microarray
Liu Shi, Thomas Gehin, Yann Chevolot, Eliane Souteyrand, Alain Mangé,
Jérôme Solassol, Emmanuelle Laurenceau
To cite this version:
Liu Shi, Thomas Gehin, Yann Chevolot, Eliane Souteyrand, Alain Mangé, et al.. Anti-heat shock
protein autoantibody profiling in breast cancer using customized protein microarray. Analytical and
Bioanalytical Chemistry, Springer Verlag, 2016, 408 (5), pp.1497-1506. �10.1007/s00216-015-9257-2�.
�hal-01489116�
Anti-heat shock proteins autoantibodies profiling in breast
cancer using customized protein microarray
Liu Shi 1, Thomas Gehin 1, Yann Chevolot 1, Eliane Souteyrand 1, Alain Mangé 2, Jérôme Solassol 2 and Emmanuelle Laurenceau 1 *
Abstract
Heat shock proteins (HSPs) are over-expressed in a wide range of human cancers. It results in the stimulation of the immune system and consequently in elevated concentration of anti-HSP autoantibodies. Elevated anti-HSP autoantibodies were found in breast cancer patients and they are associated with tumor metastasis. Therefore, screening these autoantibodies could be of diagnostic and prognostic values. Protein microarrays have already demonstrated their great potential as diagnostic tool. However, protein diversity requires optimization of the microarray fabrication to achieve high sensitivity and specificity. In this study, seven HSPs were immobilized on 6 different surface chemistries. After evaluation and optimization with purified antibodies of the six surface chemistries, two surfaces were selected to detect anti-HSP autoantibodies in breast cancer sera. Multiplex detection of anti-HSPs autoantibodies allowed discrimination of breast cancer patients (50) from healthy controls (26) with a sensitivity of 86% and a specificity of 100%.
Keywords: breast cancer; autoantibodies; heat shock proteins; protein microarray
Introduction
Breast cancer becomes the most common cancer among women worldwide. Early diagnosis of breast cancer can greatly improve women's chances of survival. Recently, large number of serological tumor markers have been identified and some of them have been available for clinical diagnosis [1-4]. Among diverse serological biomarkers, autoantibodies directed against tumor associated antigens show appealing features because of their stability and high concentrations [5-8]. Heat shock proteins (HSPs) are over expressed in a wide range of human cancers and elevated HSPs expression in tumors could also stimulate the immune system to produce autoantibodies against HSPs [9, 10]. Indeed, elevated levels of antibodies against several HSPs were found in breast cancer serum. Moreover, some of them were associated with tumor metastasis. For example, autoantibodies against HSPB1 and HSP90 were associated with improved and decreased survival, respectively [11-17]. Therefore, screening antibodies against HSPs could provide diagnostic and prognostic values for breast cancer patients.
Enzyme-linked immunosorbent assay (ELISA) is the most commonly used format to test the interaction between antibodies and antigens. However, ELISA is expensive for multiplex analysis and consumes relatively large amounts of biological products and patient specimen. In contrast, protein microarray could provide high throughput data by consuming only minute sample amounts [18, 19]. Although protein microarray can perform high throughput detection in a single assay, efficient multiplex analysis requires among others to adapt surface chemistry to each protein in order to achieve high diagnostic performances [20, 21]. Protein can be immobilized through physisorption or chemisorption. Physical adsorption is the easiest way for protein immobilization and can exhibit excellent binding capacities. However, owing to random interaction, non-covalent binding cannot control the amount and orientation of immobilized proteins. Thus efficiency, accuracy and reproducibility of the immobilization process may be variable [22, 23]. Furthermore, the background level is usually higher due to a higher non-specific protein adsorption [24, 25]. Covalent binding requires the presence of reactive groups on the
1
Emmanuelle Laurenceau
Email address: [email protected]
Tel : +33 (0)4 72 18 62 40 Fax : +33 (0)4 78 33 15 77
1
Université de Lyon; Institut des Nanotechnologies de Lyon INL-UMR5270, CNRS, Ecole Centrale de Lyon, Ecully, F-69134, France
2 Institut de Recherche en Cancérologie de Montpellier INSERM U1194, Campus Val d’Aurelle, Montpellier,
support which can react with probe molecules. The main advantage of covalent binding is its enhanced stability of immobilized proteins. However, it can lead to partial loss of biological activity of proteins after immobilization [26, 27]. Furthermore, the orientation is not always guaranteed due to the presence of several reactive groups on proteins. Therefore, both binding strategies have advantages and shortcomings. Furthermore, the immobilization efficiency is closely dependent on captured proteins. There is no unique surface chemistry which is suitable for all proteins immobilization due to highly diverse and complex structures of proteins. Therefore, one should take into account the diversity of proteins in order to choose for each protein the optimal surface to retain the highest biological activity.
In previous work, we have developed, chemically and biologically characterized 6 surface chemistries exhibiting different functional groups, including carboxylic (COOH), N-hydroxy succinimide (NHS), chitosan, amine (NH2), maleic anhydride (MAMVE) and NHS-activated carboxymethyl dextran (CMD). Our results demonstrated that the extent of the interactions of immobilized antigens with their antibodies (and consequently the performance of protein microarray) was surface-dependent [28]. Other parameters affected the performance of protein microarray such as pH of the spotting buffer, the concentration of protein to be immobilized in the spotting buffer proteins, etc. For example, protein immobilization on chitosan surface was more efficient when spotting buffer was sodium carbonate buffer at pH=9.7, instead of the commonly used PBS [29].
In this study, our purpose was to develop a customized HSP microarray to detect anti-HSPs autoantibodies in breast cancer. We firstly screened the optimal immobilization conditions for each probe antigen (HSPs). HSPB1, HSPD1, HSP70, HSP90, HSP110, HSPA5, HSP90B1 and p53 were immobilized on 6 different surface chemistries under various conditions. Then, the resulting microarrays were tested for their ability to interact specifically with purified antibodies. Our results demonstrate that biological activity of immobilized antigens was dependent on surface chemistry. Among all tested surfaces, 2 surface chemistries were selected for patient sera screening. The presence of antibodies directed against these 8 tumor antigens were evaluated in 50 sera from breast cancer patients and 26 healthy donors under optimal conditions. In the following, anti-HSP autoantibodies will refer to antibodies secreted by the patient, while anti-HSP antibodies will refer to commercial purified antibodies.
Materials and methods
MaterialsGlass and all chemicals were commercial available unless otherwise stated. Borosilicate flat glass slides (76 cm × 26 cm×1 cm) were purchased from Schott (Mainz, Germany). 0.01 M phosphate-buffered saline (PBS, pH 7.4), sodium bicarbonate NaHCO3 (Mr = 84.01 g/mol), sodium carbonate Na2CO3 (Mr = 105.99 g/mol), N-Hydroxysuccinimide (NHS), N,N’-diisopropylcarbodiimide (DIC), tetrahydrofuran (THF) (purum grade), Dimethyl sulfoxide (DMSO, anhydrous, 99.9%), 2-(N-morpholino) ethanesulfonic acid (MES), (3-glycidoxypropyl) dimethylethoxysilane (APDMES) and maleic anhydride-alt-methyl vinyl ether (MAMVE, Mw = 216,000 g/mol) were all obtained from Sigma (St. Quentin Fallavier, France). Dextran (Mw = 40,000 g/mol) and Tween 20 were purchased from Pharmacosmos and Roth-Sochiel (Lauterbourg, France), respectively. Chitosan (Mw = 470,000 g/mol, degree of deacetylation (DD) 94%) was kindly provided by Dr. T. Delair (Polymer Materials and Biomaterials Laboratory (LMPB), University Lyon 1, France). Ultrapure water (18.2 MΩ) was delivered by an Elga water system.
HSPB1 (adi-esp-715-d), HSP70 (adi-nsp-555-d), HSP90 (adi-spp-776-d), mouse-anti human anti-HSPB1 antibody-biotin (adi-spa-800B-F), anti human anti-HSP70 antibody-biotin (adi-spa-810B-F) and mouse-anti human mouse-anti-HSP90 mouse-antibody (adi-spa-831-200) were all purchased from Enzo life science (Switzerland); HSPD1 (ab113177), HSPA5 (ab78432), HSP90B1 (ab188463), HSP110 (ab78790), rabbit-anti human anti-HSPD1 antibody-biotin (ab105853) and mouse-anti human anti-HSP90B1 antibody (ab63469) were obtained from Abcam (UK); p53 (p6249) and mouse-anti human anti-p53 antibody-biotin (MA5-12554) were obtained from Sigma and Thermo Scientific (USA), respectively; mouse-anti human anti-HSPA5 antibody (MAB4846) and mouse-anti human anti-HSP110 antibody (MAB4029) were obtained from R&D Systems (USA); F555-labeled streptavidin (S-21381) was purchased from Invitrogen; Cy3-F555-labeled goat anti-human antibody immunoglobulins G (IgG) (109-165-008) and Cy3-labeled goat anti-mouse antibody IgG (115-165-008) were purchased from Jackson Immuno Research (USA). All the proteins were stored as aliquot at -20°C or -80°C following manufacturer specifications. Bovine serum albumin (BSA) lyophilized powder was obtained from Sigma (St. Quentin Fallavier, France).
0.01 M PBS or PBS 1X (pH 7.4) was prepared by dissolving the content of one pouch of dried powder in 1 L of ultrapure water. 0.1 M sodium acetate powder was dissolved to obtain the sodium acetate buffer, and pH was adjusted to 4.5. 0.02 M sodium carbonate buffer at pH 10.7 were prepared from 0.1 M NaHCO3 and 0.1 M
Na2CO3 solutions in ultrapure water. 0.01 M 2-(N-morpholino) ethanesulfonicacid (MES) (pH6.2) was prepared
by dissolving the content of one pouch in to 1L ultrapure water and adjust pH up to 6.2. Washing buffer contained PBS 1X and 0.1% Tween 20 (PBS-T) at pH 7.4. Blocking solution was prepared by dissolving 10 g of BSA in 100 ml of PBS-T 0.1%.
Serum samples
All human samples were prospectively collected between 2005 and 2007 at the CRLC Val d’Aurelle Cancer Institute (Montpellier, France) at the time of cancer diagnosis after obtaining written informed consent. Blood samples were centrifuged at 1250g for 5min, and the serum was stored at -80°C. For the multiplex immunoassay, 76 serum samples were examined: 26 sera from healthy controls with negative mammograms, negative physical breast exams for at least 4 years, and no history of prior malignancy; 50 sera from breast cancer patients who underwent tumor resection surgery. Tumor stage was determined by mammography analysis (tumor size and aspect) and histopathological classification of biopsies. All examinations were realized at CRLC Val d’Aurelle Cancer Institute (Montpellier, France). Among these 50 breast cancer patients, 25 patients were diagnosed at stage I, 15 patients at stage II and 10 patients at stage III. This study was approved by the Montpellier University Hospital human research committee and the INSERM review board (RBM-03-63).
Surface functionalization of glass slides
The details of surface functionalization of glass slides are presented in Electronic Supplementary Material Fig. S1 and reported in [29]. Briefly, flat and microstructured glass slides were functionalized with 6 different chemistries: Carboxylic surface (COOH) was obtained after hydrolysis of the tert-butyl esters from tert-butyl-11-(dimethylamino) silylundecanoate silanized surface; NHS surface was obtained from N-hydroxy succinimide activation of COOH surface; Chitosan surface was obtained by functionalization of the NHS surface with 1mg/mL chitosan solution; APDMES surface was obtained by silanization with (3-aminopropyl) dimethylethoxysilane; MAMVE and CMD surfaces were obtained by functionalisation of APDMES surface with maleic anhydride- methyl vinyl ether copolymer solution (1mg/mL) and NHS-activated carboxymethyl dextran solution (1mg/mL), respectively.
Optimization of protein immobilization condition
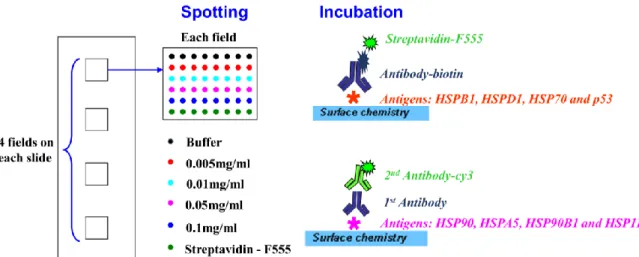
HSPB1, HSPD1, HSP70, p53, HSP90, HSPA5, HSP90B1 and HSP110 were spotted (sciFLEX-ARRAYER S3, Scienion, Germany) onto chemically functionalized flat glass slides according to the image presented in Fig. 1. Each field contains one protein spotted at different concentrations (0.005mg/mL, 0.01mg/mL, 0.05mg/mL and 0.1mg/mL). For each concentration, 8 replicates were spotted. Streptavidin-F555 (0.01mg/mL) and buffer were spotted as reference protein for quality and negative controls, respectively. According to our previous results, carbonate buffer (pH=9.6) was used as spotting buffer on chitosan surface; acetate buffer (pH=4.5) was used on the other 5 surfaces (COOH, NHS, APDMES, CMD and MAMVE surface). After spotting, proteins were allowed to react with surfaces under saturated water vapors overnight at 4°C. Then slides were washed sequentially for 2 × 5 min with PBS, for 5 min with PBS-T (0.1%), and blocked with 10% BSA/PBS-T (0.1%) solution for 2h at room temperature (R.T.) to limit unspecific adsorption. Then slides were washed for 3 × 5 min with PBS-T (0.1%) and dried by centrifugation 3min at 1300rpm.
Fig. 1 Scheme of protein microarray design. 4 proteins were spotted per slide. Each field includes buffer
(negative control), streptavidin-F555 (quality control), one protein at 4 different concentrations; each solution has 8 replications. HSPB1, HSPD1, HSP70 and p53 were spotted on the same slide; HSP90, HSPA5, HSP90B1 and HSP110 were spotted on another slide. For the incubation, HSPB1, HSPD1, HSP70 and p53 were firstly incubated with biotin labeled antibodies then with streptavidin-F555; HSP90, HSPA5, HSP90B1 and HSP110 were firstly incubated with non-labeled antibodies and then with Cy-3 labeled second antibody.
Slides were then incubated with 0.5µM purified antibodies diluted in 4% BSA/PBS-T 0.1%. These antibodies include biotin labeled antibodies against HSPB1, HSPD1, HSP70 and p53 and non-labeled antibodies against HSP90, HSPA5, HSP90B1 and HSP110. Each field was incubated with only one solution and then left to react for 1h at R.T. in saturated water vapors; then slides were washed for 3 × 5 min with PBS-T 0.1% and dried. Fields tested with purified biotin-labeled antibodies (biotin labeled antibodies against HSPB1, HSPD1, HSP70 and p53) were then incubated with streptavidin-F555 (0.01mg/mL diluted in 1% BSA/PBS); fields tested with purified unlabeled antibodies (antibodies against HSP90, HSPA5, HSP90B1 and HSP110) were incubated with Cy3-labeled goat anti-mouse IgG (0.015mg/mL in 1% BSA/PBS-T 0.1%). All incubations were left to react for 1h at R.T. in saturated water vapors and then slides were washed for 3 × 5 min with PBS-T 0.1 %, 10 seconds in DI water and then dried.
Multiplex immunoassays on micro-structured protein microarray for the detection of anti-HSP autoantibodies in sera
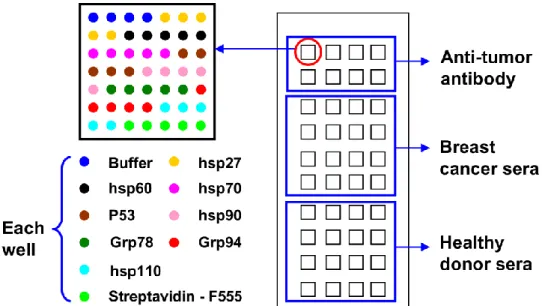
HSPB1, HSPD1, HSP70, p53, HSP90, HSPA5, HSP90B1 and HSP110 were spotted at their optimal concentration (sciFLEX-ARRAYER S3, Scienion, Germany) into microwells of COOH and chitosan functionalized glass slides, as indicated in Fig. 2. On COOH surface, all proteins were spotted in acetate buffer (pH 4.5); on chitosan surface, carbonate buffer (pH 9.6) was used as spotting buffer; each protein has 5 replications. Buffer and streptavidin-F555 were spotted as negative and quality controls, respectively. After spotting, proteins were allowed to react with functionalized surfaces under saturated water vapors overnight at 4°C. Then slides were washed sequentially for 2 × 5 min with PBS, for 5 min with PBS-T (0.1%), and blocked with 10% BSA/PBS-T 0.1% solution 2h at R.T. to limit unspecific adsorption. Then slides were washed for 3 × 5 min with PBS-T 0.1% and dried by centrifugation 3min at 1300rpm.
Fig. 2 Scheme of protein chip design. Each micro-well contains streptavidin-F555, buffer, HSPB1, HSPD1,
HSP70, p53, HSP90, HSPA5, HSP90B1 and HSP110 spotted in 5 replicates. Line 1 and 2 were incubated with purified antibody for positive control; line 3 to 6 were incubated with sera from breast cancer patients and line 7-10 with healthy donor sera
On each micro-structured slide, 8 micro-wells were incubated with 0.5µM purified antibodies diluted in 4% BSA/PBS-T 0.1%. These antibodies include biotin labeled antibodies against HSPB1, HSPD1, HSP70 and p53 and non-labeled antibodies against HSP90, HSPA5, HSP90B1 and HSP110. 16 micro-wells with sera from breast cancers and 16 micro-wells with sera from healthy donors (diluted with 4% BSA/PBS-T 0.1% at 1/200), as shown in Fig. 2. Two cancer patients’ sera and two healthy donor’s sera were used as reference sera to normalize data inter slides. Each micro-well was incubated with only one sample and then left to react for 1h at R.T. in saturated water vapors; then slides were washed for 3 × 5 min with PBS-T and dried.
Micro-wells tested with purified biotin labeled antibodies (biotin labeled antibodies against HSPB1, HSPD1, HSP70 and p53) were incubated with streptavidin-F555 (0.01mg/mL diluted in 1% BSA/PBS); micro-wells tested with purified unlabeled antibodies (antibodies against HSP90, HSPA5, HSP90B1 and HSP110) were incubated with Cy3-labeled goat anti-mouse IgG (0.015mg/mL in 1% BSA/PBS-T 0.1%); micro-wells tested with sera were incubated with Cy3-labeled goat anti-human IgG (0.015mg/mL in 1% BSA/PBS-T 0.1%). All incubations were left to react for 1h at R.T. in saturated water vapors, and then slides were washed for 3 × 5 min with PBS-T 0.1%, 10 seconds in DI water and dried.
Fluorescence scanning
After drying, slides were scanned with the Microarray scanner Innopsys (InnoScan 710 Mapix 2Go software package) at wavelengths of 532nm with high laser power. Data mining was accomplished with Mapix 2Go software package (Innopsys). The fluorescence signal obtained for each antigen-antibody system was determined as the average of the median fluorescence signal of several replicates. The signal-to-noise ratio (SNR) was calculated as the ratio between the fluorescence signal of each antigen-antibody system and the fluorescence signal of buffer spots.
Data analysis
The seroreactivities of antibodies to tested tumor antigens were compared using the Mann–Whitney test. Differences were considered statistically significant when P < 0.05. Individual and combined autoantibody performances were based on the ROC curves. The generalized ROC criterion finds the best linear combination (virtual marker) of tumor markers such that the area under the ROC curve (AUC) is maximized. Statistical analyses were performed using mROC [30].
Heat shock proteins are induced by stress conditions such as heat shock, decrease in pH, hyper-salinity, alcohols, heavy metals, oxidative stress, inhibitors of energy metabolism and fever or inflammation. They are molecular chaperones that act to assist other proteins' folding and maturation [31, 32]. HSPs were shown to be over-expressed in a wide range of human cancers and elevated HSPs expression in tumor can stimulate the immune system to produce their corresponding autoantibodies. Therefore, autoantibodies against HSPs were found to be useful for discriminating breast cancer patients from healthy controls. Titration of anti-HSP autoantibodies have been reported using enzyme linked immunosorbent assay (ELISA) and western blot (WB). Herein, we report on the fabrication of an HSP microarray (HSP are immobilized on substrate) for the detection of anti-HSP autoantibodies. In the first section, immobilization of HSPs was evaluated as a function of surface chemistry and spotting concentration by measuring their biological activity. From this result, we selected the best immobilization conditions for each HSP and used the resulting microarray for the detection of anti-HSP autoantibodies in patient sera. The cohorts were composed of 50 breast cancer patient sera and 26 healthy donor sera.
Optimization of tumor antigens microarray conditions
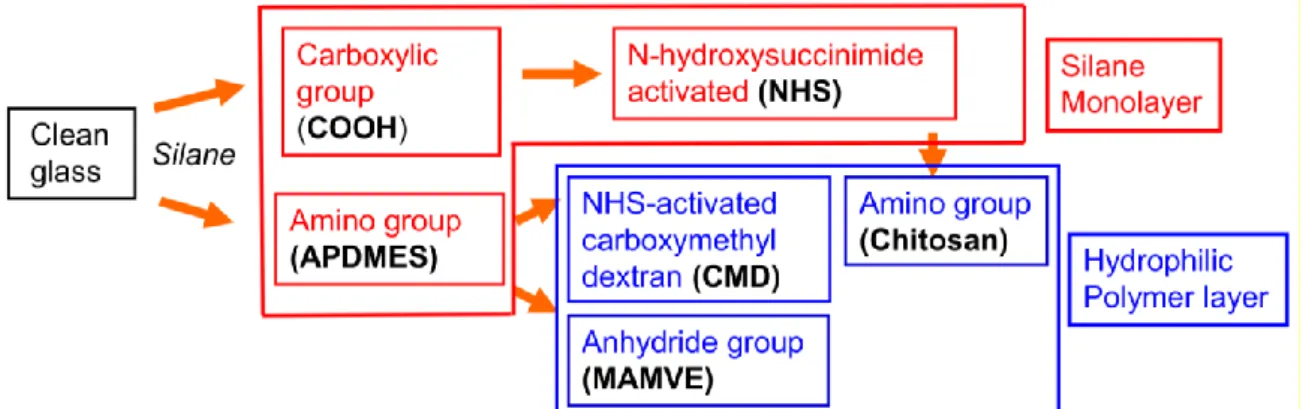
In this optimization process, we evaluated two parameters. The first parameter evaluated was surface chemistry. In total, 6 surface chemistries (Fig. 3) were tested for the immobilization of these tumor antigens. These 6 surface chemistries have been developed and well characterized in our previous works [29, 33]. On COOH, chitosan and APDMES surfaces, the binding strategy between surface and protein was achieved through physical adsorption; while on NHS, NHS-activated CMD and MAMVE surfaces, protein immobilization was achieved by covalent binding. Furthermore, COOH, NHS and APDMES surfaces are composed of silane monolayer whereas chitosan, CMD and MAMVE surfaces were grafted with hydrophilic polymers. Indeed, polymers and multilayer coated surfaces were shown to better maintain the native conformation of proteins and their biological activity [34-37]. In addition to the immobilization strategy, the physicochemical characteristics of captured proteins (size, structure, charge) greatly influence immobilization efficiency and biological activity [28, 29, 38]. Therefore, it is necessary to evaluate these various chemistries in order to determine the best ones for each antigen.
Fig. 3 Scheme of the 6 surface chemistries evaluated for antigen microarrays elaboration. Functionalization with
silane monolayers are indicated in red; functionalization with polymers are indicated in blue.
The second parameter evaluated was the concentrations of immobilized tumor antigens. HSPB1, HSPD1, HSP70, HSP90, HSPA5, HSP90B1, HSP110 and P53 were spotted at four different concentrations (0.005mg/mL, 0.01mg/mL, 0.05mg/mL and 0.1mg/mL) on the 6 different chemically functionalized glass slides. The biological activity of immobilized tumor antigens was evaluated by measuring the extent of their interaction with their corresponding antibodies (e.g. Fig. 1).
Fig. 4 (a) shows the fluorescent images corresponding to HSP110/anti-HSP110 antibody interaction on the 6 surface chemistries. For each image, the top line corresponds to buffer spots and the following 4 lines correspond to 4 concentrations of spotted HSP110 (0.005mg/mL, 0.01mg/mL, 0.05mg/mL, and 0.1mg/mL). At low concentrations (0.005mg/mL, 0.01mg/mL), biological recognition between immobilized HSP110 and anti-HSP110 antibody was merely (not) detected, indicating that the surface density of anti-HSP110 was too low for the efficient detection of the anti-HSP110 antibody. Above 0.01 mg/mL, the fluorescence signal increased with increasing concentrations of spotted HSP110 on all surface chemistries. Moreover, we can notice that the fluorescent signal on the spots corresponding to the buffer was below 400 indicating low non-specific adsorption.
Fig. 4 (b), (c) and (d) represent the signal to noise ratio (SNR) obtained for the detection of anti-HSP110 antibody, anti-HSPD1 antibody and anti-HSP70 antibody on the 6 surface chemistries, respectively. Here, the SNR was the ratio between the fluorescence signals measured on tumor antigens spots over the fluorescent signals measured on the buffer spots. As expected, SNR increased with increasing of HSP concentration in the spotting buffer, suggesting that the surface density of immobilized tumor antigen was consequently increased while background signal remained low. However, the detection of anti-HSP110 antibody, anti-HSPD1 antibody and anti-HSP70 antibody on NHS, APDMES and MAMVE surfaces was not efficient whatever the spotting concentration of the tumor antigens. In contrast, the detection of HSP110 antibody, HSPD1 and anti-HSP70 antibodies on COOH and chitosan surface displayed enhanced signal even when the concentration of spotted HSP was as low as 0.05mg/mL. For the other HSPs and P53, COOH and chitosan surfaces were also the best surfaces and were selected for further evaluation of breast cancer sera (see Electronic Supplementary Material Fig. S2).
Fig. 4 Detection of anti-HSP antibody as a function of HSP spotting concentration and surface chemistry. (a)
Fluorescent scanning images of anti-HSP110 antibody detection on the 6 surface chemistries; line1: buffer; line 2: 0.005mg/mL, line3: 0.01mg/mL, line 4: 0.05mg/mL, line5: 0.1mg/mL (HSP110 spotting concentration). (b), (c) and (d): fluorescent signal analysis (SNR) of anti-HSP110 antibody, anti-HSPD1 antibody and anti-HSP70 antibody detection on 6 surface chemistries.
Next, we estimated the best immobilization concentration needed for each HSP on COOH and chitosan surface to efficiently detect anti-HSP antibody. In order to reduce reagent consumption, thus cost of the assay, we decided not to use the highest spotting concentration (0.1 mg/mL) except if SNR is too low. From the variation of SNR with spotting concentration (Fig. 4), the immobilization concentration for each HSP chosen is reported on Table 1. These concentrations allowed sensitive detection of antibodies against HSPs and P53 with high SNR values. Optimized immobilization of P53 for the detection of anti-P53 autoantibody was reported before [29].
Table 1 Optimal spotting conditions for efficient immobilization of the 8 tumor antigens for screening anti-HSP
and anti-P53 autoantibodies in breast cancer sera.
Immobilized tumor antigen Optimal surfaces Optimal immobilization concentration
HSPB1 chitosan 0.05mg/mL
HSPD1 COOH 0.05mg/mL
HSP70 chitosan = COOH 0.05mg/mL
P53 COOH > chitosan 0.1mg/mL
HSP90 chitosan > COOH 0.05mg/mL HSPA5 COOH > chitosan 0.05mg/mL HSP90B1 COOH > chitosan 0.05mg/mL HSP110 COOH > chitosan 0.05mg/mL
Detection of autoantibodies against HSPs and P53 in breast cancer sera by multiplex immunoassays on antigen microarray
50 breast cancer sera and 26 healthy donor sera were tested for the presence of autoantibodies against HSPs and P53 by multiplex immunoassay on micro-structured glass slides functionalized with COOH and chitosan. Results obtained were shown in the scatter plot in Fig. 5. If p value is less than 0.05, it means that there is difference between healthy controls and breast cancers. On COOH surface, the presence of autoantibodies against HSPD1, HSP70, HSP90 and HSP90B1 was significantly different between breast cancer patients and healthy controls (p<0.05). In contrast, the presence of autoantibodies against HSPB1 and HSPA5 was significantly detected on chitosan surface between these two groups of sera. No significant difference was observed for the presence of autoantibodies against P53 and HSP110 between these two groups on both COOH and chitosan surface.
Optimal surface chemistries for the detection of anti-HSPD1, anti-HSPB1 and anti-HSP90B1 autoantibodies in sera were in accordance with our conclusions drawn from table 1. For example, COOH surface displayed the highest signal for detecting purified antibodies against HSPD1 and HSP90B1. Similarly, the detection of the anti-HSPD1 autoantibody and anti-HSP90B1 autoantibody in sera was significantly different between breast cancer patients and healthy controls on COOH surface. The same tendency was also observed for the detection of anti-HSPB1 antibody on chitosan surface. On the contrary, the detection of autoantibodies against HSP90 and HSPA5 was not consistent with the results obtained with purified antibodies. This inconsistence should arise from the complex nature of sera composition as opposed to purified model solution used for optimization. In purified model solution, only one single antibody was present at a time while many antibodies and proteins are present in sera. Moreover, concerning the detection of anti-HSP110 autoantibodies, no differences were obtained on both surfaces, between breast cancer sera and healthy control sera. This result suggests that in the tested sera samples, anti-HSP110 autoantibodies could not be useful as diagnosis or prognosis biomarker.
(a) (b)
Fig. 5 Scatter plots of SNR value of autoantibodies against 7 HSPs (HSPB1, HSPD1, HSP70, HSP90, HSPA5
and HSP90B1) and P53 in breast cancer patients (n=50) and healthy controls (n=26); (a) and (b) represent the results on COOH and chitosan surfaces, respectively. HC: healthy controls; BC: breast cancer; *: p < 0.05 (p value was calculated by Mann–Whitney test).
Taking into account these results, we constructed the receiver operating characteristic curve (Fig. 6) and calculated the area under ROC curve (AUC) (Table 2) for each relevant tumor antigen/anti-tumor antigen antibody system in their best detection condition. It is commonly accepted that ROC curves with an AUC≤0.75 are not clinically useful and an AUC≥0.97 has a very high clinical value [39].
As shown in Fig. 6, as individual markers, these autoantibodies displayed weak performance in discriminating breast cancer patients from healthy controls on both COOH and chitosan surface. The area under receiver operating characteristic curve (AUC) ranges from 0.581 to 0.732 (Table 2). However, the combination of 7 autoantibodies (the black line in Fig. 6) displayed an AUC of 0.978 (Table 2), having a high value to discriminate breast cancer patients from healthy controls. Thus the detection of a panel of relevant biomarkers improved performance for discriminating patients from healthy controls. It could achieve a sensitivity of 86% and a specificity of 100%. Expectedly, at higher sensitivity values, the overall specificity of the panel dropped to 96% (at 90% sensitivity) and to 70% (100% sensitivity). The correlation of autoantibodies panel with the tumor stage was also evaluated but no significant correlation was obtained.
Fig. 6 Receiver operating characteristic (ROC) curve analysis of individual autoantibody and combination of 7
autoantibodies to discriminate breast cancer patients from healthy controls. The detection of autoantibodies against HSPD1, HSP70, HSP90 and HSP90B1 was obtained on COOH surface; the detection of autoantibodies against HSPB1, P53 and HSPA5 was obtained on chitosan surface.
Table 2 The area under receiver operating characteristic curve (AUC) of individual autoantibody and
Anti-HSP antibody AUC (95% CI) Anti-HSPB1 antibody* 0.631 (0.528-0.743) Anti-HSPD1 antibody** 0.683 (0.581-0.773) Anti-HSP70 antibody** 0.732 (0.663-0.817) Anti-p53 antibody* 0.581 (0.459-0.695) Anti-HSP90 antibody** 0.710 (0.621-0.837) Anti-HSPA5 antibody* 0.723 (0.567-0.836) Anti-HSP90B1 antibody** 0.728 (0.608-0.837) Combination of 7 antibodies 0.978 (0.938-1.000)
*The detection of autoantibodies was obtained on chitosan surface, **the detection of autoantibodies was obtained on COOH surface.
The frequency of autoantibodies against HSPs reported in literatures was compared to our results (Table 3).
Table 3 Frequency of single anti-HSP autoantibody detected in breast cancer patients and healthy controls.
Anti-HSPs
Methods Sample size AAb frequency % p-value Reference
Cases HC Cases HC Anti-HSPB1 ELISA 579 53 37.8% 1.9% p<0.001 [12] PM 50 26 8% 0 0.049* Our study Anti-HSPD1 WB 40 42 47.5% 4.7% p<0.01 [14] ELISA 107 93 31.8% 4.3% p<0.0001 [15] PM 50 26 14% 3.8% 0.01** Our study Anti-HSP70 ELISA 369 53 40.9% 35.9% N/A [12] PM 50 26 34% 0 0.002** Our study Anti-HSP90
ELISA 125 N/A 36.8% N/A N/A [13]
ELISA 13 22 7.7% N/A N/A [16]
PM 50 26 4% 0 0.002** Our study
HC: healthy controls; ELISA: enzyme linked immunosorbent assay; PM: protein microarray; WB: western blot; N/A: not available; * Results obtained on chitosan surface, ** Results obtained on COOH surface.
As can be seen, differences in the frequency of anti-HSP autoantibodies in breast cancer patients and in healthy controls were obtained and can be explained by: i) the size and origin of the cohort: among researches, cohorts vary from 13 to 579 patients [12, 16]. ii) the definition of the cut-off value, defined as a value greater than the mean of the healthy individuals plus two standard deviations [15], or mean plus three standard deviations [13]. Generally, lower cut-off value result in higher sensitivity and lower specificity, and vice versa. iii) the tumor stage: some studies [12, 14, 15] provide detailed characteristic about breast cancer patients, like histologic stage, lymph node status, etc; while others didn’t provide any information [16, 40]. The choice of patients’ sera will influence the frequency of autoantibodies. iv) the study methods: western blot [14], ELISA and antigen microarray (present study) are used. In order to eliminate unnecessary discrepancy, methods for data normalization and data analysis such as the establishment of cut-off value, are required.
Furthermore, due to the heterogeneity of tumor and individual immune response, detection of one single autoantibody cannot provide efficient analysis for cancer diagnosis, while combining a panel of autoantibodies can greatly increase diagnosis sensitivity. Our results showed that the combination of 7 autoantibodies achieved good sensitivity as well as reasonable high specificity, which is comparable with other studies obtained through ELISA [41-44]. Moreover, compared to ELISA, our customized antigen microarray is capable of providing high throughput data by consuming smaller sample amounts.
Conclusions
In this study, we have demonstrated that customized protein microarrays could be powerful tools for the rapid screening of cancer biomarkers. The performance of protein microarray is influenced by many parameters such as surface chemistry, spotting buffer and protein concentration. 6 different surface chemistries were evaluated for the immobilization of 7 proteins belonging to the heat shock protein family and one oncoprotein, P53 in various conditions. To retain biological activity of the immobilized antigen protein, the best condition (surface chemistry and spotting concentration of antigens) were determined to implement miniaturized immunoassays. Two surface chemistries (COOH and chitosan) were selected and used to detect anti-tumor antigen autoantibodies in 50 breast cancer sera and 26 healthy donors’ sera. The detection of a single autoantibody didn’t allow to significantly discriminating breast cancer sera from healthy sera, whereas combining 7 autoantibodies
(autoantibodies against HSPB1, HSPD1, HSP70, HSP90, HSPA5, HSP90B1 and P53) increase the sensitivity and specificity of the test (with a sensitivity of 86% and a specificity of 100%). However, larger cohort of healthy donors and breast cancer patients are needed to validate its performance. As antigen microarray can screen thousands of biomarkers in a parallel and high throughput fashion, they are emerging as a powerful tool for cancer diagnosis in clinical assays.
Acknowledgements
China Scholarship Council is grateful to offer Ph.D. fellowship to Liu SHI. The CNANO Rho ne-Alpes and BQR Ecole Centrale de Lyon are acknowledged for financial support. NanoLyon is acknowledged for technical support.
Conflict of Interest
The authors declare no commercial or financial conflict of interest.
References
1. Radpour R, Barekati Z, Kohler C, Holzgreve W, Zhong XY (2009) New trends in molecular biomarker discovery for breast cancer. Genet Test Mol Biomarkers 13:565-571
2. Brooks M (2009) Breast cancer screening and biomarkers. Methods Mol Biol 472:307-321
3. Tan HT, Low J, Lim SG, Chung MC (2009) Serum autoantibodies as biomarkers for early cancer detection. Febs J 276:6880-6904
4. Etzioni R, Urban N, Ramsey S, McIntosh M, Schwartz S, Reid B, Radich J, Anderson G, Hartwell L (2003) The case for early detection. Nat Rev Cancer 3:243-252
5. Heo CK, Bahk YY, Cho EW (2012) Tumor-associated autoantibodies as diagnostic and prognostic biomarkers. BMB Rep 45:677-685
6. Chapman C, Murray A, Chakrabarti J, Thorpe A, Woolston C, Sahin U, Barnes A, Robertson J (2007) Autoantibodies in breast cancer: their use as an aid to early diagnosis. Ann Oncol 18:868-873
7. Misek DE, Kim EH (2011) Protein biomarkers for the early detection of breast cancer. Int J Proteomics:343582
8. Desmetz C, Mange A, Maudelonde T, Solassol J (2011) Autoantibody signatures: progress and perspectives for early cancer detection. J Cell Mol Med 15:2013-2024
9. Khalil AA, Kabapy NF, Deraz SF, Smith C (2011) Heat shock proteins in oncology: diagnostic biomarkers or therapeutic targets? Biochim Biophys Acta 1816:89-104
10. Ciocca DR, Calderwood SK (2005) Heat shock proteins in cancer: diagnostic, prognostic, predictive, and treatment implications. Cell Stress Chaperones 10:86-103
11. Conroy SE, Sasieni PD, Fentiman I, Latchman DS (1998) Autoantibodies to the 90kDa heat shock protein and poor survival in breast cancer patients. Eur J Cancer 34:942-943
12. Conroy SE, Sasieni PD, Amin V, Wang DY, Smith P, Fentiman IS, Latchman DS (1998) Antibodies to heat-shock protein 27 are associated with improved survival in patients with breast cancer. Br J Cancer 77:1875-1879
13. Conroy SE, Gibson SL, Brunstrom G, Isenberg D, Luqmani Y, Latchman DS (1995) Autoantibodies to 90 kD heat-shock protein in sera of breast cancer patients. Lancet 345:126
14. Hamrita B, Chahed K, Kabbage M, Guillier CL, Trimeche M, Chaieb A, Chouchane L (2008) Identification of tumor antigens that elicit a humoral immune response in breast cancer patients' sera by serological proteome analysis (SERPA). Clin Chim Acta 393:95-102
15. Desmetz C, Bibeau F, Boissiere F, Bellet V, Rouanet P, Maudelonde T, Mange A, Solassol J (2008) Proteomics-based identification of HSP60 as a tumor-associated antigen in early stage breast cancer and ductal carcinoma in situ. J Proteome Res 7:3830-3837
16. Luo LY, Herrera I, Soosaipillai A, Diamandis EP (2002) Identification of heat shock protein 90 and other proteins as tumour antigens by serological screening of an ovarian carcinoma expression library. Br J Cancer 87:339-343
17. Desmetz C, Bascoul-Mollevi C, Rochaix P, Lamy PJ, Kramar A, Rouanet P, Maudelonde T, Mange A, Solassol J (2009) Identification of a new panel of serum autoantibodies associated with the presence of in situ carcinoma of the breast in younger women. Clin Cancer Res 15:4733-4741
18. Sutandy FX, Qian J, Chen CS, Zhu H (2013) Overview of protein microarrays. Curr Protoc Protein Sci Chapter 27
Analyst 139:528-542
20. Hu S, Xie Z, Qian J, Blackshaw S, Zhu H (2012) Functional protein microarray technology. Wiley Interdiscip Rev Syst Biol Med 3:255-268
21. Balboni I, Limb C, Tenenbaum JD, Utz PJ (2008) Evaluation of microarray surfaces and arraying parameters for autoantibody profiling. Proteomics 8:3443-3449
22. Seurynck-Servoss SL, Baird CL, Rodland KD, Zangar RC (2007) Surface chemistries for antibody microarrays. Front Biosci 12:3956-3964
23. Kusnezow W, Hoheisel JD (2003) Solid supports for microarray immunoassays. J Mol Recognit 16:165-176
24. Zhu H, Snyder M (2003) Protein chip technology. Curr Opin Chem Biol 7:55-63
25. Cretich M, Damin F, Pirri G, Chiari M (2006) Protein and peptide arrays: recent trends and new directions. Biomol Eng 23:77-88
26. Jonkheijm P, Weinrich D, Schroder H, Niemeyer CM, Waldmann H (2008) Chemical strategies for generating protein biochips. Angew Chem Int Ed Engl 47:9618-9647
27. Rusmini F, Zhong Z, Feijen J (2007) Protein immobilization strategies for protein biochips. Biomacromolecules 8:1775-1789
28. Yang Z, Chevolot Y, Ataman-Önal Y, Choquet-Kastylevsky G, Souteyrand E, Laurenceau E (2012) Cancer biomarkers detection using 3D microstructured protein chip: Implementation of customized multiplex immunoassay. Sensors and Actuators B: Chemical 175:22-28
29. Yang Z, Chevolot Y, Gehin T, Solassol J, Mange A, Souteyrand E, Laurenceau E (2013) Improvement of protein immobilization for the elaboration of tumor-associated antigen microarrays: application to the sensitive and specific detection of tumor markers from breast cancer sera. Biosens Bioelectron 40:385-392 30. Kramar A, Faraggi D, Fortune A, Reiser B (2001) mROC: a computer program for combining tumour
markers in predicting disease states. Comput Methods Programs Biomed 66:199-207 31. Lindquist S (1986) The heat-shock response. Annu Rev Biochem 55:1151-1191
32. Ellis RJ, Hartl FU (1999) Principles of protein folding in the cellular environment. Curr Opin Struct Biol 9:102-110
33. Yang Z, Chevolot Y, Géhin T, Dugas V, Xanthopoulos N, Laporte V, Delair T, Ataman-Önal Y, Choquet-Kastylevsky G, Souteyrand E, Laurenceau E (2013) Characterization of three amino-functionalized surfaces and evaluation of antibody immobilization for the multiplex detection of tumor markers involved in colorectal cancer. Langmuir 29:1498-1509
34. Kim J, Shin D, Chung W, Jang K, Lee K, Kim Y, Lee Y (2004) Effects of polymer grafting on a glass surface for protein chip applications. Colloids and Surfaces B: Biointerfaces 33:67-75
35. El Khoury G, Laurenceau E, Chevolot Y, Mérieux Y, Desbos A, Fabien N, Rigal D, Souteyrand E, Cloarec JP (2010) Development of miniaturized immunoassay: influence of surface chemistry and comparison with enzyme-linked immunosorbent assay and Western blot. Anal Biochem 400:10-18
36. Seurynck-Servoss SL, White AM, Baird CL, Rodland KD, Zangar RC (2007) Evaluation of surface chemistries for antibody microarrays. Anal Biochem 371:105-15
37. Kusnezow W, Jacob A, Walijew A, Diehl F, Hoheisel JD (2003) Antibody microarrays: an evaluation of production parameters. Proteomics 3:254-264
38. Balboni I, Limb C, Tenenbaum JD, Utz PJ (2008) Evaluation of microarray surfaces and arraying parameters for autoantibody profiling. Proteomics 8:3443-3449
39. Fan J, Upadhye S, Worster A (2006) Understanding receiver operating characteristic (ROC) curves. Cjem 8:19-20
40. He Y, Wu Y, Mou Z, Li W, Zou L, Fu T, Zhang A, Xiang D, Xiao H, Wang X (2007) Proteomics-based identification of HSP60 as a tumor-associated antigen in colorectal cancer. Proteomics Clin Appl 1:336-342 41. Anderson KS, Sibani S, Wallstrom G, Qiu J, Mendoza EA, Raphael J, Hainsworth E, Montor WR, Wong J, Park JG, Lokko N, Logvinenko T, Ramachandran N, Godwin AK, Marks J, Engstrom P, Labaer J (2011) Protein microarray signature of autoantibody biomarkers for the early detection of breast cancer. J Proteome Res 10:85-96
42. Liu W, Wang P, Li Z, Xu W, Dai L, Wang K, Zhang J (2009) Evaluation of tumour-associated antigen (TAA) miniarray in immunodiagnosis of colon cancer. Scand J Immunol 69:57-63
43. Li J, Wang LJ, Ying X, Han SX, Bai E, Zhang Y, Zhu Q (2012) Immunodiagnostic value of combined detection of autoantibodies to tumor-associated antigens as biomarkers in pancreatic cancer. Scand J Immunol 75:342-349
44. Dai L, Ren P, Liu M, Imai H, Tan EM, Zhang JY (2014) Using immunomic approach to enhance tumor-associated autoantibody detection in diagnosis of hepatocellular carcinoma. Clin Immunol 152:127-139 Anti-HSP profiling in breast cancer using protein microarray