HAL Id: hal-00301479
https://hal.archives-ouvertes.fr/hal-00301479
Submitted on 22 Oct 2004HAL is a multi-disciplinary open access
archive for the deposit and dissemination of sci-entific research documents, whether they are pub-lished or not. The documents may come from teaching and research institutions in France or abroad, or from public or private research centers.
L’archive ouverte pluridisciplinaire HAL, est destinée au dépôt et à la diffusion de documents scientifiques de niveau recherche, publiés ou non, émanant des établissements d’enseignement et de recherche français ou étrangers, des laboratoires publics ou privés.
Climatological features of stratospheric streamers in the
FUB-CMAM with increased horizontal resolution
K. Krüger, U. Langematz, J. L. Grenfell, K. Labitzke
To cite this version:
K. Krüger, U. Langematz, J. L. Grenfell, K. Labitzke. Climatological features of stratospheric stream-ers in the FUB-CMAM with increased horizontal resolution. Atmospheric Chemistry and Physics Discussions, European Geosciences Union, 2004, 4 (5), pp.6789-6822. �hal-00301479�
ACPD
4, 6789–6822, 2004 Climatological features of stratospheric streamers in the FUB-CMAM K. Kr ¨uger et al. Title Page Abstract Introduction Conclusions References Tables Figures J I J I Back CloseFull Screen / Esc
Print Version
Interactive Discussion
Atmos. Chem. Phys. Discuss., 4, 6789–6822, 2004 www.atmos-chem-phys.org/acpd/4/6789/
SRef-ID: 1680-7375/acpd/2004-4-6789 © European Geosciences Union 2004
Atmospheric Chemistry and Physics Discussions
Climatological features of stratospheric
streamers in the FUB-CMAM with
increased horizontal resolution
K. Kr ¨uger1, *, U. Langematz1, J. L. Grenfell1, and K. Labitzke1
1
Institut f ¨ur Meteorologie, Freie Universit ¨at Berlin, Germany *
now at: Alfred Wegener Institute for Polar and Marine Research, Potsdam, Germany
Received: 8 September 2004 – Accepted: 17 September 2004 – Published: 22 October 2004 Correspondence to: K. Kr ¨uger (kkrueger@awi-potsdam.de)
ACPD
4, 6789–6822, 2004 Climatological features of stratospheric streamers in the FUB-CMAM K. Kr ¨uger et al. Title Page Abstract Introduction Conclusions References Tables Figures J I J I Back CloseFull Screen / Esc
Print Version
Interactive Discussion
Abstract
The purpose of this study is to investigate horizontal transport processes in the winter stratosphere using data with a high spatial and temporal resolution. For this reason the Freie Universit ¨at Berlin Climate Middle Atmosphere Model (FUB-CMAM) with its model top at 83 km altitude, increased horizontal resolution T42 and the semi-Lagrangian
5
transport scheme for advecting passive tracers is used.
A new result of this paper is the classification of specific transport phenomena within the stratosphere into tropical-subtropical streamer (e.g. Offermann et al., 1999) and polar vortex extrusions hereafter called polar vortex streamers. To investigate the role played by these large-scale structures on the inter-annual and seasonal variability of
10
the observed negative ozone trend in northern mid-latitudes, the global occurrence of such streamers were calculated based on a 10-year model climatology, concen-trating on the existence of the Arctic polar vortex. For the identification and counting of streamers, the new method of zonal anomaly was chosen, which in comparison to other methods produced the best result in this study. The analysis of the months
15
October-May yielded a maximum occurrence of tropical-subtropical streamers during Arctic winter and spring in the middle and upper stratosphere. Synoptic maps revealed highest intensities in the subtropics over East Asia with a secondary maximum over the Atlantic in the northern hemisphere. Furthermore, tropical-subtropical streamers exhibited about a four times higher occurrence than polar vortex streamers, indicating
20
that the subtropical barrier is more permeable than the polar vortex barrier (edge) in the model, which is in good correspondence with observations (e.g. Plumb, 2002; Neu et al., 2003). Interesting for the total ozone loss in mid-latitudes is the consideration of the lower stratosphere, where strongest ozone depletion is observed at polar latitudes (WMO, 2003). In this particular region the FUB-CMAM simulated a climatological
max-25
imum of 10% occurrence of tropical-subtropical streamers over East-Asia/West Pacific and the Atlantic during early- and mid-winter.
ACPD
4, 6789–6822, 2004 Climatological features of stratospheric streamers in the FUB-CMAM K. Kr ¨uger et al. Title Page Abstract Introduction Conclusions References Tables Figures J I J I Back CloseFull Screen / Esc
Print Version
Interactive Discussion
streamers e.g., large-scale mixing processes of tropical-subtropical and polar vortex air masses into mid-latitudes, could play a significant role on the strength and variability of the observed total ozone decrease at mid-latitudes and should not be neglected in future climate change studies.
1. Introduction
5
In recent years the role of mid-latitude ozone has increasingly captured public interest as a substantial decrease of total ozone is not only observed over the winter poles but also at mid-latitudes especially over the northern hemisphere (NH). Maximum ozone loss of up to −6% in winter and up to −12% in spring occurred over NH mid-latitudes during the early to mid 1990s (Fioletov et al., 2002; WMO, 2003). Besides the
funda-10
mental chemical processes involved, transport is an important factor in determining the global distribution of atmospheric trace gases, such as ozone.
The overall global transport of trace gases is mainly driven by the mean meridional circulation (MMC) caused by the breaking of planetary and gravity waves in the extrat-ropical stratosphere/ mesosphere, the so-called “wave driving” or “extratextrat-ropical pump”
15
(Haynes, 1991; Plumb, 1996). A recent overview of the MMC, also called the Brewer-Dobson circulation (BDC) after its main observational discovers Brewer (1949) and Dobson (1956), is given by Plumb (2002).
A quasi isolation of the tropics was first postulated by Plumb (1996) with the concept of the “tropical pipe” model and was proven by the detection of the “tape recorder”
20
signature in the annual cycle of water vapor measurements in the tropical tropopause region (Mote et al., 1996). Both studies led to the conclusion that the subtropics act as a kind of transport barrier between the tropical and mid-latitudinal regions. Due to the breaking of planetary waves in mid-latitudes, a zone of well-mixed trace gases is built-up with weak gradients in concentrations, the so called “surf zone” (McIntyre
25
and Palmer, 1983, 1984). On the poleward side of the surf zone, the polar vortex edge acts as a strongly confined transport barrier between the well-mixed surf zone
ACPD
4, 6789–6822, 2004 Climatological features of stratospheric streamers in the FUB-CMAM K. Kr ¨uger et al. Title Page Abstract Introduction Conclusions References Tables Figures J I J I Back CloseFull Screen / Esc
Print Version
Interactive Discussion
and the air within the polar vortex. Rising evidence of a possible two way transport through the subtropical barrier was found in observational and modeling studies, a recent overview of this now called “leaky pipe” model is given by e.g. Plumb (2002). A more comprehensive picture of specific transport processes at the edge and inside the polar vortex was also summarized by that author. More over, horizontal mixing
5
processes through the transport barriers, either by smaller-scale (finger-like) structures (filaments/laminae) or by large-scale (tongue-like) structures (streamers), are thought to play a significant role and are subject of the present paper.
Observational evidence of narrow tongues of tropical air transported into mid-latitudes in the middle stratosphere was shown with low resolution satellite
measure-10
ments (Leovy et al., 1985; Randel et al., 1993, Manney et al., 1993; Trepte et al., 1993). Rossby wave breaking events at the edge of the tropics and a shift of the po-lar vortex towards lower latitudes seem to be linked with tropical air extrusions into mid-latitudes (Chen et al., 1994; Waugh, 1996). On reaching higher latitudes, these tongues of tropical air are stretched into filaments which are wrapped around the edge
15
of the polar night jet (Waugh, 1993). In the present study, the above described phe-nomena of large-scale, tongue-like features of tropical-subtropical air masses within the stratosphere are called “tropical-subtropical streamers” (Offermann et al., 1999).
Large extrusions of polar vortex air into mid-latitudes in the middle stratosphere were first detected by McIntyre and Palmer (1983, 1984). The authors described the
phe-20
nomena as big “blobs” of potential vorticity (PV), transporting high-latitude air masses equatorward. Due to the breaking of planetary waves at the edge of the polar vortex, these air masses are irreversibly mixed within the surf zone. Whether such large-scale blobs were real or an artifact of the reduced horizontal resolution of the analysed PV fields, was left open for discussion by the authors. In the present work, polar vortex
25
extrusions in the form of blobs of PV or tail-like structures of passive tracers are termed “polar vortex streamers”.
High temporal and spatial resolution of the CRyogenic Infrared Spectrometers and Telescopes for the Atmosphere (CRISTA) instrument on board the space shuttle, has
ACPD
4, 6789–6822, 2004 Climatological features of stratospheric streamers in the FUB-CMAM K. Kr ¨uger et al. Title Page Abstract Introduction Conclusions References Tables Figures J I J I Back CloseFull Screen / Esc
Print Version
Interactive Discussion
shed more light into the detection of both large-scale and smaller-scale transport phe-nomena (Offermann et al., 1999; Riese et al., 1999). During the one week mission in November 1994, CRISTA measured broad, large-scale, tongue-like features of tropi-cal and polar vortex air extrusions in the middle stratosphere. On the same platform independent measurements were carried out with the ATmospheric Trace Molecule
5
Spectroscopy (ATMOS) instrument (Manney et al., 2000), supporting the findings of CRISTA. By comparing these measurements with satellite observations and fine scale trajectory calculations, tongue-like phenomena were detected in various trace gases, e.g. CH4, O3, NOx, in the stratosphere in addition to filament like structures (Manney et al., 2000, 2001).
10
First evidence of thin, filament-like structures in ozonesonde profiles was given by Brewer and Milford (1960). Such structures are called laminae in vertical space (Dob-son, 1973) and filaments in the horizontal plane. These phenomena were observed to have a small vertical extension from 200 m to 2.5 km and to vary between several hun-dred to a thousand kilometers in horizontal space (Dobson, 1973; Reid and Vaughan,
15
1991; Reid et al., 1993). Using regular ozonesonde ascents into the stratosphere since the 1960s, these authors found that such phenomena maximize between 12 and 18 km altitude range at high latitudes during the winter and spring seasons. They are thought to be mainly excited through differential advection in regions of strong horizontal and vertical wind gradients, e.g. in regions of strong jets (Appenzeller and Holton, 1997).
20
The inter-annual, seasonal and long-term variability of laminae has been addressed by many observational studies (e.g. Reid and Vaughan, 1991; Reid et al., 1993, 1998; Appenzeller and Holton, 1997; Manney et al., 1998; Orsolini and Grant, 2000; Wahl, 2002). Strong gradients in the large-scale winds can lead to a layering of the lami-nae which results in a filament-like structure in the horizontal plane. Filaments were
25
mainly observed at the edge of the polar vortex indicating horizontal mixing processes through the polar vortex barrier in both directions. High resolution transport studies, using contour advection techniques or similar methods, showed the effect of simulating ultra-thin filaments with the use of large-scale winds (e.g. Norton, 1994; Waugh and
ACPD
4, 6789–6822, 2004 Climatological features of stratospheric streamers in the FUB-CMAM K. Kr ¨uger et al. Title Page Abstract Introduction Conclusions References Tables Figures J I J I Back CloseFull Screen / Esc
Print Version
Interactive Discussion
Plumb, 1994; Chen, 1994). Waugh et al. (1994) and Plumb et al. (1994) demonstrated that these ultra-thin filaments of polar vortex extrusions and intrusions were realistic features, comparing them with in-situ aircraft measurements. A regular occurrence of filaments of polar vortex extrusions is thought to play a significant role in the observed total ozone decrease in mid-latitudes (Norton and Chipperfield, 1995; Knudsen and
5
Grooß, 2001; Marchand et al., 2003; Millard et al., 2003). However, none of these model studies have taken broad, large-scale, tongue-like structures into account.
Large-scale, tongue-like features or stratospheric streamers were successfully simu-lated with comprehensive models (Mahlmann and Umscheid, 1987; Boville et al., 1991; Rood et al., 1992; Orsolini et al., 1995; Kouker et al., 1999; Steil et al., 2003). A first
10
climatology of streamers was derived with the mechanistic model KArlsruher SImula-tion of the Middle Atmosphere (KASIMA) using analyzed winds for the winters 1990 to 1998 (Langbein et al., 2001). This “assimilated” streamer climatology was compared by Eyring et al. (2003) with simulations from the coupled chemistry-climate model ECHAM4.L39(DLR)/CHEM (E39/C). In general a good correspondence between the
15
two was found, when applying the same streamer criterion. However, those authors investigated solely the transport of tropical air into higher latitudes, restricting their in-tercomparison to the lower stratosphere (21–25 km altitude).
The purpose of this model study is to investigate the possible role of air mass ex-change by stratospheric streamers through both transport barriers – the subtropics and
20
the polar vortex edge – during Arctic winter. In addition to previous studies, two types of streamers are investigated, tropical-subtropical streamers and polar vortex streamers, using a full climate middle atmosphere model including the whole branch of the BDC.
The paper is organized in the following way: a brief description of the model and the method to identify streamers is given in Sect. 2. The simulation of streamers is
25
presented in a case study in Sect. 3. The inter-annual and seasonal distribution of streamers is investigated based on a 10-year model climatology in Sect. 4. The model results are discussed in Sect. 5. Finally, the results are summarized (Sect. 6).
ACPD
4, 6789–6822, 2004 Climatological features of stratospheric streamers in the FUB-CMAM K. Kr ¨uger et al. Title Page Abstract Introduction Conclusions References Tables Figures J I J I Back CloseFull Screen / Esc
Print Version
Interactive Discussion
2. Model description and method
2.1. Model
For the streamer study the Freie Universit ¨at Berlin Climate Middle Atmosphere Model (FUB-CMAM) with increased horizontal resolution and a semi-Lagrangian transport scheme for advecting tracers is used. The FUB-CMAM is a general circulation model
5
(GCM), run in the standard version with spectral horizontal resolution of T21 (5.6◦×5.6◦) and 34 layers in the vertical with a model top at ∼83 km (0.0068 hPa) altitude and a vertical grid spacing of 3.5 km in the middle atmosphere. A detailed description of the physical parameterizations is given by Pawson (1998) and the new model configuration is described by Langematz (2000). For the purpose of this study, the horizontal
reso-10
lution was increased to T42 (2.8◦×2.8◦), resulting in a grid mesh distance of ∼300 km at the equator. Necessary changes in the model code are described in more detail in Kr ¨uger (2002). To guarantee numerical stability in the upper levels the model time step was increased from 15 to 10 min integration.
2.1.1. Tracer advection
15
In order to study the transport of trace gases, the FUB-CMAM was coupled with a semi-Lagrangian transport (SLT) scheme with modified exponential splines (Boettcher, 1996; Braesicke and Langematz, 1998; Kr ¨uger, 2002). The SLT scheme was run with a transport time step of 4 h and was thus less computer time consuming than Lagrangian schemes. The SLT scheme was used on the same horizontal grid of 2.8◦×2.8◦as the
20
model physics and on a vertical grid of 2.4 km equidistant layers throughout the model atmosphere. An idealized passive, zonally stratified tracer was advected with zonally homogeneous concentrations. The concentration starts with zero at the South Pole and increases up to 180 arbitrary units (au) at the North Pole, with no changes in the vertical. This tracer has no sources and sinks in the model. Due to the limited
25
ACPD
4, 6789–6822, 2004 Climatological features of stratospheric streamers in the FUB-CMAM K. Kr ¨uger et al. Title Page Abstract Introduction Conclusions References Tables Figures J I J I Back CloseFull Screen / Esc
Print Version
Interactive Discussion
advected until the end of May, covering the dynamical active period in the northern winter stratosphere.
2.1.2. Model integration
A T42 model run with seasonal variation in solar insolation and prescribed climatologi-cal sea surface temperatures (SSTs) has been carried out. After two years of
initializa-5
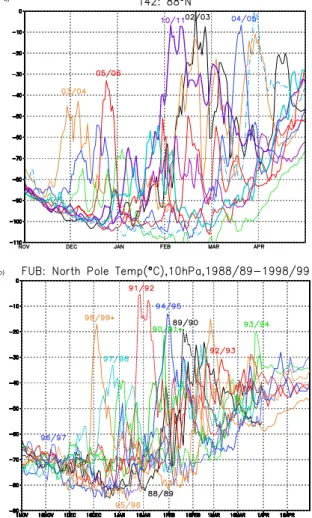
tion, the model was run for 10 years. Time series of the temperature for the grid box closest to the North Pole during Arctic winters and spring are shown in Fig.1a for the middle stratosphere. A large year-to-year variability in winter is simulated solely due to the models’ own internal mode of variability. No solar variability, quasi-biennial os-cillation (QBO) or volcanic eruptions have been taken into account in the experiment.
10
The simulated strength of variability is comparable to observed variations during the 1990s, shown here for the FUB observational data (Fig.1b). For a description of the FUB analysis see e.g. Naujokat et al. (2002). In contrast to the former T21 model simulations the inter-annual variability has increased. However, the cold pole bias, a familiar feature of GCMs (Pawson et al., 2000), is enhanced compared to observations,
15
apparent in the very low temperature of less than −100◦C during mid and late winter in selected years. A detailed analysis, comparing the T42- with former T21-model runs, revealed a stronger planetary wave activity but a steady wave mean flow interaction in the T42 simulation (Kr ¨uger, 2002). During the 10-year integration two major mid-winter warmings are simulated with a break-down of the polar vortex and a reversal of the
20
zonal mean wind in 60◦N (not shown) in the Arctic winters 02/03 and 10/11 (Fig.1a). 2.2. Streamer criterion
2.2.1. The zonal anomaly method
To identify the location and the shape of streamers in the model, an objective criterion called the zonal anomaly method was developed. Using daily data, the difference in
ACPD
4, 6789–6822, 2004 Climatological features of stratospheric streamers in the FUB-CMAM K. Kr ¨uger et al. Title Page Abstract Introduction Conclusions References Tables Figures J I J I Back CloseFull Screen / Esc
Print Version
Interactive Discussion
the concentration at each grid point and the zonal mean of the passive tracer is calcu-lated to derive the zonal anomaly field. Different criteria have been tested: the zonal anomaly (this study), the meridional gradient (Eyring et al., 2003) and the vertical gra-dient methods (e.g. Orsolini and Grant, 2000; Langbein et al., 2001). For the design of this experiment, use of the zonal anomaly method provided the most convincing
re-5
sults in detecting the horizontal shape of the streamers realistically without any shift in location (see Sect. 3.3). Analyzing the zonal anomaly, a threshold value is defined to identify and count a streamer event. According to the increasing tracer concentra-tion from the South to the North Pole, a positive zonal deviaconcentra-tion in the NH indicates high latitude air mixed into lower latitudes, and a negative deviation marks low-latitude
10
air mixed into higher latitudes. In the SH the deviation changes sign for both mixing cases. Different threshold values were tested, varying from ±15 au to ±25 au. Finally, anomalies of+20 au and more were chosen to identify polar vortex streamers and of −20 au and less to identify tropical-subtropical streamers in the NH. The occurrence of streamers per day at 12:00 UTC and per grid point is counted using this new
algo-15
rithm. The purpose of this study is to count the total amount of time and location when streamers are present, not the total number of streamer developments. Therefore, the distributions are normalized, resulting in relative frequency of streamers (1.0 ˆ=100%, 0.0 ˆ=0% per time occurrence). The climatology will concentrate on the period October to May and on stratospheric levels. An altitude range from 15–40 km is chosen,
sub-20
divided into 5 equal layers, each containing 2 vertical transport levels, from 16–20 km, 21–25 km, 26–30 km, 31–35 km and 36–40 km altitude.
3. Case study
In this case study the ability of the FUB-CMAM to simulate stratospheric streamers is presented. The objective criterion to identify and count streamers will be demonstrated
25
ACPD
4, 6789–6822, 2004 Climatological features of stratospheric streamers in the FUB-CMAM K. Kr ¨uger et al. Title Page Abstract Introduction Conclusions References Tables Figures J I J I Back CloseFull Screen / Esc
Print Version
Interactive Discussion
3.1. Synoptic situation
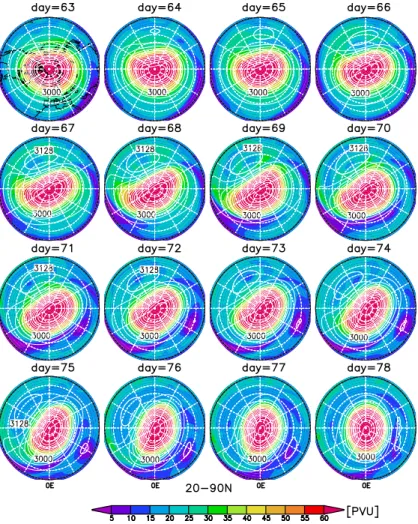
For this case study, a typical cold and undisturbed winter (year 11/12) was chosen (Fig.1a). Figure2shows the synoptic situation for the early winter period, using geopo-tential height (at 10 hPa) and PV (at 850 K) fields for the middle stratosphere. On day 63 (3 December), the centre of the cold vortex is directly situated over the North Pole.
5
One day later an Aleutian high begins to form. In the following days the anticyclone strengthens, pushing the vortex centre towards lower latitudes and leading to an elon-gated polar vortex with a zonal wave number-2 pattern. Around day 71, a second anticyclone develops over Eurasia, indicating a strengthening of wave number-2. Si-multaneously, the vortex begins to rotate eastward, indicating a transient, dynamically
10
active period. The cold air is confined within the polar vortex (not shown here). This dynamical situation can be categorized as a typical “cold wave 2” behaviour, defined after Labitzke (1977) and does usually not culminate in a break-down of the polar vor-tex, i.e. a major midwinter warming. Indeed these wave number-2 disturbances persist after day 78.
15
Concerning transport processes in the stratosphere, PV on an isentropic level can be regarded to be a quasi-conserved quantity up to 5 days, behaving as a passive tracer. The PV field shows the development of tongues of tropical air over the Atlantic from days 67 to 78 and over East Asia from days 63 to 74. Extrusions of polar vortex air can be seen over the USA on days 69–70 and over the Atlantic on days 76–77,
20
which seem to drop out of the polar vortex in the form of blobs, a couple of days later travel to the tropical belt as was described by McIntyre and Palmer (1983, 1984).
3.2. Simulation of streamers
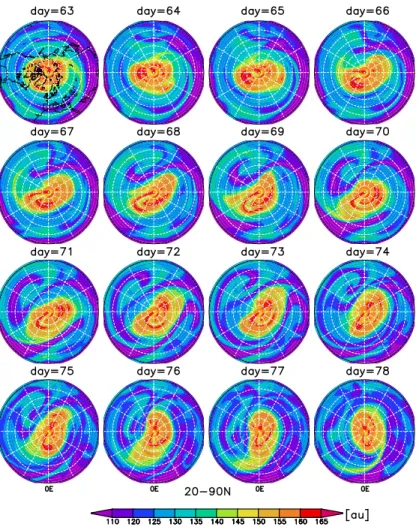
For the same sequence, the passive tracer is shown in Fig.3 at 32 km altitude. One striking difference to the PV is, that the passive tracer shows a much more differential
25
picture in its evolution. Finer transport structures are conserved in the passive tracer field during the presented period. As can be seen over the West Atlantic, air masses
ACPD
4, 6789–6822, 2004 Climatological features of stratospheric streamers in the FUB-CMAM K. Kr ¨uger et al. Title Page Abstract Introduction Conclusions References Tables Figures J I J I Back CloseFull Screen / Esc
Print Version
Interactive Discussion
of tropical-subtropical origin are pulled out by the large-scale winds and are advected northeastward over the Atlantic towards Europe (day 67–70). This tongue of tropical air can be identified as an “Atlantic streamer” as defined by Offermann et al. (1999). After day 70 the streamer is advected further northeastward, close towards the edge of the polar vortex, here taken to be the region of maximum gradient in wind speed.
5
There, the streamer is getting longer and thinner by differential advection as was also observed during the first CRISTA experiment. Finally, (after day 72) this “streamer-filament system” begins to roll-up into a cat eye (McIntyre and Palmer, 1983, 1984) over Eurasia. A simultaneous tropical-subtropical streamer event is visible over East Asia (day 63–74), called an “East Asian streamer” (Offermann et al., 1999), and is
10
also rolling up into a cat eye over the Pacific. These structures were connected with the development of anticyclones over the Pacific and over Eurasia (see Fig. 2). On days 63, 66, 70 and 78 the evolution of polar vortex streamers is visible, which seem to be connected with the development of tropical-subtropical streamers, as was also observed by CRISTA. Both types of streamers, namely tropical-subtropical and polar
15
vortex, are found to have a width between 500 to 2000 km and a length of more than 10 000–20 000 km during the developmental stage. They span a whole latitudinal belt (e.g. the East Asian streamer at day 75). Their duration is between 1–3 weeks and they decay in 1–2 weeks in the model simulations. From this case study, it can be concluded that the main features of the simulated streamers are comparable to those
20
observed during the space shuttle mission in November 1994 (Offermann et al., 1999; Manney et al., 2000, 2001).
3.3. Streamer criterion
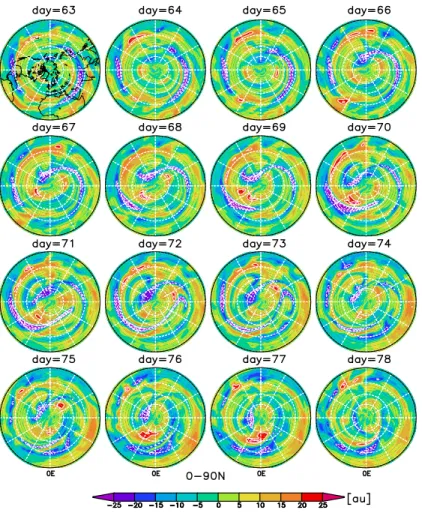
Figure4 shows the zonal anomaly field with the threshold criteria marked as contour lines for the same time sequence as for Fig.3. A very good correspondence can be
re-25
alized between the subjective counting by visible inspection of Fig.3and the objective method by using the zonal anomaly criterion to identify streamers (Fig.5). During the selected winter period the polar vortex was very cold and strong but still dynamically
ACPD
4, 6789–6822, 2004 Climatological features of stratospheric streamers in the FUB-CMAM K. Kr ¨uger et al. Title Page Abstract Introduction Conclusions References Tables Figures J I J I Back CloseFull Screen / Esc
Print Version
Interactive Discussion
active. For quiet a long period, the polar vortex was shifted off the pole towards lower latitudes, as can be seen in Fig. 2. This dynamical behaviour results in the regular development of tropical air extrusions shown in Fig.5. Two pathways are visible for tropical-subtropical streamers, one from the Caribbean Sea over the Atlantic reach-ing towards Europe/Asia and a second extendreach-ing from Asia over the Pacific towards
5
Alaska, reaching higher latitudes (up to 70◦N) than the Atlantic streamer. Maximum in-tensities of tropical-subtropical streamers, with more than 0.5 relative frequency which corresponds to 50% occurrence in time, are found over the Al ¨eutian Islands. This re-sult is not affected qualitatively when changing the threshold number by 25% (±5 au). During this case study, polar vortex streamers only occur for a quarter of the time of the
10
tropical-subtropical streamers. High intensities with 0.15 relative frequency are found over the Atlantic region at mid to high latitudes. The zonally stretched maximum over the tropical Pacific is due to a local strong gradient in the zonal anomaly field, seen in Fig.4on days 63–67 and 71–78, which is not connected to a streamer development. For a more detailed discussion of possible method deficiencies see section 5.
15
4. Streamer climatology
In this section the zonal anomaly criterion will be used to investigate the occurrence of stratospheric streamers during 10 model years. The main emphasize will be placed on the inter-annual and seasonal variability of such phenomena in the northern winter stratosphere.
20
4.1. Inter-annual and seasonal variability
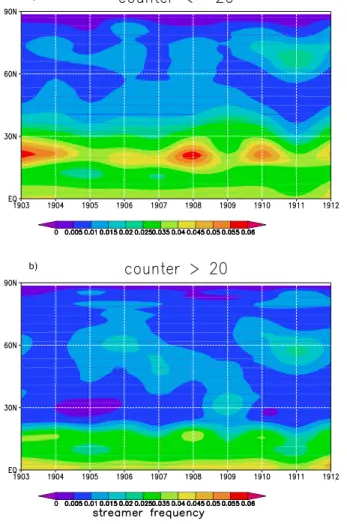
Figure 6 shows the inter-annual variability for (a) tropical-subtropical (counter <−20) and (b) polar vortex streamers (counter >20) in the NH for 10 years. The frequen-cies are averaged for the October to May period and over the 15–40 km altitude range. In every winter, a maximum occurs in the subtropics at 25◦N with intensities varying
ACPD
4, 6789–6822, 2004 Climatological features of stratospheric streamers in the FUB-CMAM K. Kr ¨uger et al. Title Page Abstract Introduction Conclusions References Tables Figures J I J I Back CloseFull Screen / Esc
Print Version
Interactive Discussion
from 3.5% to 6.0% per winter mean. In some of the winters the maximum in the sub-tropics occurs towards higher latitudes around 70–75◦N (e.g. model years 4, 6, 8, 10 and 11), which seem to be associated with tropical-subtropical streamers being ad-vected towards higher latitudes. The absolute maximum of these signals is reached in year 11 (corresponding to winter 11/12) at 70◦N, which shows an anomalously high
5
occurrence of tropical air masses at polar latitudes (see Sect. 3). In the same win-ter, an absolute maximum was also found for polar vortex streamer occurrences 10◦ southward (Fig.6b). In general polar vortex streamers occur less frequently; maximum intensities from 1.5% to 2.0% are reached at 60◦N during year 6 and 11. In model year 9, an extra-tropical air intrusion into the subtropics has taken place, indicating
10
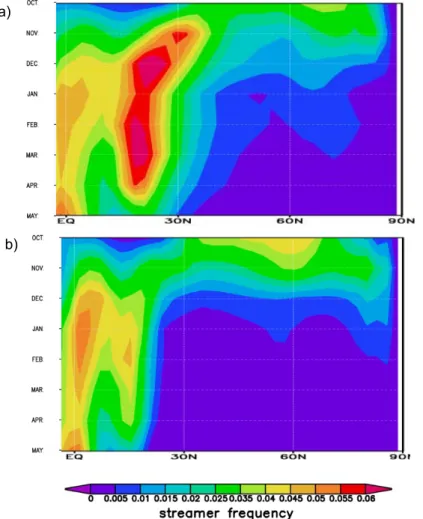
the existence of a leaky subtropical barrier in the FUB-CMAM. The seasonal evolution of streamers during northern winter is shown with zonal averages over the 15–40 km altitude range for each month in Fig.7. In the subtropics, the region of streamer de-velopment, maximum frequencies are found from December to April. The advection of tropical-subtropical streamers towards higher latitudes seems to be preferred from
15
October to February. Beginning in March, a minimum of streamer frequency is found at mid and high latitudes, indicating more quiescent dynamics due to the existence of easterly winds at polar latitudes (not shown here). The frequency of polar vortex streamers (Fig. 7, bottom) shows a maximum at 60◦N and at 85◦N from October to February. Both streamer types show a maximum frequency over the equator, due to
20
the high tropopause in the tropics at around 18 km altitude, indicating a two-way ex-change of air masses in the tropical tropopause region (e.g. Holton at el., 1995), which is not related to streamer events investigated here.
4.2. Vertical extension
For the vertical extension of streamers in the stratosphere, winter averages of zonal
25
and area mean frequencies of tropical-subtropical streamers are shown in Fig.8. The model climatology reveals maximum frequencies of 3% to 9% in the middle and upper stratosphere between 26 to 40 km altitude in the subtropics (Fig. 8a). A clear
occur-ACPD
4, 6789–6822, 2004 Climatological features of stratospheric streamers in the FUB-CMAM K. Kr ¨uger et al. Title Page Abstract Introduction Conclusions References Tables Figures J I J I Back CloseFull Screen / Esc
Print Version
Interactive Discussion
rence of streamers at higher altitudes in the stratosphere is demonstrated by this model study. The area means approach enables us to follow the development and existence stages of tropical-subtropical streamers (Fig.8b–e). There are two main regions where streamers are excited in the model, mainly over Asia and a secondary region over the West Atlantic. This is visible in the strongest maximum over the 0–90◦E sector, the
5
excitation region of East Asian streamers, and in a smaller maximum over the 0–90◦W sector illustrating a secondary excitation region of Atlantic streamers. After their excita-tion, tropical-subtropical streamers move progressive with the main flow and poleward. This can be seen by following the first maximum into the 90–180◦E and 90–180◦W sectors and the secondary maximum into the 0–90◦E sector, which then overlaps with
10
the excitation region of the East Asian streamers.
4.3. Synoptic maps
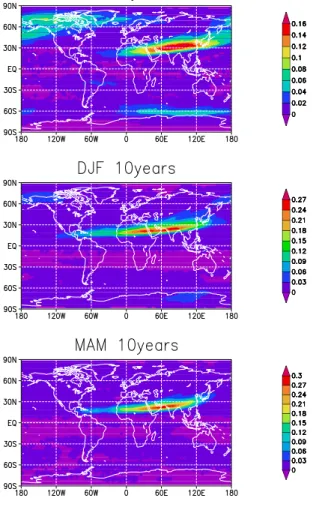
Figure 9 shows the synoptic maps for tropical-subtropical streamers averaged over the October-November (ON), December to February (DJF) and March to May (MAM) periods during the 10 model-years. Maximum frequencies from 0.27 to 0.30 occur
15
for tropical-subtropical streamers during winter and spring in the middle stratosphere (31–35 km mean). The band of high intensity extends from the Atlantic towards the Western Pacific for all three periods, containing also the secondary excitation region of the Atlantic streamers, as was visible in Fig.3. During ON a large region of high intensities is analysed at polar latitudes, reaching from the Al ¨eutian Islands towards
20
Greenland. This maximum might be artificial as no high has been established in that season in the model (not shown here). This behaviour may be associated with the the time of the year (1 October) or/and the method of initializing the passive tracer (zonally homogeneous), as it takes several days before the contours of the passive tracer has adapted to the dynamical field.
25
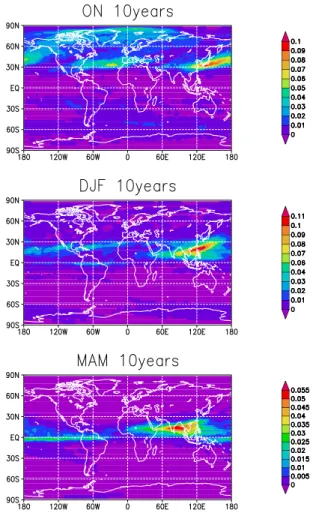
Interesting for ozone loss at mid-latitudes is the consideration of the lower strato-sphere, showing a direct influence of natural low-ozone air mass exchange into mid-latitudes. Figure 10b displays tropical-subtropical streamer frequencies for the lower
ACPD
4, 6789–6822, 2004 Climatological features of stratospheric streamers in the FUB-CMAM K. Kr ¨uger et al. Title Page Abstract Introduction Conclusions References Tables Figures J I J I Back CloseFull Screen / Esc
Print Version
Interactive Discussion
stratosphere averaged over 21–25 km altitude. In contrast to the middle stratosphere, maximum intensities occur during early- and mid-winter with only a third less appear-ance (11% during 10 years) compared with the middle stratosphere. In the lower strato-sphere, excitation regions lie over the central Atlantic and over East Asia, tilting west-ward with increasing height as is visible when comparing Fig.10with Fig.9, indicating
5
the role of planetary waves in these processes.
4.4. Comparison with observed tropical-subtropical streamer climatologies
The simulated strength of variability of e.g. the North Pole temperature in the strato-sphere during Arctic winter is comparable to the observed interannual variability during the 1990s (see Fig.1). Therefore, the streamer climatology of the T42-model is
com-10
pared to assimilated streamers from the 1990s, derived with the mechanistic model KASIMA (Langbein et al., 2001). Only tropical-subtropical streamers can be compared as no polar vortex streamers have been taken into account by those authors. In the present study, the maximum of tropical-subtropical streamer activity lies in the NH, whereas weak intensities are reached in the SH during October and November at mid
15
and high latitudes (Figs.9and 10). The comparison concentrates on the lower strato-sphere (21–25 km altitude) and on the latitude band between 20–70◦N/S, for which results from the KASIMA climatology were available. To identify streamers, the authors employed the vertical gradient method based on the zonal mean field of the N2O tracer. A streamer was counted, if the zonal mean at one layer reached more than 5%
devia-20
tion from the vertical profile. In good agreement with this study, Langbein et al. (2001) analysed maximum intensities over the Pacific/East Asia and over the Atlantic in the subtropics reaching towards mid-latitudes during winter and spring.
It should be noted however that the main characteristics of the streamer climatology strongly depend on the chosen method and the respective streamer criterion. Eyring
25
et al. (2003) analysed the same KASIMA data used by Langbein et al. (2001) with the meridional gradient method. Their results differ from Langbein et al. (2001) and other observational estimates (Offermann et al., 1999; Manney et al., 2000, 2001), as
ACPD
4, 6789–6822, 2004 Climatological features of stratospheric streamers in the FUB-CMAM K. Kr ¨uger et al. Title Page Abstract Introduction Conclusions References Tables Figures J I J I Back CloseFull Screen / Esc
Print Version
Interactive Discussion
maximum streamer intensities were analysed furter poleward over Central Europe and the Atlantic in mid-latitudes with a weak secondary maximum in the subtropics over East Asia during winter and spring.
The results of the present study are more comparable with results derived from the vertical gradient method used by Langbein et al. (2001) than with those derived from
5
the meridional gradient method (Eyring et al., 2003). More research has to be carried out, to determine the reasons for this is beyond the scope of this paper.
5. Discussion
The simulation of streamers in the FUB-CMAM is in very good agreement with most of the streamer observations to date (Offermann et al., 1999; Riese et al, 1999; Manney
10
et al., 2000, 2001). It can be shown with this model study that streamers (Offermann et al., 1999) occur preferentially at higher altitudes in the stratosphere in contrast to filaments/laminae, which were mainly observed in regions between 18–22 km height (e.g. Reid and Vaughan, 1991). Therefore, this streamer climatology cannot be compared with studies which restricted their analyses to filaments or laminae (e.g.
15
Reid and Vaughan, 1991; Reid et al., 1993, 1998; Orsolini and Grant, 2000). Due to limited spatial resolution in the model, filaments/laminae could not be resolved in the experiment. However, it was shown in a case study, that the final stage of a streamer can develop in a filament-like structure, as detected in fine-scale resolution transport studies by e.g. Waugh (1993) and Manney et al. (1998). The stretching and thinning
20
of a tropical-subtropical streamer was found close to the edge of the polar vortex, taken here to be the region where maximum wind speeds with the strongest spatial gradient exist. The theoretical and modeling studies of Appenzeller and Holton (1997) and Manney et al. (1998) found the formation of ozone laminae throughout the stratosphere, which would support the findings of this paper. Manney et al. (1998)
25
suggested three different formation mechanisms for ozone laminae depending on the altitude region of occurrence: in the higher stratosphere for example ozone laminae
ACPD
4, 6789–6822, 2004 Climatological features of stratospheric streamers in the FUB-CMAM K. Kr ¨uger et al. Title Page Abstract Introduction Conclusions References Tables Figures J I J I Back CloseFull Screen / Esc
Print Version
Interactive Discussion
formed due to the differential advection of trace gases.
When comparing this study to other streamer climatologies (Langbein et al., 2001; Eyring et al., 2003), a good correspondence between the general distribution of stream-ers is found only when a similar criterion method was chosen. The method used to
5
identify streamers determines the results of the climatology. In this study, the streamer climatology based on the method of zonal anomaly, was the best approach to iden-tify streamers in the horizontal plane. Nevertheless, method deficiencies due to an artificial counting of streamers arose in regions with strong horizontal gradients in the passive tracer field: (a) the tropical tropopause region due to a too cold and high
trop-10
ical tropopause in the model; (b) the subtropics and (c) the polar vortex edge. These artifacts are visible through an enhanced zonal band in the relative frequency field, which did not effect the region of comparison (20–70◦N/S). Another explanation for the deviations could be the use of different passive tracers in the different model studies. Langbein et al. (2001) and Eyring et al. (2003) used chemical N2O fields in contrast
15
to the idealized, zonally stratified passive tracer without any sources and sinks in this model study.
The higher occurrence of tropical-subtropical streamers compared to polar vortex streamers indicate, that the subtropical barrier is more permeable than the polar vortex barrier in the T42 FUB-CMAM. This model behaviour is in very good correspondence
20
with observed characteristics of the transport barriers (e.g. Plumb, 2002; Neu et al., 2003). However, possible model deficiencies could have an effect on the reliability of the results: the model climatology; the quality of the transport scheme; the neglect of the vertical transport, the use of an idealized zonally stratified tracer and the lower spatial resolution of the FUB-CMAM compared to high resolution transport calculations
25
ACPD
4, 6789–6822, 2004 Climatological features of stratospheric streamers in the FUB-CMAM K. Kr ¨uger et al. Title Page Abstract Introduction Conclusions References Tables Figures J I J I Back CloseFull Screen / Esc
Print Version
Interactive Discussion
6. Summary
To investigate the influence of large-scale transport processes on the observed to-tal ozone decrease in mid-latitudes, a global streamer climatology for 10-years was calculated using the FUB-CMAM with increased horizontal resolution. Unique to this study, the streamer climatology was divided into tropical-subtropical and polar vortex
5
streamers, using a full climate middle atmosphere model including the troposphere, stratosphere and mesosphere.
Streamers are regularly simulated with the FUB-CMAM and are in good correspon-dence with the observed features to date. They are characterized as having more than 10–20 km thickness in the vertical, a width between 500 to 2000 km and a length of
10
more than 10 000–20 000 km during the development stage. They can even span a whole latitudinal belt, as was also analysed for polar vortex filaments by e.g. Waugh et al. (1994) and Manney et al. (2001). Their duration is between 1–3 weeks and they decay in 1–2 weeks in the model simulations. Stratospheric streamers are thus to be distinguished from filaments/laminae, defined after Reid and Vaughan (1991).
15
However, a streamer can eventually develop into a filament-like structure (e.g. Waugh, 1993; Manney et al., 1998).
An overall result of the streamer climatology is that tropical-subtropical streamers have a higher frequency of up to four times more than polar vortex streamers. This result indicates that the subtropical barrier is more permeable than the polar vortex
20
barrier in the model, which is in good correspondence with observations (e.g. Neu et al., 2003). During the existence of the Arctic polar vortex, the maximum occurrence of tropical-subtropical streamers is up to 30% per 10 years during winter and spring in the middle and upper stratosphere of the NH. Synoptic maps reveal two maxima in the subtropics, one over East Asia and the other over the Atlantic.
25
Interesting for total ozone concentrations in mid-latitudes are transport processes in the lower stratosphere, which are likely to play a significant role in its observed negative trend (e.g. WMO, 2003; Grewe et al., 2004). It is found, that the transport out of the
ACPD
4, 6789–6822, 2004 Climatological features of stratospheric streamers in the FUB-CMAM K. Kr ¨uger et al. Title Page Abstract Introduction Conclusions References Tables Figures J I J I Back CloseFull Screen / Esc
Print Version
Interactive Discussion
tropics is greater in the middle stratosphere than in the lower stratosphere, as was also observed by e.g. Chen et al. (1994) and Waugh et al. (1994). Our investigation of the lower stratosphere revealed the highest occurrence of up to 10% in 10 years of tropical-subtropical streamers from October to February over East Asia/Pacific with a secondary maximum over the Atlantic. These results are in good correspondence
5
with observational estimates from the 1990s, if a similar streamer criterion is chosen (Langbein et al., 2001). Taking an ozone climatology from 1957–2000, Bojkov and Balis (2001) found extremely low ozone values in northern middle latitudes, with an increasing trend of such events since the 1980s and 1990s.
Further observational and modeling studies are needed to understand more about
10
the role of streamers in contrast to filaments/laminae in the stratosphere and in par-ticular their role on the observed mid-latitude ozone decrease. Of parpar-ticularly interest would be to investigate the occurrence of such streamers in transient climate simula-tions with the FUB coupled chemistry model to detect possible trends and influences on the mid-latitude total ozone distribution.
15
This study used a new approach, seperating stratospheric streamers (broad, large-scale, tongue-like structures) of trace gases or potential vorticity from filaments/laminae (thin, smaller-scale, finger-like structures) first detected in ozonesonde profiles (e.g. Brewer and Milford, 1960; Dobson 1973; Reid and Vaughan, 1991). Specific transport climatologies based on observations have solely concentrated on the effect of mixing
20
processes induced by smaller-scale transport phenomena. In the 10-year climatology, streamers are regularly simulated with the FUB-CMAM and are in good correspon-dence with the so far observed features. Tropical-subtropical streamers mark the entry of ozone-poor air from the tropics into mid-latitudes. Polar vortex streamers mark the entry of chemically processed air from polar into mid-latitudes. Both phenomena could
25
significantly contribute to the observed total ozone decrease in mid-latitudes since the 1980s (Fioletov et al., 2002). Streamers are likely to play a non-negligible role in deter-mining large-scale air mixing processes in the stratosphere and therefore impact total ozone mid-latitude trends.
ACPD
4, 6789–6822, 2004 Climatological features of stratospheric streamers in the FUB-CMAM K. Kr ¨uger et al. Title Page Abstract Introduction Conclusions References Tables Figures J I J I Back CloseFull Screen / Esc
Print Version
Interactive Discussion
Acknowledgements. We thank P. Mieth and P. Braesicke for the technical support with the
model code. For the helpful discussion and comments we would like to thank I. Langbein, M. M ¨uller and T. Shepherd. This work was part of the PhD thesis by K. Kr ¨uger, funded by the Bundesministerium f ¨ur Bildung und Forschung (BMBF) HGF-ENVISAT project (01SF9958).
References
5
Appenzeller, C. and Holton, J. R.: Tracer lamination in the stratosphere: A global climatology, J. Geophys. Res., 102, 13 555–13 569, 1997.
Bojkov, R. D. and Balis, D. S.: Characteristics of episodes with extremely low ozone values in the northern middle latitudes 1957–2000, Ann. Geophys., 19, 787–807, 2001.
B ¨ottcher, M.: A Semi-Lagrangian Advection Scheme with modified Exponential Splines, Mon.
10
Wea. Rev., 124, 716–729, 1996.
Boville, B. A., Holton, J. R., and Mote, P. W.: Simulation of the Pinatubo aerosol cloud in general circulation model, Geophys. Res. Lett., 18, 2281–2284, 1991.
Braesicke, P. and Langematz, U.: Coupling of a semi Langrangian transport scheme to the Berlin TSM GCM, Report of MPI for Meteorology, 265, 93–95, 1998.
15
Brewer, A. W.: Evidence for a world circulation provided by the measurements of helium and water vapor distribution in the stratosphere, Quart. J. R. Met. Soc., 75, 351–363, 1949. Brewer, A. W. and Milford, J. R.: The Oxford-Kew ozonesonde, Proc. R. Soc., A256, 470–495,
1960.
Chen, P., Holton, J. R., O’Neill, A., and Swinbank, R.: Isentropic mass exchange between the
20
tropics and extratropics in the stratosphere, J. Atmos. Sci., 51, 3006–3018, 1994.
Dobson, G. M. B.: Origin and distribution of polyatmoic molecules in the atmosphere, Proc. R. Soc. London, A236, 187–193, 1956.
Dobson, G. M. B.: The laminated structure of the ozone in the atmosphere, Quart. J. R. Met. Soc., 99, 599–607, 1973.
25
Eyring, V., Dameris, M., Grewe, V., Langbein, I., and Kouker, W.: Climatologies of subtropical mixing derived from 3D models, Atmos. Chem. Phys., 3, 1007–1021, 2003.
Fioletov, V. E., Bodeker, G. E., Miller, A. J., McPeters, R. D., and Stolarski, R.: Global ozone and zonal total ozone variations estimated from ground-based and satellite measurements: 1964–2000, J. Geophys. Res., 107, 4647, doi:10.1029/JD001350, 2002. Is the
doi-30
ACPD
4, 6789–6822, 2004 Climatological features of stratospheric streamers in the FUB-CMAM K. Kr ¨uger et al. Title Page Abstract Introduction Conclusions References Tables Figures J I J I Back CloseFull Screen / Esc
Print Version
Interactive Discussion
Grewe, V., Shindell, D. T., and Eyring, V.: The impact of horizontal transport on the chemical composition in the tropopause region: Lightning NOx and streamers, Adv. Space Res., 33, 1058–1061, 2004.
Haynes, P., Marks, C., McIntyre, M., Shepherd, T., and Shine, K.: On the “Downward Control” of extratropical diabatic circulations by eddy-induced mean zonal forces, J. Atmos. Sci., 48,
5
651–679, 1991.
Holton, J. R., Haynes, P. H., McIntyre, M. E., Douglass, A. R., Rood, R. B., and Pfister, L.: Stratosphere-troposphere exchange, Rev. Geophys., 33, 403–439, 1995.
Knudsen, B. M. and Grooß, J.-U.: Northern midlatitude stratospheric ozone dilution in spring modeled with simulated mixing, J. Geophys. Res., 105, 6885–6890, 2000.
10
Kouker, W., Offermann, D., K¨ull, V., Reddmann, T., Ruhnke, R., and Franzen, A.: Streamers observed by the CRISTA experiment and simulated in the KASIMA model, J. Geophys. Res., 104, 16 405–16 418, 1999.
Kr ¨uger, K.: Untersuchung von Transportprozessen in der Stratosph ¨are: Simulationen mit einem globalen Zirkulationsmodell, Dissertation am Fachbereich Geowissenschaften der Freien
15
Universit ¨at Berlin, 158, 2002.
Labitzke, K.: Interannual variability of the winter stratosphere in the northern hemisphere, Mon. Weath. Rev., 105, 762–770, 1977.
Langbein, I., Kouker, W., Reddmann, T., and Ruhnke, R.: Klimatologie von Streamern in der unteren Stratosph ¨are, Proc. of the DACH conference, 27/399, Wien, 2001.
20
Langematz, U.: An estimate of the impact of observed ozone losses on stratospheric tempera-ture, Geophys. Res. Lett., 27(14), 2077–2080, 2000.
Leovy, C. B., Sun, C.-R., Hitchman, M. H., Remsberg, E. E., Russell III, J. M., Gordley, L. L., Gille, J. C., and Lyjak, L. V.: Transport of ozone in the middle stratosphere: Evidence for planetary wave breaking, J. Atmos. Sci., 42, 230–244, 1985.
25
Mahlmann, J. D. and Umscheid, L. J.: Comprehensive modeling of the middle atmosphere: the influence of horizontal resolution, edited by Visconti, G. and Garcia, R., Transport processes in the middle atmosphere, 251–266, by D. Reidel publishing company, 1987.
Manney, G. L., Froidevaux, L., Waters, J. W., Elson, L. S., Fishbein, E. F., Zurek, W., Harwood, R. S., and Lahoz, W. A.: The evolution of ozone observed by UARS MLS in the 1992 late
30
winter southern polar vortex, Geophys. Res. Lett., 20, 1279–1282, 1993.
Manney, G. L., Bird, J. C., Donovan, D. P., Duck, T. J., Whiteway, J. A., Pal, S. R., and Car-swell, A. I.: Modeling ozone laminae in ground-based Arctic wintertime observations usinng
ACPD
4, 6789–6822, 2004 Climatological features of stratospheric streamers in the FUB-CMAM K. Kr ¨uger et al. Title Page Abstract Introduction Conclusions References Tables Figures J I J I Back CloseFull Screen / Esc
Print Version
Interactive Discussion
trajectory calculations and satellite data, J. Geophys. Res., 103, 5797–5814, 1998.
Manney, G. L., Michelsen, H. A., Irion, F. W., Toon, G. C., Gunson, M. R., and Roche, A. E.: Lamination and polar vortex development in fall from ATMOS long-lived gases observed during November 1994, J. Geophys. Res., 105, 29 023–29 038, 2000.
Manney, G. L., Michelson, H. A., Bevilacqua, R. M., Gunson, M. R., Irion, F. W., Livesey, N. J.,
5
Oberheide, J., Riese, M., Russel III, J. M., Toon, G. C., and Zawodny, J. M.: Comparison of satellite ozone observations in coincident air masses in early November 1994, J. Geophys. Res., 106, 9923–9944, 2001.
Marchand, M., Godin, S., Hauchecorne, A., Lev `efre, F., Bekki, S., and Chipperfield, M.: Influence of polar ozone loss on Northern mid-latitude regions estimated by a high
10
resolution chemistry model during winter 1999–2000, J. Geophys. Res., 108, 8326, doi:10.1029/2001JD000906, 2003.
McIntyre, M. E. and Palmer, T. N.: Breaking planetary waves in the stratosphere, Nature, 305, 593–600, 1983.
McIntyre, M. E. and Palmer, T. N.: The ‘surf zone’ in the stratosphere, J. Atmos. Terr. Phys., 46,
15
825–849, 1984.
Millard, G. A., Lee, A. M., and Pyle, J. A.: A model study of the connection between polar and mid-latitude ozone loss in the northern hemisphere lower stratosphere, J. Geophys. Res., 108, 8323, doi:10.1029/2001JD000899, 2003.
Mote, P. W., Rosenlof, K. H., McIntyre, M. E., Carr, E. S., Gille, J. C., Holton, J. R., Kinnersly,
20
J. S., Pumphrey, H. C., Russell III, J. M., and Waters, J. W.: An atmospheric tape recorder: The imprint of tropical tropopause temperatures on stratospheric water vapor, J. Geophys. Res., 101, 3989–4006, 1996.
Naujokat, B., Kr ¨uger, K., Matthes, K., Hoffmann, J., Kunze, M., and Labitzke, K.: The early major warming in December 2001 – exceptional?, Geophys. Res. Lett, 29(21), 2023,
25
doi:10.1029/2002GL015316, 2002.
Neu, J. L., Sparling, L. C., and Plumb, R. A.: Variability of the subtropical “edges” in the strato-sphere, J. Geophys. Res., 4482, doi:10.1029/2002JD002706, 2003.
Norton, W. A.: Breaking Rossby waves in a model stratosphere diagnosed by a vortex-following coordinate system and a technique for advecting material contours, J. Atmos. Sci., 654–673,
30
51, 1994.
Norton, W. A. and Chipperfield, M. P.: Quantification of the transport of chemically activated air from the northern hemisphere polar vortex, J. Geophys. Res., 100, 25 817–25 840, 1995.
ACPD
4, 6789–6822, 2004 Climatological features of stratospheric streamers in the FUB-CMAM K. Kr ¨uger et al. Title Page Abstract Introduction Conclusions References Tables Figures J I J I Back CloseFull Screen / Esc
Print Version
Interactive Discussion
Offermann, D., Grossmann, K.-U., Barthol, P., Knieling, P., Riese, M., and Trant, R.: CRyo-genic Infrared Spectrometers and Telescopes for the Atmosphere (CRISTA) experiment and middle atmosphere variability, J. Geophys. Res., 104, 16 311–16 325, 1999.
Orsolini, Y. J. and Grant, W. B.: Seasonal formation of nitrous oxide laminae in the mid and low latitude stratosphere, Geophys. Res. Lett., 27, 1119–1122, 2000.
5
Orsolini, Y. J., Cariolle, D., and D ´equ ´e, M.: Ridge formation in the lower stratosphere and its influence on ozone transport: A general circulation model study during late January 1992, J. Geophys. Res., 100, 11 113–11 135, 1995.
Pawson, S., Langematz, U., Radek, G., Schlese, U., and Strauch, P.: The Berlin Troposphere-Stratosphere-Mesosphere GCM: Sensitivity to physical parameterizations Quart. J. R. Met.
10
Soc., 124, 1343–1371, 1998.
Pawson, S., Kodera, K., Hamilton, K., Shepherd, T. G., Beagley, S. R., Boville, B. A., Farrara, J. D., Fairlie, T. D. A., Kitoh, A., Lahoz, W. A., Langematz, U., Manzini, E., Rind, D. H., Scaife, A. A., Shibata, K., Simon, P., Swinbank, R., Takacs, L., Wilson, R. J., Al-Saadi, A. A., Amodei, M., Chiba, M., Coy, L., de Grandpre, J., Eckman, R. S., Fiorino, M., Grose, W. L., Koide, H.,
15
Koshyk, J. N., Li, D., Lerner, J., Mahlman, J. D., McFarlane, N. A., Mechoso, C. R., Molod, A., O’Neill, A., Pierce, R. B., Randel, W. J., Rood, R. B., and Wu, F.: The GCM-Reality Intercomparison Project for SPARC (GRIPS): Scientific issues and initial results, Bull. Am. Meteorol. Soc., 81, 781–796, 2000.
Plumb, R. A.: A “tropical pipe” model of stratospheric transport, J. Geophys. Res., 101, 3957–
20
3972, 1996.
Plumb, R. A.: Stratospheric Transport, J. Meteor. Soc. Japan, 80, 793–809, 2002.
Plumb, R. A., Waugh, D. W., Atkinson, R. J., Newman, P. A., Lait, L. R., Schoeberl, M. R., Browell, E. V., Simmons, A. J., and Loewenstein, M.: Intrusions into the lower stratospheric Arctic vortex during the winter of 1991/92, J. Geophys. Res., 99, 1089–1105, 1994.
25
Randel, W. J., Gille, J. C., Roche, A. E., Kumer, J. B., Mergenthaler, J. L., Waters, J. W., Fishbein, E. F., and Lahoz, W. A.: Stratospheric transport from the tropics to middle latitudes by planetary wave mixing, Nature, 365, 533–535, 1993.
Reid, J. S. and Vaughan, G.: Lamination in ozone profiles in the lower stratosphere, Quart. J. R. Met. Soc., 117, 825–844, 1991.
30
Reid, J. S., Vaughan, G., and Kyr ¨o, E.: Occurrence of ozone laminae near the boundary of the stratospheric polar vortex, J. Geophys. Res., 98, 8883–8890, 1993.
ACPD
4, 6789–6822, 2004 Climatological features of stratospheric streamers in the FUB-CMAM K. Kr ¨uger et al. Title Page Abstract Introduction Conclusions References Tables Figures J I J I Back CloseFull Screen / Esc
Print Version
Interactive Discussion
E., Kr ¨uger-Carstensen, R., De Haan, L. L., Braathen, G., Dorokhov, V., Fast, H., Kyr ¨o, E., Gil, M., Litynska, Z., Molyneux, M., Murphy, G., O’Connor, F., Ravegnani, F., Varotsos, C., Wenger, J., and Zerefos, C.: A study of ozone laminae using diabatic trajectories, contour advection and photochemical trajectory model simulations, J. Atm. Chem., 30, 187–207, 1998.
5
Riese, M., Spang, R., Preusse, P., Ern, M., Jarisch, M., Offermann, D., and Grossmann, K. U.: CRyogenic Infrared Spectrometers and Telescopes for the Atmosphere (CRISTA) data processing and atmospheric temperature and trace gas retrieval, J. Geophys. Res., 104, 16 295–16 310, 1999.
Rood, R. B., Douglass, A., and Weaver, C.: Tracer exchange between tropics and middle
10
latitudes, Geophys. Res. Lett., 19, 805–808, 1992.
Steil, B., Br ¨uhl, C., Manzini, E., Crutzen, P. J., Lelieveld, J., Rasch, P. J., Roeckner, E., and Kr ¨uger, K.: A new interactive chemistry climate model, I: Present day climatology and inter-annual variability of the middle atmosphere using the model and 9 years of HALOE/UARS data, J. Geophys. Res. 108, 4290, doi:10.1029/2002JD002971, 2003.
15
Trepte, C. R., Viega, R. E., and McCormick, M. P.: The poleward dispersal of Mount Pinatubo volcanic aerosol, J. Geophys. Res., 98, 18 563–18 574, 1993.
Wahl, P.: Messung und Charakterisierung laminarer Ozonstrukturen in der polaren Stratosph ¨are, Dissertation, an der Mathematisch-Naturwissenschaftlichen Fakult ¨at der Uni-versit ¨at Potsdam, 142, 2001.
20
Waugh, D. W.: Subtropical stratospheric mixing linked to disturbances in the polar stratosphere, Nature, 365, 535–537, 1993.
Waugh, D. W.: Seasonal variation of isentropic transport out of the tropical stratosphere, J. Geophys. Res., 101, 4007–4023, 1996.
Waugh, D. W. and Plumb, R. A.: Contour Advection with Surgery: A technique for investigating
25
fine scale structure in tracer transport, J. Atmos. Sci., 530–540, 51, 1994.
Waugh, D. W., Plumb, R. A., Newman, P. A., Schoeberl, M. R., Lait, L. R., Loewenstein, M., Podolske, J. R., Elkins, J. W., and Chan, K. R.: Fine-scale, poleward transport of tropical air during AASE 2, Geophys. Res. Lett., 21, 1994.
World Meteorological Organization WMO: Scientific Assessment of Ozone Depletion: 2002,
30
World Meteorological Organization, Global Ozone Research and Monitoring Project-Report, 47, 2003.
ACPD
4, 6789–6822, 2004 Climatological features of stratospheric streamers in the FUB-CMAM K. Kr ¨uger et al. Title Page Abstract Introduction Conclusions References Tables Figures J I J I Back CloseFull Screen / Esc
Print Version
Interactive Discussion
a)
b)
Fig. 1. Time evolution of the North Pole temperature (◦C) from November to April at 10 hPa
for (a) 10 years of FUB-CMAM at 88◦N, (b) FUB observations for the period 1988/1989 to
ACPD
4, 6789–6822, 2004 Climatological features of stratospheric streamers in the FUB-CMAM K. Kr ¨uger et al. Title Page Abstract Introduction Conclusions References Tables Figures J I J I Back CloseFull Screen / Esc
Print Version
Interactive Discussion
Fig. 2. Synoptic development during December days 63 to 78 of year 11. Shown are contour
lines (32 gpdam) for geopotential height at 10 hPa and shaded colours for PV at 850 K, from 20–90◦N. 1 PVU (“Potential Vorticity Unit”)=10−5km2kg−1s−1; 5 PVU intervals.
ACPD
4, 6789–6822, 2004 Climatological features of stratospheric streamers in the FUB-CMAM K. Kr ¨uger et al. Title Page Abstract Introduction Conclusions References Tables Figures J I J I Back CloseFull Screen / Esc
Print Version
Interactive Discussion
Fig. 3. Stratospheric streamers simulated in the FUB-CMAM for the same time sequence as in
ACPD
4, 6789–6822, 2004 Climatological features of stratospheric streamers in the FUB-CMAM K. Kr ¨uger et al. Title Page Abstract Introduction Conclusions References Tables Figures J I J I Back CloseFull Screen / Esc
Print Version
Interactive Discussion
Fig. 4. Zonal anomaly of stratospheric streamers, as in Fig.3. Shaded colours represent the
ACPD
4, 6789–6822, 2004 Climatological features of stratospheric streamers in the FUB-CMAM K. Kr ¨uger et al. Title Page Abstract Introduction Conclusions References Tables Figures J I J I Back CloseFull Screen / Esc
Print Version
Interactive Discussion
Fig. 5. Synoptic maps of relative frequency distributions of (a) tropical-subtropical streamers
ACPD
4, 6789–6822, 2004 Climatological features of stratospheric streamers in the FUB-CMAM K. Kr ¨uger et al. Title Page Abstract Introduction Conclusions References Tables Figures J I J I Back CloseFull Screen / Esc
Print Version
Interactive Discussion
a)
b)
Fig. 6. Inter-annual variability of relative frequencies of (a) tropical-subtropical streamers and (b) polar vortex streamers averaged over the October to May period and over 15–40 km altitude,
ACPD
4, 6789–6822, 2004 Climatological features of stratospheric streamers in the FUB-CMAM K. Kr ¨uger et al. Title Page Abstract Introduction Conclusions References Tables Figures J I J I Back CloseFull Screen / Esc
Print Version
Interactive Discussion
a)
b)
Fig. 7. Seasonal variability (October to May) of relative frequencies of (a) tropical-subtropical
streamers and(b) polar vortex streamers averaged over the 15–40 km altitude, zonal means
ACPD
4, 6789–6822, 2004 Climatological features of stratospheric streamers in the FUB-CMAM K. Kr ¨uger et al. Title Page Abstract Introduction Conclusions References Tables Figures J I J I Back CloseFull Screen / Esc
Print Version
Interactive Discussion
Fig. 8. Vertical distribution of relative frequencies for tropical-subtropical streamer averaged
over the October to May period for(a) zonal mean, (b) 0–90◦E,(c) 90–180◦E,(d) 90–180◦W
ACPD
4, 6789–6822, 2004 Climatological features of stratospheric streamers in the FUB-CMAM K. Kr ¨uger et al. Title Page Abstract Introduction Conclusions References Tables Figures J I J I Back CloseFull Screen / Esc
Print Version
Interactive Discussion
Fig. 9. Streamer climatology: synoptic maps of relative frequency distributions for
tropical-subtropical streamer, averaged over 31–35 km altitude for(a) ON, (b) DJF and (c) MAM period;
ACPD
4, 6789–6822, 2004 Climatological features of stratospheric streamers in the FUB-CMAM K. Kr ¨uger et al. Title Page Abstract Introduction Conclusions References Tables Figures J I J I Back CloseFull Screen / Esc
Print Version
Interactive Discussion