HAL Id: hal-00813599
https://hal.archives-ouvertes.fr/hal-00813599
Submitted on 15 Apr 2013
HAL is a multi-disciplinary open access
archive for the deposit and dissemination of sci-entific research documents, whether they are pub-lished or not. The documents may come from teaching and research institutions in France or abroad, or from public or private research centers.
L’archive ouverte pluridisciplinaire HAL, est destinée au dépôt et à la diffusion de documents scientifiques de niveau recherche, publiés ou non, émanant des établissements d’enseignement et de recherche français ou étrangers, des laboratoires publics ou privés.
properties of Tl1-yFe2-z(Se1-xSx)2 with isovalent
substitution of Se by S
Pierre Toulemonde, David Santos-Cottin, Christophe Lepoittevin, Pierre
Strobel, Jacques Marcus
To cite this version:
Pierre Toulemonde, David Santos-Cottin, Christophe Lepoittevin, Pierre Strobel, Jacques Marcus. Dependence of the structural, transport and magnetic properties of Tl1-yFe2-z(Se1-xSx)2 with iso-valent substitution of Se by S. Journal of Physics: Condensed Matter, IOP Publishing, 2013, 25, pp.075703. �10.1088/0953-8984/25/7/075703�. �hal-00813599�
Dependence of the structural, transport and
magnetic properties of Tl
1−yFe
2−z(Se
1−xS
x)
2with
isovalent substitution of Se by S
P. Toulemonde‡, D. Santos-Cottin§, Ch. Lepoittevin, P. Strobel and J. Marcus
Institut N´eel, CNRS and Universit´e Joseph Fourier, 25 avenue des Martyrs, BP 166, F-38042 Grenoble cedex 9, France.
E-mail: pierre.toulemonde@grenoble.cnrs.fr Abstract.
The effect of selenium substitution by sulfur in the Tl1−yFe2−zSe2antiferromagnet
was studied by x-ray and electron diffraction, magnetization and transport
measurements. Tl0.8Fe1.5(Se1−xSx)2 (nominal composition) solid solution was
synthesized in the full x range (0 ≤ x(S) ≤ 1) using the sealed tube technique. No superconductivity was found down to 4.2K in the series despite the fact that the optimal crystallographic parameters, determined by Rietveld refinements, are reached in the series (i.e. the Fe-(Se,S) interplane height and (Se,S)-Fe-(Se,S) angle for which the
critical superconducting transition Tc is usually maximal in pnictides). Quasi full Tl
site (y ∼ 0.05) compared to significant alkaline deficiency (y = 0.2 − 0.3) in analogous
A1−yFe2−zSe2(A = K, Rb, Cs), and the resulting differences in iron valency, density
of states and doping, are suggested to explain this absence of superconductivity. Transmission electron microscopy confirmed the existence of ordered iron vacancies
network in the samples of the Tl0.8Fe1.5(Se1−xSx)2series in the form of the tetragonal
√
5 a ×√5 a × c superstructure (I4/m). The N´eel temperature (TN) indicating the
onset of antiferromagnetism order in this√5 a ×√5 a × c supercell is found to decrease
from 450K in the selenide (x=0) to 330K in the sulfide (x=1). We finally demonstrate
a direct linear relationship between TN and the Fe-(Se,S) bond length (or Fe-(Se,S)
height).
PACS numbers: 74.70.Xa, 74.62.Bf, 61.05.cp, 75.50.Ee
‡ Corresponding author. Fax: 00334 7688 1038
1. Introduction
After the discovery of superconductivity in iron-based superconductors, i.e. in pnictides and chalcogenides, numerous families were found, at least five families for arsenides with superconducting transition up to Tc = 55 K. In chalogenides, superconductivity
was first found in the “11” family (Fe1+y(Te1−xChx)) with Ch=Se or S, and recently in
a second family AFe2−ySe2 (“A-122” selenide) with A=K [1], Rb, Cs (or Tl/Rb, Tl/Cs)
showing Tc around 30 K, i.e. close to the maximum value measured for FeSe under high
pressure [2, 3, 4]. A related compound is TlFe2−ySe2, which was first synthesized and
studied 25 years ago by H¨aggstr¨om et al. [5]. This compound is antiferromagnetic with a high N´eel temperature around TN=450K, i.e. in the range of TN values measured for
alkaline intercalated 122 selenides [6].
In iron-based superconductors, superconductivity can be induced by simple isovalent substitution of the pnictogen or chalcogen, for example by substitution of As by P in LnFeAsO (Ln = La, Ce, Pr, Nd, Sm...) (“1111”) or “122” arsenides, or of Te by Se/S in the Fe1+yTe telluride. The present work follows the same approach to search
for superconductivity in thallium-122 selenide (“ Tl-122”) by substitution of selenium by sulfur. In addition, this substitution may allow to approach the structural conditions where the highest Tc’s are reached in this structural family, i.e. either a Fe-Se bond
length around 1.41 ˚A [7] (in the FeSe system under high pressure) or Ch-Fe-Ch bond angles corresponding to a regular FeCh4 tetrahedron (in Fe-As systems) [8].
During this study we became aware of an investigation of the K1−yFe2−z(Se1−xSx)2
series by Lei et al. [9]. In the potassium system, the x = 0 end member is already superconducting (Tc = 33K) and superconductivity disappears with increasing x(S).
This may be related to (i) a decrease in iron non-stoichiometry (i.e. the compound contains less iron vacancies), (ii) an increase in FeCh4 tetrahedron distortion [9].
In this article we study the structural and physical trends vs. sulfur content in the Tl1−yFe2−z(Se1−xSx)2 seriesk. Contrary to the alkaline-122 systems, the
selenium-only and end-member is known to present no superconductivity. We will show in this article that all sulfur-substituted compositions remain antiferromagnetic above room temperature, and that their N´eel temperature decreases linearly with decreasing Fe-Ch bond length.
k Members of the Tl0.8Fe1.5(Se1−xTex)2 (nominal composition) solid solution were also prepared up
to x(Te) = 0.5 using the same synthesis technique. The preparation of phase-pure samples was more
difficult : for x > 0.2 the samples contain secondary phases: tetragonal Fe(Te1−xSex), FeTe2 and
Tl5Te3. Tellurium substitution for selenium induces an increase in both a and c cell parameters (up
to a ∼ 3.94 ˚A and c ∼ 14.09 ˚A for x(Te) = 0.5), as expected from the larger atomic radius of
tellurium. Transport measurements in this system showed superconductivity (with zero resistivity)
below Tc=15K. Magnetization measurements, however, gave a very small diamagnetic shielding, which
can be ascribed to the tetragonal Fe(Te1−xSex) impurity, since the superconducting volume agrees
with the Fe(Te1−xSex) phase fraction estimated from x-ray diffraction. We note that Te substitution
in superconducting Rb0.8Fe2−y(Se1−xTex)2 induces a strong reduction of superconductivity which
1−y 2−z 1−x 2
2. Experimental
Tl1−yFe2−z(Se1−xSx)2 samples (“Tl-122(Se,S)”) were synthesized using the sealed tube
technique as reported elsewhere for Fe1+δ(Te1−xSex) [11, 12]. Starting materials were
commercial Fe pieces (Alfa Aesar, 99.98%), Tl pieces (Alfa Aesar, 99.99%), Se chips (Alfa Aesar, 99.999%) and FeS (Alfa Aesar, 99.9%). Precursors with nominal composition Tl0.8Fe1.5(Se1−xSx)2 (i.e. z = 0.5) were placed in an alumina crucible which was
introduced in a quartz tube and sealed under vacuum. The heat treatment constituted of a first heating ramp at 100˚C/h up to 700˚C followed by a plateau for 12 hours at this temperature; then the samples were slowly cooled at 5˚C/h to 280˚C and maintained at this temperature for 24h, then furnace-cooled.
X-ray diffraction (XRD) patterns were collected at room temperature using a Bruker D8 powder diffractometer working in Bragg-Brentano geometry at the wavelength λCu, Kα1 = 1.54056 ˚A from 2θ = 10 to 90˚ with a step of 0.032˚.
Electron diffraction (ED) studies combined with quantitative energy dispersive spectroscopy (EDS) micro-analysis were carried out using a Philips CM 300 transmission electron microscope (TEM), operating at 300 kV, equipped with a +/- 30˚ double tilt sample holder. Specimens were prepared by crushing a small portion of sample in an agate mortar containing ethanol in order to obtain a powder with particles as thin as possible. Then a droplet of the mixture was deposited on a copper grid with a holey carbon film, in order to obtain an homogeneous particles distribution.
Transport measurements were carried out using the four point contacts technique down to liquid helium temperature. Magnetization of selected samples were measured at low (down to 4.2K) and high temperature (up to 600K) using a home-made magnetometer with a resolution of 2.10−6 A.m2 and with magnetic field up to 6T.
3. Results and discussion 3.1. Powder x-ray diffraction
Figure 1 shows the powder x-ray diffraction (XRD) patterns of polycrystalline Tl0.8Fe1.5(Se1−xSx)2 samples (nominal composition) for sulfur contents from 0 to 100%
(with a step of substitution equal to 0.1). Nearly all peaks can be indexed in the tetragonal space group I4/mmm found for AEFe2As2 (AE = Ba, Sr, Ca) arsenides
and used originally by Guo et al. [1] for their superconducting KFe2Se2 selenide. This
I4/mmm tetragonal structure (drawn in the right part of fig. 3) implies disordered iron vacancies in the iron plane with an average iron occupancy factor around 0.8. Remaining unreacted (non superconducting) hexagonal Fe(S1−xSex) (marked by an asterisk symbol
in fig.1) and Fe3O4 (for x(S)=0.8, symbol “+”in fig.1) are found as minor impurities
in several samples. In addition we observe that a significant modification of the initial nominal composition Tl:Fe:Ch = 0.8:1.5:2 (for example an increase of iron content) induces the emergence of the tetragonal Fe(Se1−xSx) secondary phase (XRD pattern
10 15 20 25 30 35 40 45 50 55 60 65 70 + + + + * * + * * * * Tl 0.8 Fe 1.5 S 2 100% 93(2)% 87(2)% 72(2)% 58(2)% 50(2)% 45(1)% 35(1)% 16(1)% 11(1)% i n t e n s i t y ( a . u . ) 2 theta (deg.) 0% refined Sulfur content Tl 0.8 Fe 1.5 Se 2 *
Figure 1. XRD patterns (λ = 1.5406 ˚A) of Tl0.8Fe1.5(Se1−xSx)2samples for 0 ≤ x ≤ 1
(nominal step=0.1). Refined compositions (at. % S) are indicated. * and + symbols
indicate the main Bragg peaks of (non superconducting) hexagonal Fe(S1−xSex) and
Fe3O4 (for x=0.8) minor impurities respectively.
10 12 14 16 18 20 22 24 26 28 0.1 0.2 ( 2 0 0 ) t 0.60 0.50 0.50 z 0.20 0.60 ( 1 1 2 ) t ( 2 0 2 ) t ( 2 0 0 ) t ( 1 1 0 ) t x(S) ( 1 1 2 ) o ( 0 2 2 ) o ( 1 1 0 ) o ( 0 2 0 ) o ( 1 0 1 ) ( 0 0 4 ) ( 2 0 2 ) t ( 1 1 2 ) t ( 1 1 0 ) t i n t e n s i t y ( a . u ) 2 theta (deg.) ( 0 0 2 ) 0.20
Figure 2. Selected low 2-theta region of the XRD patterns of x=0.2 (with z=0.5
or z=0.6) and x=0.6 Tl0.8Fe2−z(Se1−xSx)2 samples (λ = 1.5406 ˚A). Supercell weak
reflections related to the tetragonal√5 a ×√5 a × c (Miller indices labelled “t”) or
1−y 2−z 1−x 2
More interesting, for some sulfur contents, we clearly observe very weak reflections (near the detection limit) at low angle. These supplementary Bragg peaks can be indexed in supercells derived from the original I4/mmm lattice. If a and c represent the subcell parameters, two superstructures were found in the present study: a tetragonal √
5 a × √5 a × c one (I4/m space group) and an orthorhombic √2 a × 2√2 a × c one (Ibam), only present if the iron deficiency is large. These superstructures are due to iron vacancy ordering observed for z=0.4 and z=0.5 by Sabrowsky et al. 25 years ago in TlFe2−zS2 sulfides [13], and confirmed very recently in the new alkaline-based selenides
AFe2−zSe2 (A=K,Rb,Cs) [6, 14, 15, 16, 17] but also in the thallium-based one [18]. An
enlargement of the low 2-theta region of the XRD patterns for Tl0.8Fe1.5(Se0.4S0.6)2,
Tl0.8Fe1.5(Se0.8S0.2)2 (i.e. both with z=0.5) and Tl0.8Fe1.4(Se0.8S0.2)2 (i.e. z=0.6, not
belonging to the series) is displayed figure 2. For x=0.6 (and z=0.5) the satellite peaks of the √5 a × √5 a × c supercell are clearly visible. For the sample with less sulfur, x=0.2 and the same nominal iron content (z=0.5) these satellite peaks are still present (the highest one being the (110) reflection)) but seem less intense. In contrast, when the level of iron vacancies is increased, i.e. for z=0.6 (keeping x=0.20), new small satellite peaks appear, in addition to those related to the√5 a × √5 a × c supercell, which can be indexed in the orthorhombic √2 a × 2√2 a × c supercell. This result, confirmed by electron diffraction (see below), is in agreement with the previous work of Sabrowsky [13] who reported the orthorhombic supercell for low level of iron content in sulfides.
Despite the difficulty to detect the satellite reflections by conventional powder XRD, this XRD characterization suggests that all samples contain at least the√5 a ×√5 a × c phase (mixed with the orthorhombic √2 a × 2√2 a × c one if the nominal content of iron is decreased). To confirm this result we have performed an electron diffraction study of selected samples. In addition, because supercell reflections are extremely weak (near the detection level of our diffraction setup), all the Rietveld refinements of our XRD patterns were performed in the average I4/mmm space group.
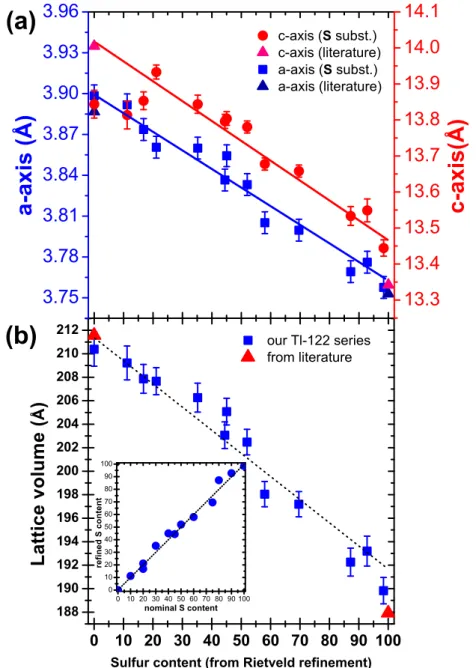
An enlargement of two regions of the XRD patterns around (004) and (200) reflections of the Tl-122(Se,S) series shows a continuous shift to higher angle with sulfur content (Figure 3). This corresponds to a decrease of both lattice parameters of the Tl-122(Se,S) lattice with increasing x(S). The evolution of cell parameters and volume of the unit cell with sulfur content, determined from Rietveld refinement of XRD patterns are displayed respectively in figure 4. The decrease observed here (from a ∼ 3.88 ˚A and c ∼ 14 ˚A for x(S) = 0 to a ∼ 3.75 ˚A and c ∼ 13.4 ˚A for x(S) = 1, i.e. a reduction of the unit cell volume of about 10%, fig. 4(b)) is similar in amplitude to that reported in the potassium K1−yFe2−z(Se1−xSx)2 series (see fig. 1 in ref. [9]). The lines (guide
for eyes) in fig. 4(a) show that our samples are in agreement with the expected values considering a linear decrease between extremal x = 0 and x = 100% compositions. The small deviation from this linear trend (visible in the c-axis variation for x < 20% for example) is probably due to very slight variations in iron and/or thallium contents between different samples (see the trend shown in table 1 for refined values of Fe and Tl site occupancy factors). About the real stoichiometry of the samples, as we will see
25262728 464748495051 ( 2 0 0 ) Tl 0.8 Fe 1.5 S 2 i n t e n s i t y ( a . u . ) 2 theta (deg.) Tl 0.8 Fe 1.5 Se 2 ( 0 0 4 ) 100% 93(2)% 87(2)% 70(2)% 58(2)% 52(2)% 45(1)% 35(1)% 16(1)% 11(1)% 0%
Figure 3. Left: Selected 2-theta regions of the XRD patterns in the
Tl0.8Fe1.5(Se1−xSx)2series (λ = 1.5406 ˚A) showing the 2-theta shift of (004) and (200)
reflections, corresponding to the shrinkage of the lattice with x(S) increase. Right: Tl-122(Se,S) structure in the I4/mmm space group (i.e. with iron vacancies not ordered).
it later in part D (Rietveld refinements results), we found that the Tl site is nearly full despite the fact that the nominal composition corresponds to 20% of deficiency (y = 0.2). This is an important difference with alkaline based A-122 selenides where real alkaline deficiency is generally around 20-30% in superconducting compounds [14, 17].
3.2. Electron diffraction in TEM
x=0, 0.2 (with z = 0.6, i.e. not belonging to our z = 0.5 series) and 0.7 compositions were selected for detailed electron diffraction studies.
For the pure selenide (x = 0, z = 0.5), the EDS analysis carried out on around 50 crystallites shows an homogeneous average cationic composition Tl1.0(1)Fe1.7(1)Se2,
in agreement with the Rietveld calculations (see paragraph 3.4) which evidences a significant amount of iron vacancies in the samples, as expected. The electron diffraction patterns recorded on different particles present a body-centered tetragonal sub-cell with a = b = 3.9 ˚A, c = 14 ˚A. The extinctions observed are compatible with the I4/mmm space group. However, extra reflections, i.e. satellite reflections, can be observed on the [001] oriented basal plane (figure 5). These extra spots are characteristic of a modulated structure with a two-components modulation vector ~q∗ = α ~a∗+ β ~b∗. According to this
1−y 2−z 1−x 2 0 10 20 30 40 50 60 70 80 90 100 188 190 192 194 196 198 200 202 204 206 208 210 212 L a t t i c e v o l u m e ( Å )
Sulfur content (from Rietveld refinement) our Tl-122 series from literature 3.75 3.78 3.81 3.84 3.87 3.90 3.93 3.96 a -a x i s ( Å ) 13.3 13.4 13.5 13.6 13.7 13.8 13.9 14.0 14.1 c-axis (S subst.) c-axis (literature) a-axis (S subst.) a-axis (literature) c -a x i s ( Å ) (b) 0 102030405060708090100 0 10 20 30 40 50 60 70 80 90 100 r e f i n e d S c o n t e n t nominal S content (a)
Figure 4. (a) Refined lattice parameters (from Rietveld refinement of the XRD
patterns) of the Tl1−yFe2−z(Se1−xSx)2 samples as a function of S substitution level.
Values from literature are taken from ref. [5] for the pure selenide (x=0) and ref. [19] for the pure sulfide (x=1). (b) Sulfur content dependence of the volume lattice in the
Tl1−yFe2−z(Se1−xSx)2 samples. Inset: refined S content versus nominal S content in
Figure 5. (Top)[001] ED pattern of x=0 sample (Tl1.0(1)Fe1.7(1)Se2 from EDS)
indexed in a tetragonal sub-cell. (Bottom) The zoomed area evidences the two
directions of the modulation vector associated to the satellite reflections.
two vectors in agreement with the superstructure defined previously by Pomjakushin et al. [14] for the Cs-based 122 selenide: ~q∗
1 and ~q2∗ lie along [210] and [¯120] directions of
the subcell, with an amplitude of 1/5, leading to the values ~q∗
1 = 1/10(-2 ~a∗+4~b∗) and
~ q∗
2 = 1/10(4 ~a∗+2~b∗). Bearing in mind the commensurate nature of the modulation, the
structure can also be described in a supercell a = b = 8.7 ˚A (=√5 a), c = 14 ˚A (I4/m). This result is in agreement with neutron and x-ray powder and single crystal diffraction data reported recently on CsyFe2−xSe2 system [14] and with the electron diffraction
study of KyFe2−xSe 2 showing evidence of a
√
5 a ×√5 a × c supercell [20].
For the Se-rich composition (x = 0.2) and higher nominal iron vacancy level (z = 0.6 instead of z = 0.5 in the series, see XRD pattern, fig. 2), the EDS analysis carried out on numerous crystallites confirms a homogeneous cationic composition
1−y 2−z 1−x 2
Figure 6. [10¯1] (top) and [001] (bottom) ED pattern of x=0.2and z=0.6 sample
(Tl0.8(1)Fe1.4(1)(Se0.75(5)S0.25(5))2 from EDS) indexed in an orthorhombic cell.
Tl0.8(1)Fe1.4(1)Se1.5(1)S0.5(1), not far from the nominal composition and with less iron than
the previous sample, as expected. We note also that this sample contains a slightly lower content of thallium than the x=0 sample. The reconstruction of the reciprocal space obtained by tilting around the b* crystallographic axis led to an orthorhombic cell with the parameters a = 5.6 ˚A (√2 a), b = 11.3 ˚A (2 √2 a) and c = 15 ˚A (figure 6). The reflexions conditions (hkl : h+k+l=2n, 0kl : k = 2n and h0l : h = 2n) are compatible with space group Ibam (n˚72). Note that the 101 and 303 reflections visible on the [10¯1] ED pattern are artefacts caused by the multiple diffraction ; upon rotation around the [101] axis, these reflections indeed disappear depending on the zone axis. We conclude that these crystallographic features are in agreement with the indexation of extra weak peaks of the x=0.2, z=0.6 XRD pattern (see fig. 2), and also with the orthorhombic
Figure 7. [010] ED pattern of x=0.7 sample (Tl0.8(1)Fe1.5(1)(Se0.3(1)S0.7(1))2 from
EDS) indexed in a tetragonal sub-cell.
structure obtained for the TlFe1.5S2 pure sulfide in 1980 [21].
For a S-rich system (x=0.7, z = 0.5) of the Tl-122(Se,S) series, a very homogeneous cationic composition close to the nominal formulation was revealed by EDS analysis. Electron diffraction evidenced the tetragonal structure as for x=0. Figure 7 exhibits an ED pattern recorded along the [010] zone axis with the parameters a ∼ 3.9 ˚A and c∼ 14 ˚A.
As a conclusion, this electron diffraction study of selected x(S) compositions confirm that the extra peaks shown by x-ray diffraction (at the limit of detection level) are those due to the superstructure which appear when the iron vacancies are ordered in their basal plane. It confirms that all investigated samples of the Tl0.8Fe1.5(Se1−xSx)2 series
contain a major fraction crystallized in the iron ordered tetragonal √5 a ×√5 a × c superstructure (I4/m) and a minor part with the iron disordered I4/mmm lattice. For the sample not belonging to this series, where iron content was decreased, an orthorhombic √2 a ×2√2 a × c superstructure was found.
3.3. Electrical resistance and magnetization
Figure 8 shows the typical magnetization curve M(T) and electrical resistance R(T) for x=0.4 sample as a function of (high) temperature. For this composition, we clearly see the onset of the antiferromagnetic (AFM) ordering around 390K on the M(T) curve. The appearance of the magnetic ordering is also visible in the R(T) curve as an anomaly which is more or less marked depending on the sulfur content. This magnetic transition (at TN) is preceded by a structural transition (at TS slightly above TN) which
1−y 2−z 1−x 2 200 250 300 350 400 450 500 0.04 0.06 0.08 0.1 0.12 0.14 0.16 1.72x10 -4 1.76x10 -4 1.80x10 -4 1.84x10 -4 1.88x10 -4 1.92x10 -4 1.96x10 -4 R ( O h m ) T(K) R(T) T Néel x=0.40 M ( A . m 2 ) M(T)
Figure 8. Magnetization measured at 6T and electrical resistance (in log scale) in
the 200-500K range of the x=0.4 sample. In both measurements the signature of the
onset of the AFM order at TN is clearly visible.
to the I4/mmm description) in the tetragonal√5 a ×√5 a × c superstructure, as shown by our combined XRD and ED studies. A similar behavior was also reported in alkaline based selenides in previous neutron diffraction studies of K0.8Fe1.6Se2 [6] (TN=559K and
TS=578K) and Rb0.8Fe1.6Se2(TN=502K and TS=515K) or Cs0.8Fe1.6Se2 (TN=471K and
TS=500K) [16]. In thallium phases TN and TS seem to be very close, and we have used
the anomaly in the transport measurements as a determination of TN, as usually made
in analogous alkaline-based AFe2−ySe2 selenides (A=K,Rb,Cs) [15, 22].
The next figure (fig. 9) shows the electrical resistance (R(T)) behaviors (in log scale) of the two extremal composition x=0 and x=1 in a larger temperature range, i.e. from 600K down to the liquid helium temperature. All compositions showed a semi-conducting behavior at low T, independently of the sulfur content. No superconductivity has been found down to 4.2K. In the particular case of the pure selenide (x=0), in the 4-300K range, the R(T) curve of our polycrystalline sample shows two regimes which intersect around T2=120K, as observed previously by Sales et al. at 100K on
a TlFe1.6Se2 single crystal [18]. These authors have also evidenced another transition
temperature around T1=150K, not visible in our samples, based on their specific heat,
magnetization and transport measurements. And they have concluded very recently that this particular behavior of TlFe1.6Se2 between T1 and T2 was related to a sudden
change of z position of 4 Fe spins pointing down (along c-axis) and 4 Fe spins pointing up in the “block checkboard”AFM structure, inducing a corrugation of the iron layer and a canting of the Fe magnetic moment relatively to the c-axis (up to 27(3)˚ at 115K)
0,1 1 10 R ( O h m ) T Néel = 344K 0,1 1 10 R ( O h m ) Tl 0.8 Fe 1.5 S 2 T 2 ~ 55K 0 50 100 150 200 250 300 350 400 450 500 550 0,1 1 10 100 1000 10000 T Néel = 425K T(K) R ( O h m ) T 2 ~ 120K 0,1 1 10 100 1000 10000 Tl 0.8 Fe 1.5 Se 2 R ( O h m )
Figure 9. Low and high temperature dependence of the electrical resistance of typical
x=0 and x=1.0 samples of of the Tl0.8Fe1.5(Se1−xSx)2series emphasizing the signature
of the long range AFM structure in the ordered iron vacancies√5 a ×√5 a × c supercell
at TN.
for T2 < T < T1 [23]. We are unable with the present data to discuss in details this
point, but it seems that T2 decreases with the sulfur content introduced in the lattice. It
will be maybe interesting in the future to study if this unusual magnetoelastic behavior seen in the selenide case for T2 < T < T1 persists also up to x(S)=1 and how it evolves.
The characteristic temperature TN extracted from the anomaly observed in the high
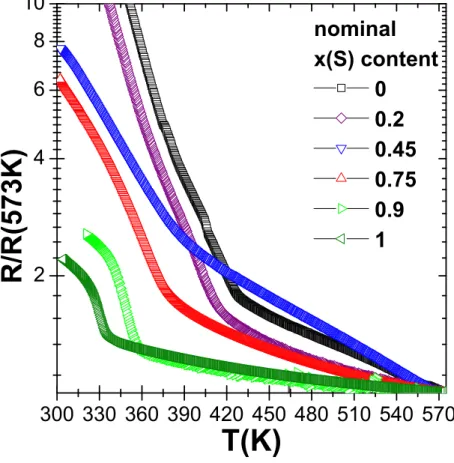
temperature resistivity measurement, and associated with the AFM ordering at low T, is clearly visible for all x(S) compositions (see curves normalized to the value measured at 573K, figure 10). It unambiguously decreases gradually in the Tl0.8Fe1.5(Se1−xSx)2 series
from TN=425K for the selenide (x=0) to TN=344K for the sulfide (x=1). We also note
1−y 2−z 1−x 2 300 330 360 390 420 450 480 510 540 570 2 4 6 8 10 R / R ( 5 7 3 K ) T(K) nominal x(S) content 0 0.2 0.45 0.75 0.9 1
Figure 10. High temperature dependence of the electrical resistance of several
Tl0.8Fe1.5(Se1−xSx)2samples with 0 ≤ x ≤ 1. Nominal sulfur x(S) content is indicated.
The anomaly related to the long range AFM structure in the ordered iron vacancies √
5 a ×√5 a × c network at TN is clearly shown and decreases with x(S).
in the lattice (i.e. the iron vacancies content), via the change of the nominal ratios Tl:Fe:Se+S (TN is increased to 475K for example in Tl1Fe1.8Se2, see its magnetization
curve figure 11). However, we did not not systematically explored this trend and focused our study on the series with a nominal ratio Tl:Fe equal to 0.8:1.5. This transition from a paramagnetic state to an antiferromagnetic one at low temperature is less detectable in our magnetic measurements. This is particular true for high values of x(S), as shown in the curves of figure 11, because of a supplementary background arising from minor magnetic impurities contained in our samples (quasi undetectable by XRD). For this reason, as mentioned at the beginning of this paragraph, we have preferred the anomaly seen in the transport measurements as a determination of TN.
3.4. Rietveld refinements in the average I4/mmm space group
The structural parameters of Tl1−yFe2−z(Se1−xSx)2 were refined from XRD data by the
Rietveld method using the “Fullprof” software [24]. Data points with 10˚ ≤ 2θ ≤ 90˚ were taken into account. A pseudo-Voigt profile shape was used. The background was
300 330 360 390 420 450 480 1,6x10 -4 1,7x10 -4 1,8x10 -4 1,9x10 -4 4,2x10 -4 nominal x(S) content 0 0.1 0.4 0.7 T (K) M ( A . m 2 ) 1,28x10 -3 1,29x10 -3 1,30x10 -3 1,31x10 -3 M ( A . m 2 )
Figure 11. High temperature dependence of the magnetization (measured at 6T) of
several Tl1−yFe2−z(Se1−xSx)2samples for nominal x(S)=0 (and nominal composition
Tl1Fe1.8Se2; right scale), 0.1, 0.4 and 0.7. Nominal S/Se ratio x(S) content is indicated.
The onset of the long range AFM ordering in the ordered iron vacancies network at
TN is marked by an arrow and is found to decrease with x(S).
10 15 20 25 30 35 40 45 50 55 60 65 70 75 80 85 90 -1000 -500 0 500 1000 1500 2000 2500 3000 3500 4000 Tl 0.8 Fe 1.5 (Se 0.5 S 0.5 ) 2 i n t e n s i t y ( a . u . ) 2 theta (deg.) Yobs Ycal Yobs-Ycal Bragg position
Figure 12. Rietveld refinement profile of XRD pattern (λ = 1.5406 ˚A) for
Tl0.8Fe1.5(Se0.5S0.5)2at room temperature. A difference curve is plotted at the bottom
(observed minus calculated). Tick marks correspond to Bragg peaks of Tl-122(Se,S) main phase in the I4/mmm space group description (first line) and hexagonal Fe(Se,S) impurity phase (second line).
1−y 2−z 1−x 2
Table 1. Refined structural parameters of x=0, x=0.5 and x=1 compositions of
Tl1−yFe2−z(Se1−xSx)2series using the average I4/mmm description (Ch=Se,S).
compound x=0 x=0 at 250K x=0 x=0.5 x=1
H¨aggstr¨om et al. [5] Cao et al. [23] (1986) (2012) a-axis (˚A) 3.8867(3) 3.884(2)d 3.8870(1) 3.8331(2) 3.7572(3) c-axis (˚A) 14.005(1) 14.002(7) 14.0401(3) 13.781(1) 13.443(2) n(Tl) 1 1 0.98(2) 0.90(2) 0.92(2) n(Fe) 1 0.795(5)e 0.66(2) 0.71(1) 0.70(1) n(S) - - - 0.52(2) 1 z(Ch) 0.357a 0.3575(2)f 0.3530(2) 0.3541(2) 0.3478(5) Fe-Ch height (˚A) 1.50(1) 1.505(7) 1.446(3) 1.434(3) 1.315(5) Fe-Ch bond length (˚A) 2.457(1) 2.457(2) 2.422(2) 2.394(2) 2.294(4) Ch-Fe-Ch bond angle (deg.) 104.55b 104.44(1) 106.70(5) 106.37(8) 110.0(1)
Rp (%) -c R
1=5.89 21.3 18.0 24.7
Rwp (%) -c wRF2=13.2 14.6 13.2 20.2
Chi2 -c 8.04 3.25 0.478 4.86
a parameter fixed; b calculated; c not given in the paper.
d from neutron diffraction on single crystal in I4/m supercell; a-axis was divided by
√
5 for the comparison; e average value of total Fe1 (16i) and Fe2 (4d) site occupancies
calculated taking into account the multiplicity of both iron sites;f average z-positions of
Se1 (4e) and Se2 (16i) calculated taking into account the multiplicity of both selenium sites.
fitted using a linear interpolation between selected points.
Attempts to use the space group corresponding to iron vacancy ordering, for instance the tetragonal √5 a × √5 a × c lattice, led to refinement instabilities, due to the weakness of the superstructure reflections. Consequently, all refinements were carried out assuming the tetragonal I4/mmm lattice (space group No.139) i.e. neglecting ordering of iron vacancies.
The structure as described in the I4/mmm space group contains the following Wyckoff sites: Tl at 2a (0,0,0), Fe (in the center of the FeCh4 tetrahedron) at 4d
(0,1/2,1/4) and Ch (Ch=Se,S) at 4e (0,0,z) with z ∼ 0.355 (with Se and S atoms constrained to the same z coordinate). Refined variables were lattice parameters, the z-position of the chalcogen atom, iron and thallium occupancy factors and (Se,S) occupancy ratio (their total summation was constrained to unity), and all isotropic Debye Waller factors. In addition the Fe(S1−xSex) hexagonal impurity phase was taken
into account in the Rietveld refinements of the XRD patterns for the samples where this minor phase was identified. Its amount and structure were refined (i.e. lattice parameters, S content (constrained to the one of the main Tl-122(Se,S) phase), profile shape parameters). For x=0.8 the Rietveld refinement was performed by taking into
0 10 20 30 40 50 60 70 80 90 100 0.346 0.348 0.350 0.352 0.354 0.356 0.358
Sulfur content (from Rietveld refinement)
z ( S e , S ) p o s i t i o n (c) 2.30 2.32 2.34 2.36 2.38 2.40 2.42 2.44 2.46 our study literature F e -S e / S b o n d l e n g t h ( Å ) 1.32 1.34 1.36 1.38 1.40 1.42 1.44 1.46 1.48 1.50
interplane Fe-Se/S distance literature F e -S e / S h e i g h t ( Å ) 1.39 (b) (a)
Figure 13. (a) Fe-(Se,S) height (i.e. interplane Fe-(Se,S) distance), (b) Fe-(Se,S) bond
length and (c) refined z position of (Se,S) site of the Tl1−yFe2−z(Se1−xSx)2 samples
versus the refined S content.
account the Fe3O4 impurity.
Figure 12 illustrates the result of the Rietveld refinement for x=0.5 as an example(see also refined values in table 1) where the minor Fe(Se,S) impurity phase was detected; there is a good agreement between the experimental and the calculated profiles. For all our samples the amount of this impurity phase was found inferior than 1% (in weight). On the other hand the refined fraction of Fe3O4 impurity was also found
inferior than 1% (in weight) in x=0.8 sample.
1−y 2−z 1−x 2 0 10 20 30 40 50 60 70 80 90 100 104 105 106 107 108 109 110 111 112 -angle literature S e / S -F e -S e / S a n g l e ( d e g . )
Sulfur content (from Rietveld refinement)
104 105 106 107 108 109 110 111 112 -angle literature S e / S -F e -S e / S a n g l e ( d e g . )
Figure 14. (Se,S)-Fe-(Se,S) bond angle in the Fe(Se,S)4 tetrahedron of the
Tl1−yFe2−z(Se1−xSx)2samples as a function of refined S content.
x=0.5 and x=1. Our refined values for extremal x = 0 and x = 1 compositions are in good agreement with the values reported in the old (see table I) and very recent literature [5, 19, 23]. On the other hand the refined S content found in each Tl-122(Se,S) sample of the series is very close to the nominal content, as deduced from the inset of fig. 4(b). Sulfur substitutes selenium at the expected site.
Figure 13(a) shows the evolution of the Fe-(Se,S) height, i.e. the distance between the iron and the (Se,S) planes, with sulfur content. As expected the substitution of Se by S with a smaller atomic radius induces a continuous decrease of this inter-planar distance (from ∼ 1.50 ˚A for x=0 to ∼ 1.35 ˚A for x=1); this distance crosses the ideal value 1.39 ˚A for which Tc is usually maximal in pnictides [25] and the value 1.41-1.42 ˚A
where Tc is maximal in FeSe under pressure [7]. In a similar way the Fe-(Se,S) bond
length decreases regularly with sulfur content in the lattice (see fig. 13(b)) from ∼ 2.45 ˚A in Tl1−yFe2−zSe2 to ∼ 2.30 ˚A in Tl1−yFe2−zS2, i.e. covers the range explored under high
pressure on pure tetragonal FeSe (∼ 2.37 ˚A at 0 GPa to ∼ 2.29 ˚A at 10 GPa) in which Tc is maximal [3, 26]. Nevertheless no superconductivity is observed in our samples
down to 4.2K.
Figure 14 shows the variation of the two characteristic (Se,S)-Fe-(Se,S) bond angles in the Fe(Se,S)4 tetrahedron: α and β (α notation correspond to two (Se,S) atoms of
the same layer, while β notation concerns two (Se,S) atoms on both sides of the iron layer). The two complementary angles merge towards the ideal value of the regular
tetrahedron (109.47 deg.), i.e. towards the value for which the maximal Tc is observed
in superconducting iron-based arsenides [8]. Again, despite this, no superconductivity is found for any (Se,S) composition.
It should be pointed out that the maximal Tc value is not achieved in FeSe iron
selenide when the angle is ideal; on the contrary Tc values above 30K are reached for
strongly distorted tetrahedron [3, 26]. 3.5. Discussion
Rietveld refinements evidenced the continuous decrease of both Fe-(Se,S) bond length and Fe-(Se,S) height with sulfur content in Tl1−yFe2−z(Se1−xSx)2. As pointed out
above, despite the evolution of the structural parameters towards values usually favoring superconductivity (i.e. optimal Fe-Ch height and optimal Ch-Fe-Ch angle), superconductivity is not induced by isovalent substitution of selenium by sulfur in this iron-deficient Tl-122(Se,S) system. It seems that the only way to induce bulk superconductivty in the Tl-122 system is to replace partially Tl by an alkaline element, as observed by Fang et al. for potassium substitution, with Tc around 30 K for samples
rich in iron (z=0.18-0.22) [27]; they reported also superconductivity at Tc ∼ 20 K for
Tl1Fe1.7Se2composition but with a very low superconducting volume fraction, suggesting
a filamentary type superconductivity associated to a minority/impurity phase.
This difference of behavior could be related to slight structural differences between pure thallium and alkaline element 122 systems. First of all, the lattice volume, and then lattice parameters, of the Tl-122 selenide are smaller than those of analogous compounds with A = K, Rb, Cs by about 1 − 2% (see table 1 in ref [16] for a comparison). Secondly, the relative position of the chalcogen atom relatively to the iron plane in the 122 selenides remains around the same value: z=0.3530(2) in Tl-122(Se) (this work) compared to z=0.3539(2) [1]-0.3560(3) [28] in K-122 and z=0.3439(3) [28]-0.3456(4) [14] in Cs-122. This induces slightly shorter Fe-Se and Fe-Fe bond lengths in the Tl-122(Se) compared to A-122 (A = K, Rb, Cs) by 1 − 2%. These differences are enhanced when Se is substituted by S in Tl-122(Se,S) (see refined value of z(Se,S) position, fig. 13(c)), and this could affect the electronic structure, and consequently the insulating/superconducting behavior at low T.
The first DFT calculation of the electronic structure of related 122 chalcogenides was performed on stoichiometric hypothetical TlFe2Se2 and revealed that the Fermi
surface is relatively close to the other iron-based compounds, i.e. contains two electron cylinders, but with hole surfaces suppressed [29]. Electronic structure calculations were then carried out on more realistic compositions: z=0.5 (with orthorhombic √2 a ×2√2 a × c superstructure) and z=0.4 (with tetragonal √5 a ×√5 a × c supercell) and compared with alkaline-based analogous selenides [30, 31, 32]. In particular, it was found that the Fermi surface of TlFe1.6Se2 is in fact highly three-dimensional,
unlike alkaline-based selenides [32]. Moreover, in the early calculations for z=0 (i.e. without iron vacancies), the density of states at the Fermi level N(EF) was found
1−y 2−z 1−x 2
to decrease from 3.6-3.94 states/(eV.cell) in Cs or K intercalated selenides [33, 34] to ca. 2 states/(eV.cell) [29] in Tl-122(Se) selenide. On the other hand, the full replacement of Se by S in K-122 was found to reduce N(EF) by ca. 50% to
2.025 states/eV/cell for KFe2S2[34]. This lower N(EF) in the Tl-based selenide, and even
lower N(EF) with S substitution, could explain why x=0 and all S-substituted samples
of the Tl1−yFe2−z(Se1−xSx)2 series are not superconducting at low temperature. This
hypothesis has to be checked theoretically (using realistic crystallographic structures determined experimentally for the electronic structure calculations) and experimentally. In that sense ARPES measurements on pure thallium-based chalcogenides would be very useful.
Another important issue, still under debate, is the possible existence of chemical/electronic phase separation at the nanoscale in A0.8Fe2−zSe2 selenides
(A = K, Rb, Cs) suggested by TEM structural studies [20], synchrotron XRD [35] or STM studies of K-122 films [36]. Very recently, based on back-scattered electron images (SEM) and M¨ossbauer spectroscopy Hu. et al. suggested that superconductivity of K0.8Fe1.76Se2 may be due to a sub-micron phase of K0.6Fe1.9Se2 composition [37]; Texier
et al. also reported a phase separation in a Rb0.74Fe1.6Se2 single crystal studied by
NMR and attributed superconductivity to the Rb0.3(1)Fe2Se2 phase [38]. In the case
of Tl-based 122 selenides, using Z-contrast scanning TEM, Cao et al. has reported a phase separation at the nanometer scale in crystals grown from a melt (obtained at high temperature from the mixture of pure elements) of nominal composition Tl:Fe:Se = 1:2:2 [23]. This phase separation is not due to vacancies on the thallium site but is the consequence of the incomplete ordering of iron vacancies in their Tl1Fe1.6Se2
crystal (estimated to be composed of 40-48 % of ordered Fe vacancies regions). During the finalization of this manuscript, we became aware of the last report of this group who shows that fully ordered Tl1Fe1.6Se2 crystals can be obtained if the composition of
the melt contains less iron, typically Tl:Fe:Se = 1:1.6:2 [39]. The ratio Fe:Se we have used for the synthesis of our samples (Fe:Se = 1.5) is very close to the one used in this last report; in that sense our samples must be quite homogeneous. This is confirmed by our ED study which evidences a larger fraction of the sample crystallized in the ordered phase (√5 a × √5 a × c) than in the disorderd one (a × a × c). Indeed, contrary to A-122 selenides for which the alkaline site is strongly deficient (y = 0.2 − 0.3) Tl intercalated selenides can be obtained fully homogeneous, if correctly prepared, with a nearly full Tl site, i.e. y = 0 − 0.1 and a constant iron content distributed in fully ordered iron vacancies regions in the whole sample. Finally, all these results together imply that the doping level (then the iron valency) is very different between the actual superconducting A-122 phases and the Tl-122(Se,S) compounds, and this could also explain why superconductivity is not observed in Tl-122(Se,S).
Addressing now the high temperature magnetic behavior of the Tl-122(Se,S) series, we have plotted N´eel temperature values (TN) extracted from our transport
measurements (see fig. 9 and 10) vs the sulfur content x(S) in fig. 15. It shows a regular decrease of TN with S content. A similar trend (shifted down by 5-10K, fig.
0 10 20 30 40 50 60 70 80 90100 340 360 380 400 420 440 460
our series (from R(T)) literature
our series (from M(T))
T N é e l ( K )
Sulfur content (from Rietveld refinement)
Figure 15. N´eel temperature (extracted from the electrical resistance measurement)
in Tl1−yFe2−z(Se1−xSx)2 samples versus the refined S content. The values extracted
from the magnetic measurements performed on the three samples of the series (see fig. 11) have also been added.
15) is obtained considering the values extracted from the magnetic measurements of the samples (of the series) incorporating the lowest level of magnetic impurities (fig. 11). As a consequence, there is a very good correlation between TN and the Fe-(Se,S) height
(see fig. 16): TN decreases continuously with the shrinkage of the Fe-(Se,S) height. A
similar trend is observed for a plot of TN as a function of the Fe-(Se,S) bond length
(inset of fig.16).
We note that an opposite behavior has been reported in LaFeAsO when As is substituted isoelectronically by Sb: TN decreases also monotonously with
antimony substitution, corresponding to an increase of the equivalent Fe-(As,Sb) bond length [40]. This behavior results from a complex competition between different magnetic interactions in the system, i.e. the relative magnetic exchange integrals between nearest iron neighbors and next-nearest iron atoms in the same iron plane on one hand, and the magnetic exchange between iron atoms from different planes on the other. More theoretical work is necessary to interpret this linear correlation with S content, determine the different magnetic interaction energies and find the most stable magnetic configuration. The related calculations were already made for the z = 0.4 and z = 0.5 (y = 0 in both cases) compositions [30, 32]. It would be useful to extend it to sulfur-substituted compositions. In addition it would also be interesting to study
1−y 2−z 1−x 2 1.30 1.35 1.40 1.45 1.50 320 340 360 380 400 420 440 460 480 our series literature T N é e l ( K ) Fe-Se/S height (Å) 2.30 2.35 2.40 2.45 320 340 360 380 400 420 440 460 480 our series literature T N é e l ( K )
Fe-Se/S bond length (Å)
Figure 16. N´eel temperature in Tl1−yFe2−z(Se1−xSx)2 samples (extracted from the
electrical resistance measurement) as a function of the Fe-(Se,S) height in the structure. Inset: idem as a function of the Fe-(Se,S) bond length.
the evolution magnetic excitations with sulfur content in the thallium-based series and the differences with respect to their superconducting alkaline-based analogues. In view of this, we performed preliminary neutron diffraction experiments on Tl-122(Se,S) to investigate their static long-range magnetic structure. The results of this work will be published elsewhere.
4. Conclusion
The full solid solution of the Tl0.8Fe1.5(Se1−xSx)2 series (nominal composition), i.e. from
x = 0 to x = 1 was synthesized using the sealed tube technique. This sulfur-based series was carefully studied by x-ray diffraction, electron diffraction, magnetization and transport measurements. No superconductivity was found down to 4.2K despite that the optimal crystallographic parameters are reached in the S-based series, i.e. the Fe-(Se,S) height and (Se,S)-Fe-(Se,S) angle for which the critical superconducting transition Tc is
usually maximal in pnictides. The S-based solid solution shows a decrease of its N´eel temperature (TN), indicating the onset of the long range antiferromagnetism in the
ordered iron vacancies √5 a ×√5 a × c superstructure, from 425-450K in the selenide (x = 0) to 330-344K in the sulfide (x = 1). Our structural investigation emphasizes a
direct linear relationship between TN and the Fe-(Se,S) bond length.
Acknowledgments
The authors thank their collegues S. Karlsson, M. N´u˜nez-Regueiro (Institut N´eel) and G. Garbarino (ESRF) for their support at the first stage of this work and for their useful suggestions. We are also very grateful to Andr´e Sulpice (Institut N´eel) for the low temperature magnetization measurements of tellurium substituted samples and Yves Deschanels (Institut N´eel) for his help in the magnetization measurements, in particular at high temperature. This work was partially supported by the project SupraTetraFer ANR-09-BLAN-0211 of the Agence Nationale de la Recherche of France.
References
[1] J. Guo, S. Jin, G. Wang, S. Wang, K. Zhu, T. Zhou, M. He, and X. Chen. Phy. Rev. B, 82:180520(R), 2010.
[2] Y. Mizuguchi, F. Tomioka, S. Tsuda, T. Yamaguchi, and Y. Takano. Appl. Phys. Lett., 93:152505, 2008.
[3] G. Garbarino, A. Sow, P. Lejay, A. Sulpice, P. Toulemonde, M. Mezouar, and M. N´unez-Regueiro. Euro. Phys. Lett., 86:27001, 2009.
[4] S. Medvedev, T.M. McQueen, I.A. Troyan, T. Palasyuk, M. I. Eremets, R. J. Cava, S. Naghavi, F. Casper, V. Ksenofontov, G.Wortmann, and C. Felser. Nature Materials, 8:630, 2009.
[5] L. H¨aggstr¨om, H.R. Varma, B. Bjarman, R. W¨appling, and R. Berger. J. Sol. St. Chem., 63:401–408, 1986.
[6] W. Bao, Q.Z. Huang, G.F. Chen, M.A. Green, D.M. Wang, J.B. He, and Y.M. Qiu. Chin. Phys. Lett., 28:086104, 2011.
[7] H. Okabe, N. Takeshita, K. Horigane, T. Muranaka, and J. Akimitsu. Phys. Rev. B, 81:205119, 2010.
[8] C.H. Lee, A. Iyo, H. Kito, M.T. Fernandez-Diaz, T. Ito, K. Kihou, H. Mastsuhata, M. Braden, and K. Yamada. J. Phys. Soc. Jap., 77:083704, 2008.
[9] H. Lei, M. Abeykoon, E.S. Bozin, K. Wang, J. B. Warren, and C. Petrovic. Phys. Rev. Lett., 107:137002, 2011.
[10] D. Gu, L. Sun, Q. Wu, C. Zhang, J. Guo, P. Gao, Y. Wu, X. Dong, X. Dai, and Z. Zhao. Phys. Rev. B, 85:174523, 2012.
[11] T. Klein, D. Braithwaite, A. Demuer, W. Knafo, G. Lapertot, C. Marcenat, P. Rodi`ere, I. Sheikin, P. Strobel, A. Sulpice, and P. Toulemonde. Phys. Rev. B, 82:184506, 2010.
[12] Y. Noat, T. Cren, V. Dubost, S. Lange, F. Debontridder, P. Toulemonde, J. Marcus, A. Sulpice, W. Sacks, and D. Roditchev. J. Phys.: Condens. Matter, 22:465701, 2010.
[13] H. Sabrowsky, M. Rosenberg, D. Welz, P. Deppet, and W. Sch¨afer. J. Magn. Magn. Mater., 54-57:1497–1498, 1986.
[14] V. Yu. Pomjakushin, D. V. Sheptyakov, E. V. Pomjakushina, A. Krzton-Maziopa, K. Conder, D. Chernyshov, V. Svitlyk, and Z. Shermadini. Phys. Rev. B, 83:144410, 2011.
[15] Y.J. Song, Z. Wang, Z.W. Wang, H.L. Shi, Z. Chen, H.F. Tian, G.F. Chen, H.X. Yang, and J.Q. Li. Euro. Phys. Lett, 95:37007, 2011.
[16] F. Ye, S. Chi, W. Bao, X.F. Wang, J.J. Ying, X.H. Chen, H.D. Wang, C.H. Dong, and M. Fang. Phys. Rev. Lett., 107:137003, 2011.
[17] P. Zavalij, W. Bao, X.F. Wang, J.J. Ying, X.H. Chen, D.M. Wang, J.B. He, X.Q. Wang, G.F. Chen, P.-Y. Hsieh, Q. Huang, , and M.A. Green. Phys. Rev. B, 83:132509, 2011.
[18] B. Sales, M.A. McGuire, A.F. May, H. Cao, B.C. Chakoumakos, and A.S. Sefat. Phys. Rev. B, 8:224510, 2011.
[19] K.O. Klepp and H. Boller. Monatshefte fuer Chemie und verwandte Teile anderer Wissenschaften, 109:1049, 1978.
[20] Z. Wang, Y. J. Song, H. L. Shi, Z. W. Wang, Z. Chen, H. F. Tian, G. F. Chen, J. G. Guo, H. X. Yang, and J. Q. Li. Phys. Rev. B, 83:140505(R), 2011.
[21] M. Zabel and K-J Range. Revue de Chimie G´en´erale, 17:561, 1980.
[22] R. H. Liu, X. G. Luo, M. Zhang, A. F. Wang, J. J. Ying, X. F. Wang, Y. J. Yan, Z. J. Xiang, P. Cheng, G. J. Ye, Z. Y. Li, and X. H. Chen. Euro. Phys. Lett, 94:27008, 2011.
[23] H. Cao, C. Cantoni, A.F. May, M.A. McGuire, B.C. Chakoumakos, S.J. Pennycook, R. Custelcean, A.S. Sefat, , and Brian C. Sales. Phys. Rev. B, 85:054515, 2012. [24] J. Rodriguez-Carvajal. Physica B, 192:55, 1993.
[25] G. Garbarino, R. Weht, A. Sow, A. Sulpice, P. Toulemonde, M. Alvarez-Murga, P. Strobel, P. Bouvier, M. Mezouar, and M. N´unez-Regueiro. Phys. Rev. B, 84:024510, 2011.
[26] S. Margadonna, Y. Takabayashi, Y. Ohishi, Y. Mizuguchi, Y. Takano, T. Kagayama, T. Nakagawa, M. Takata, and K. Prassides. Phys. Rev. B, 80:064506, 2009.
[27] M.H. Fang, H.D. Wang, C.H. Dong, Z.J. Li, C.M. Feng, J. Chen, and H.Q.Yuan. Euro. Phys. Lett, 94:27009, 2011.
[28] A. Krzton-Maziopa, Z. Shermadini, E. Pomjakushina, V. Pomjakushin, M. Bendele, A Amato, R. Khasanov, H. Luetkens, and K. Conder. Journal of Physics: Condensed Matter, 23:052203, 2011.
[29] Lijun Zhang and D. J. Singh. Phys. Rev. B, 79:094528, 2009.
[30] X.W. Yan, M. Gao, Z.Y. Lu, and T. Xiang. Phys. Rev. Lett., 106:087005, 2011. [31] C. Cao and J. Dai. Phys. Rev. B, 83:193104, 2011.
[32] C. Cao and J. Dai. Phys. Rev. Lett., 107:056401, 2011.
[33] I.A. Nekrasov and M.V. Sadovskii. JETP Letters, 93:166, 2011.
[34] I.R. Shein and A.L. Ivanovskii. J. Supercond. Nov. Magn., 24:2215, 2011.
[35] A. Ricci, N. Poccia, G. Campi, B. Joseph, G. Arrighetti, L. Barba, M. Reynolds, M. Burghammer, H. Takeya, Y. Mizuguchi, Y. Takano, M. Colapietro, N. L. Saini, and A. Bianconi. Phys. Rev. B, 84:060511(R), 2011.
[36] W.Li, H. Ding, P. Deng, K. Chang1, C. Song, Ke He, LiliWang, X. Ma, J.-P. Hu, Xi Chen, and Qi-K. Xue. Nat. Phys., 8:126, 2012.
[37] R. Hu, E. D. Mun, D. H. Ryan, K. Cho, H. Kim, H. Hodovanets, W. E. Straszheim, M. A. Tanatar, R. Prozorov, W. N. Rowan-Weetaluktuk, J. M. Cadogan, M. M. Altarawneh, C. H. Mielke, V. S. Zapf, S. L. Bud’ko, and P. C. Canfield. to be a chapter in the book titled ”Iron Pnictide Superconductors: materials, properties and mechanism” by Pan Stanford Publishing, page arXiv:1201.0953, 2012.
[38] Y. Texier, J. Deisenhofer, V. Tsurkan, A. Loidl, D. S. Inosov, G. Friemel, and J. Bobroff. Phys. Rev. Lett., 108:237002, 2012.
[39] A. F. May, M. A. McGuire, H. Cao, I. Sergueev, C. Cantoni, B. C. Chakoumakos, D. S. Parker, , and B. C. Sales. Phys. Rev. Lett., 109:077033, 2012.
[40] S. J. E. Carlsson, F. Levy-Bertrand, C. Marcenat, A. Sulpice, J. Marcus, S. Pairis, T. Klein, M. N´unez-Regueiro, G. Garbarino, T. Hansen, V. Nassif, and P. Toulemonde. Phys. Rev. B, 84:104523, 2011.


![Figure 5. (Top)[001] ED pattern of x=0 sample (Tl 1.0(1) Fe 1.7(1) Se 2 from EDS) indexed in a tetragonal sub-cell](https://thumb-eu.123doks.com/thumbv2/123doknet/14571876.539646/9.892.272.611.136.740/figure-ed-pattern-sample-eds-indexed-tetragonal-cell.webp)
![Figure 6. [10¯1] (top) and [001] (bottom) ED pattern of x=0.2and z=0.6 sample (Tl 0.8(1) Fe 1.4(1) (Se 0.75(5) S 0.25(5) ) 2 from EDS) indexed in an orthorhombic cell.](https://thumb-eu.123doks.com/thumbv2/123doknet/14571876.539646/10.892.275.610.131.760/figure-ed-pattern-sample-eds-indexed-orthorhombic-cell.webp)
![Figure 7. [010] ED pattern of x=0.7 sample (Tl 0.8(1) Fe 1.5(1) (Se 0.3(1) S 0.7(1) ) 2 from EDS) indexed in a tetragonal sub-cell.](https://thumb-eu.123doks.com/thumbv2/123doknet/14571876.539646/11.892.277.608.133.470/figure-ed-pattern-sample-eds-indexed-tetragonal-cell.webp)