HAL Id: hal-00522550
https://hal.archives-ouvertes.fr/hal-00522550
Submitted on 1 Oct 2010HAL is a multi-disciplinary open access archive for the deposit and dissemination of sci-entific research documents, whether they are pub-lished or not. The documents may come from teaching and research institutions in France or abroad, or from public or private research centers.
L’archive ouverte pluridisciplinaire HAL, est destinée au dépôt et à la diffusion de documents scientifiques de niveau recherche, publiés ou non, émanant des établissements d’enseignement et de recherche français ou étrangers, des laboratoires publics ou privés.
A study of water releases in ground (GCC) and
precipitated (PCC) calcium carbonates
G. Renaudin, Anne Bertrand, M. Dubois, S. Gomes, P. Chevalier, A. Labrosse
To cite this version:
G. Renaudin, Anne Bertrand, M. Dubois, S. Gomes, P. Chevalier, et al.. A study of water releases in ground (GCC) and precipitated (PCC) calcium carbonates. Journal of Physics and Chemistry of Solids, Elsevier, 2009, 69 (7), pp.1603. �10.1016/j.jpcs.2007.12.001�. �hal-00522550�
www.elsevier.com/locate/jpcs
Author’s Accepted Manuscript
A study of water releases in ground (GCC) and precipitated (PCC) calcium carbonates
G. Renaudin, A. Bertrand, M. Dubois, S. Gomes, P. Chevalier, A. Labrosse
PII: S0022-3697(07)00755-X
DOI: doi:10.1016/j.jpcs.2007.12.001
Reference: PCS 5336
To appear in: Journal of Physics and
Chemistry of Solids
Received date: 2 May 2007
Revised date: 6 November 2007
Accepted date: 3 December 2007
Cite this article as: G. Renaudin, A. Bertrand, M. Dubois, S. Gomes, P. Cheva-lier and A. Labrosse, A study of water releases in ground (GCC) and precipi-tated (PCC) calcium carbonates, Journal of Physics and Chemistry of Solids (2007), doi:10.1016/j.jpcs.2007.12.001
This is a PDF file of an unedited manuscript that has been accepted for publication. As a service to our customers we are providing this early version of the manuscript. The manuscript will undergo copyediting, typesetting, and review of the resulting galley proof before it is published in its final citable form. Please note that during the production process errors may be discovered which could affect the content, and all legal disclaimers that apply to the journal pertain.
Accepted manuscript
A study of water releases in ground (GCC) and precipitated (PCC) calcium
carbonates
G. Renaudina,b,*, A. Bertrandb, M. Duboisa, S. Gomesa, P. Chevalierc, A. Labrossed
a
Laboratoire des Matériaux Inorganiques, UMR 6002, Université Blaise Pascal de
Clermont-Ferrand, F-63177 Aubière Cedex, France, b Ecole Nationale Supérieure de Chimie
de Clermont-Ferrand, F-63174 Aubière Cedex, France, c Dow Corning S.A., Surface and
Interface Solutions Center, B-7180 Seneffe, Belgium, d Dow Corning S.A., SEU-Analytical
Sciences, B-7180 Seneffe, Belgium.
* Corresponding author: guillaume.renaudin@ensccf.fr, tel.: (+33) 4 7340 7336, fax: (+33) 4 7340 7108
Abstract
Precipitate Calcium Carbonates (PCCs) are important industrial products mainly used as fillers. Because of their regular, synthesized characteristics (e.g. grain shape or grain size distribution) PCCs are distinct from natural Ground Calcium Carbonates (GCCs). A thermal study on GCC samples showed only the presence of surface physisorbed water with a monotonic weight loss up to the carbonate decomposition. In the case of PCC samples, two supplementary water releases were observed. The first one appeared at around 525 K and the second one at around 725 K. The nature of the water present in two different PCC samples was investigated by thermal analyses (thermogravimetric and Karl Fischer analyses), Rietveld
analyses on X-rays powder diffraction, infrared and Raman spectroscopies and solid state 1H
MAS NMR. The second water release at about 725 K was clearly identified as being portlandite dehydration. Ca(OH)2 was present in the PCC in an amorphous state. Its crystallization occurred simultaneously to the first water release at about 525 K. Structural effects observed on calcite during the first water release led to the assignment to structural water molecules inserted in the structure of calcite.
Keywords
Precipitated calcium carbonate (PCC), ground calcium carbonate (GCC), water release, calcite, portlandite, structural water.
Accepted manuscript
1. Introduction
Calcium carbonate is used as fillers for numerous applications, including thermoplastics. Ground Calcium Carbonates (GCC: ground from natural chalk, limestone or marble) are generally used as fillers with an interesting performance/price ratio. However, more expensive Precipitated Calcium Carbonates (PCC, synthetic CaCO3) can be used to fulfil additional needs like processing aid, impact modification and better weatherability [1-3]. PCCs are much more than a filler, namely because of their regular and controlled crystalline shape, ultrafine particle size and narrowness of particle size distribution. PCCs are obtained by reaction of gaseous carbon dioxide with a colloidal suspension of calcium hydroxide and can be decomposed by the two simple following reactions:
- thermal decomposition of GCC: CaCO3 ⎯Δ⎯T,⎯CO⎯⎯2↑→ CaO ⎯+⎯ →H⎯2O Ca(OH)2 (1)
- controlled precipitation of PCC: Ca(OH)2 + CO2 ⎯⎯→ CaCO3 + H2O (2)
The synthesis process is sufficiently versatile to allow a number of different morphological characteristics to be developed [2-4]. However, calcium carbonates are containing various levels of moisture, which impose careful storage or the use of desiccant additives such as CaO to preserve the final properties of e.g. thermoplastic films [5]. Indeed, compared to GCC, two additional water releases were observed when heating PCC at around 525 and 725 K. These two water losses were superimposed on the monotonic weight loss observed from room temperature (RT) up to the temperature of decomposition of the carbonate (i.e. about 1025 K). The monotonic weight loss was present in both PCC and GCC cases and was assigned to both physisorbed surface water molecules and to the beginning of the decarbonation process. The physisorbed water was correlated to the specific surface area of the samples. The present study, realised in partnership with Specialty Minerals Inc., was aimed at identifying the origin and nature of the two additional kinds of water present in PCCs, that can be considered as the main impurity. Water losses were identified and quantified by several techniques, namely thermogravimetric analysis (TGA) and Karl Fischer analysis (KF), correlated with a previous study by thermal analysis at controlled kinetics coupled together with mass
spectroscopy [6]. Powder X-rays diffraction, vibrational spectrometry and solid state 1H
Accepted manuscript
2. Experimental
2.1 Samples and thermal treatments
Three different samples were investigated in this study. Two commercial PCCs, named PCC-1 and PCC-2, were selected because of their different thermal behaviour. Indeed, the PCC-PCC-1 weight losses were more pronounced than the ones of sample PCC-2. This study was realised in partnership with Specialty Minerals Inc., the minerals producer of PCC-1 and PCC-2 under the respective trade names Albafil and Calofort U. A third GCC sample (Millicarb from
Omya) was used as a reference material exhibiting only a monotonic weight loss before the
thermal decomposition of carbonate. Table 1 gives the physical properties of the samples. The characterization made on the PCC-1 and GCC samples agreed with the indication given by the manufacturers. In the case of the PCC-2 the measured specific surface area was accurate but the median grain size and grain size distribution were larger than the given indications. This has to be explained by the grains agglomeration in this sample. Nevertheless the three samples presented quite equivalent physical characteristics. Figure 1 shows the thermal behaviour of these three samples from RT up to 825 K.
Thermal treatments were applied to these three calcium carbonates: 15 hours in a furnace from 325 K up to 775 K by steps of 50 K. Eleven samples (as-synthesized, 325 K, 375 K, 425 K, 475 K, 525 K, 575 K, 625 K, 675 K, 725 K and 775 K) for each carbonate (PCC-1, PCC-2 and GCC) were prepared for this work. The named as-synthesized samples in the text correspond to commercial as-received samples. Infrared and Raman spectroscopy experiments were also carried out on PCC-1 thermally treated at 500 K and 550 K. After each thermal treatment, samples were analysed by TGA to check the water content and were then stored in a dry box before being studied by the following different analytical techniques.
2.2 Thermal analyses
Thermogravimetric analyses (TGA) have been performed on a Mettler Toledo TGA_SDTA 851e apparatus. About 30 mg of powder were introduced in an alumina crucible. Measurements were realized from 300 K up to 1275 K with a heating rate of 5
K.min-1 under a nitrogen flow of 25 ml.min-1. A blank curve, obtained in the same
condition with the same empty alumina crucible, was systematically subtracted. Identification of the different weight losses was made by derivative DTA curves.
Accepted manuscript
Karl Fischer analyses (KF) were performed on a Metrohm coulometric model 756 titrator using a model 768 oven. Experimental KF parameters were optimized to be able to compare TGA and KF data, therefore the experiments were carried out in two steps: one at 393 K and the second one at 573 K (see Table 2). Other parameters like sample mass of
around 2 g; start and relative drift of around 15 mg.min-1 and nitrogen flow of around 60
ml.min-1 were applied.
2.3 Powder X-rays diffraction (PXRD)
Powder X-rays diffraction measurements were carried out in order to check the presence of portlandite in PCC. The weight loss measured at 725 K was close to 0.5 wt % (weight percent) which corresponds to approximately 2 wt % of portlandite (Figures 1 and 2). Long time measurements in a quite short two theta range were performed in order to obtain a good statistic counting that allowed to extract low intensity, and possibly broad, peaks from the background. X-rays powder patterns were recorded on a Siemens D5000 diffractometer at room temperature, Bragg-Brentano geometry, Cu Kα radiation (λ = 1.54184 Ǻ), two theta range 15-60°, two theta step 0.02°, 22 seconds per step leading to a measuring time of 14 hours for each sample. The chosen two theta range allowed
identification of portlandite by its non-overlapped diffraction peaks at 2θ = 18.06°, 34.14°
and 50.88° [7] and Rietveld refinement of CaCO3 structure (calcite type) by the presence of twelve Bragg peaks [7]. 20 wt % of pure silicon were added to the sample as internal standard in order to increase the accuracy in two theta position and to determine the instrumental resolution function of the diffractometer. Powder pattern Rietveld refinements were performed with FullProf.2k [8]. The diffraction peak profiles (both instrumental and intrinsic sample) were modelled by using a Thomson-Cox-Hastings pseudo-Voigt function [8] (convolution of Gaussian and Lorentzian components having
different full widths at half maximum, FWHM). Lattice parameter of Si (cubic Fd 3m
space group) was fixed at a = 5.43088 Å. Lattice parameters, oxygen position and
microstructure parameters of calcite (rhombohedral R3c with a = 4.988 Å and c = 17.061
Å [9]) were refined. Lattice and microstructure parameters of portlandite (trigonal P3m1
with a = 3.589 Å and c = 4.911 Å [10]) were refined when observed. Background pattern was modelled with a five coefficients polynomial function. The refined parameters from
the X-rays diffraction patterns are gathered in Table 3. The Rp and χ2 values indicate the
Accepted manuscript
correspond to 3σ weighted by χ2 in order to avoid an overestimation on the accuracy of
the refined parameters (σ is the standard deviation determined by FullProf.2k).
2.4 DRIFT spectroscopy
Diffuse Reflectance Infrared Fourier Transform (DRIFT) spectra were performed on a PerkinElmer System 2000 FTIR spectrometer equipped with a Diffuse Reflectance sphere accessory from SpectraTech. 5% of sample were intimately mixed and ground with pure KCl and background spectra were recorded with pure KCl only. Spectra were obtained at
4 cm-1 spectral resolution from 450 to 5600 cm-1, 15 scans (165 s), apodization "strong",
KBr beamsplitter, DTGS detector. For peak area measurements, spectra were previously
normalized on the calcite peak at 2512 cm-1 at the arbitrary absorbance unit of 0.3.
2.5 Raman spectroscopy
Raman spectra were performed on a Renishaw InVia Reflex Raman Microscope equipped with a CCD detector and a 514 nm laser source. Powder samples were analysed under a microscope using a x100 magnifying objective and laser power of around 10 mW at the
sample focus. Spectra were typically recorded from 100 to 4000 cm-1 (Notch filter) with a
1800 grooves.mm-1 grating leading to a spectral resolution of around 4 cm-1. 3 scans of 15
s were usually recorded. Like for DRIFT, spectra were normalized on a calcite band (1087
cm-1) before peak area measurements.
2.6 Solid state 1H MAS NMR
The solid state 1H MAS NMR spectra were recorded at room temperature with a Bruker
MSL300 spectrometer operating at 300.1 MHz. MAS spectra were performed at 14 kHz with a Bruker 4 mm MAS probes using a simple sequence (τ- acquisition). The processing and acquisition parameters were recycle time 5 s, 5 μs single π/2 pulse duration and 64
scans. The 1H chemical shifts are given in ppm and refer to tetramethylsilane (TMS) by
using adamantane as an external standard (1.74 ppm from TMS). The reproducibility of the measured chemical shift values was of around 0.1 ppm.
Accepted manuscript
X-rays fluorescence measurements have been realised on the three as-synthesized samples. Measurements have been performed in a semi-quantitative multi-elements analysis on a Bruker AXS S4 Pioneer equipment. The three samples present quite the same purity level with the same impurities (see Table 1). Magnesium is the main impurity presents at around 0.5 wt % expressed in elementary oxide: 0.41 wt % of MgO in GCC, 0.58 wt % in PCC-1 and 0.50 wt % in PCC-2. The others impurities are minors, with levels below 0.4 wt % for P2O5, below 0.2 wt % for SiO2, and even below 0.1 wt % for Al2O3, SrO, SO3 and Fe2O3, when applicable.
3. Results and discussion 3.1 Thermal analyses
The two weight losses observed at about 525 K and 725 K in case of PCCs are shown in Figure 1 by TGA and derivative curves. These two thermal events were characteristic of PCCs, as indicated by a comparison with the GCC TGA curve presenting only the monotonic weight loss from RT up to carbonate decomposition. The calculated weight loss values relative to each event were not the same in the two PCCs: PCC-1 weight losses were significantly larger than the PCC-2 weight losses: respectively 0.79 wt % and 0.24 wt % at around 525 K for respectively PCC-1 and PCC-2, and 0.59 wt % and 0.06 wt % at around 725 K for respectively PCC-1 and PCC-2. In the case of GCC, a very small weight loss of about 0.02 wt % can be observed for the first thermal event at around 525 K. A good agreement was found between TGA and KF analyses for the three samples (Table 2), bringing evidence for the assignment of the two weight losses to water releases. The higher values found for the PCCs by KF compared to TGA were due to a static thermal process versus a dynamical one by TGA. On the other hand, variations of the physisorbed water level due to storage conditions were not excluded. The smaller value obtained by KF for the GCC sample between 393 and 573 K (0.08% versus 0.16%) proves the contribution of the decarbonation process to the monotonic loss above 393 K. Thermal analyses coupled with mass spectroscopy on PCCs
confirmed these attributions to water release by evidencing two peaks coming from the OH+
signal at 525 K and 725 K [6]. Figure 2 indicates the weight losses calculated from TGA at 525 K (i.e. exclusively due to the first water release) and at 725 K (i.e. exclusively due to the second water release) according to the previously applied thermal treatment. The indicated water loss values in Figure 2 were obtained after removal, from TGA curves, of their own continuously monotone weight loss. This monotonic weight loss was extrapolated in two
Accepted manuscript
steps: i/ from a linear fit of the weight decrease from 300 K up to 455 K (the subtraction of this linear fit from the TGA curve, over the whole thermal range, allowed the determination of the weight loss corresponding only to the first thermal event); ii/ followed by a new linear fit performed on the as-obtained curve from 600 K up to 675 K (the new subtraction of the second linear fit allowed the determination of the weight loss corresponding only to the second thermal event). Not only the amounts of water losses did vary from one PCC to another, but also the ratio between the first and the second releases did. From 1.34 for PCC-1, it increased to 4.00 for PCC-2. Figure 2 illustrates also the irreversibility of both water releases: samples thermally treated above the thermal event did not show the corresponding weight loss anymore, contrarily to the reversible monotonic weight loss that was always observable for all the thermally treated samples, as usual with physisorbed water. As a matter of fact, PCCs usually contain a higher amount of surface adsorbed water molecules because of
their higher specific surface areas compared to GCC: in our case, respectively 7 m2.g-1, 26
m2.g-1 and 3 m2.g-1 for samples PCC-1, PCC-2 and GCC, as measured by nitrogen at 77 K
after an outgasing step at 120 °C (BET method, see Table 1). Moreover, the level of physisorbed water (Table 2) correlated well with the BET specific surface area extend. The water release observed at around 725 K should correspond to hydroxyl condensation of portlandite Ca(OH)2. The calculated weight losses led to portlandite amounts of 2.43 wt % and 0.25 wt % for respectively PCC-1 and PCC-2. These amounts indicated that portlandite could be detected by powder X-rays diffraction for PCC-1, but not in the case of PCC-2, whose Ca(OH)2 amount was clearly too small.
3.2 Rietveld analyses of the powder X-rays diffraction patterns
Rietveld analyses were performed for each as-synthesized samples and each thermally treated PCC-1, PCC-2 and GCC samples. Four phases were simulated as follow: i/ silicon Si (internal standard), ii/ calcite CaCO3 (largely majority phase), iii/ portlandite Ca(OH)2 (when observed) and iv/ lime CaO (when observed for thermal treatment above 725 K). Portlandite was identified in PCC-1 for thermal treatments above 475 K. It disappeared at 775 K and lime was observed. Figure 3 shows the evolution of the refined diffraction powder patterns when heating PCC-1. Careful analysis of low intensity peaks (see inserts in Figure 3) revealed that portlandite was not visible in the as-synthesized PCC-1 sample. No change was observed for treatments up to 425 K (powder patterns still correspond to top of Figure 3). Next, portlandite was identified for treatments between 475 K and 725 K,
Accepted manuscript
namely by broad diffraction peaks at 2θ = 18.0° and 34.2° (powder patterns corresponding
to middle of Figure 3). Finally, at 775 K, diffraction peaks of portlandite disappeared and those of lime appeared (powder pattern corresponding to bottom of Figure 3 with broad
peaks of CaO at 2θ = 32.1° and 37.3°). This confirms that the second thermal event
observed at about 725 K corresponds to the dehydroxylation of portlandite. It means that Ca(OH)2 is present in small amounts in PCCs, but not in GCC. In course of the PCC synthesis, few weight percent of amorphous Ca(OH)2 were precipitated together with CaCO3 formation. A heating treatment of almost 475 K led to its crystallization. The broad diffraction peaks of Ca(OH)2 indicated its very small coherent domain size (Table 3). The starting temperature of Ca(OH)2 crystallisation (i.e. 475 K according to the 15 hours thermal treatment) was close to the first thermal event (i.e. 525 K according to dynamical TGA experiments). These two simultaneous events (water release and portlandite crystallisation) could either be dependent or independent. In the hypothesis of dependent events it should indicate that amorphous portlandite contained excess water molecules and could be expressed as Ca(OH)2·xH2Oamorph. In this hypothesis, and according to TGA results, the x value would be of about 1.34 and 4.00 for PCC-1 and PCC-2, respectively. Refinement on diffraction patterns from PCC-2 and GCC did not allow the identification of portlandite. In case of PCC-2, the weight loss of 0.06 wt % observed at 725 K led to an amount of 0.25 wt % of Ca(OH)2, which is to small to be detectable by X-rays diffraction, even after crystallisation. In relation to GCC, no portlandite could be detected since no weight loss appeared in TGA at around 725 K. Figure 4 shows the evolution of calcite refined parameters as a function of the thermal treatments. PCCs did not show the same behaviour as GCC. X-rays fluorescence results on GCC and PCCs indicated that differences between samples could not been explained by the presence of impurities like Mg, Si, Al or Sr. Contrary to PCCs, the GCC lattice parameters were not sensitive to thermal treatments. In case of PCC lattice parameters evolution, we observed a break at 475 K. Before 475 K, the unit cell volume of PCC was superior to the one of GCC (and unit cell volume of 1 is superior to the one of PCC-2), and after the break at 475 K the three samples converged on the same unit cell volume. Positions of oxygen site in PCCs and GCC showed also some interesting evolutions (Table 3). Refined x coordinate of oxygen site in as-synthesized PCC and GCC samples were different (0.258 for synthesized PCC-1 and PCC-2 compared to 0.252 for as-synthesized GCC), but became equivalent after 525 K (0.257, 0.257 and 0.258 for respectively PCC-1, PCC-2 and GCC thermally treated at 575 K). This led to interesting
Accepted manuscript
evolution of the inter-atomic dCa-O distances: smaller in PCCs below 525 K, and identical in PCCs and GCC above 525 K. These several observations on calcite structure parameters showed that CaCO3 was affected by the first water release at around 525 K. It indicated that the first thermal event was due to a release of water molecules coming from the calcite structure: water inserted in the calcite structure as a limited solid solution CaCO3 - H2O. The previous hypothesis of excess water in amorphous Ca(OH)2·xH2Oamorph could not explain the observed variations in calcite structure parameters but, at this stage, we can not exclude the presence of some Ca(OH)2·xH2Oamorph though. ‘Structural’ water molecules inserted in the CaCO3 network induced a repulsive interaction with the oxygen coordinated to calcium atoms, leading to the refined small contraction of the dCa-O distance in PCCs (compared to GCC), which disappeared after 525 K. The calcite composition can be expressed as CaCO3·yH2O with y = 0.04 and 0.01, for respectively PCC-1 and PCC-2 samples. A very small weight loss was also observed for GCC at 525 K, corresponding to the composition CaCO3·0.001H2O. As-synthesized PCCs contain small amounts of amorphous portlandite and small amounts of water molecules inserted in their own crystallographic structure. Microstructure parameters did not show important changes according to the thermal treatment.
3.3 Vibrations
Vibrational spectroscopies, DRIFT and Raman, were performed on the three as-synthesized samples and on some thermally treated samples (mainly PCC-1 treated at
around 525 K). Figure 5 shows the wavenumber range 4000 cm-1 – 2000 cm-1 (water and
hydroxyl vibrations, along with calcite overtone and combination modes coming from
lattice or multiphonon absorptions [11]) and a zoom around 3644 cm-1 (A2u asymmetric
stretching mode of hydroxyls in portlandite). Figure 6 shows two zooms, around 1087 cm
-1 (A1g vibration mode of carbonate in calcite) and 3620 cm-1 (A1g symmetric stretching
mode of hydroxyl in portlandite) from the Raman spectra. Observations on hydroxyl vibrations modes were in perfect agreement with previously identified portlandite
crystallisation. Asymmetric stretching at 3644 cm-1 on DRIFT spectra and symmetric
stretching at 3620 cm-1 on Raman spectra are characteristic of portlandite [12, 13] and in
agreement with measurements performed on pure Ca(OH)2 samples, not shown here. As observed by X-rays diffraction, the signal of portlandite increased upon thermal treatment, indicating its crystallization process which occurred between 475 K and 500 K. Before
Accepted manuscript
this temperature treatment, the hydroxyl vibrations bands were already observable, but with a weaker intensity. This confirmed that Ca(OH)2 was already present in the as-synthesized samples but with a low crystallinity; i.e. amorphous state according to long range order necessary for X-rays diffraction. In its amorphous state, and due to hydrogen bonding, Ca(OH)2 hydroxyl vibrations can not be easily detected because they should
rather give rise to much broader signals occuring at a lower wavenumber than 3644 cm-1
in the DRIFT spectra (means within the broad water band centered at 3450 cm-1) or than
3620 cm-1 in the Raman spectra. The evolution of the relative amount of detected
portlandite, respectively in DRIFT and Raman studies, was determined by the integrated
peak area corresponding respectively to the A2u (OH-) and A1g (OH-) modes from
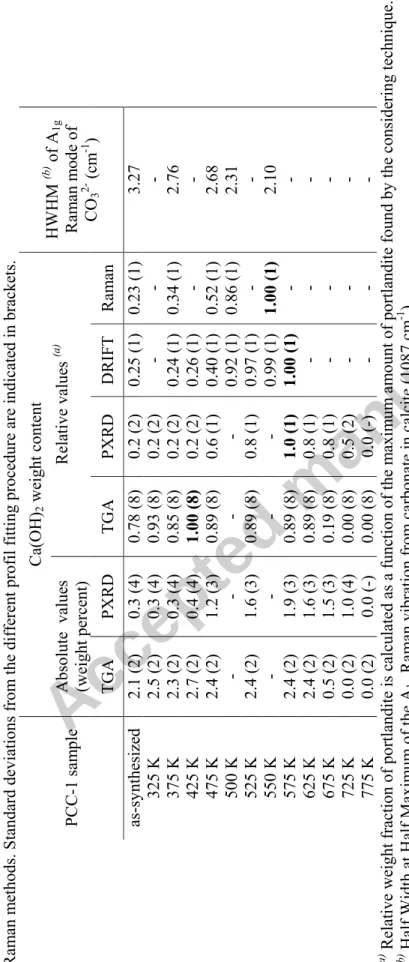
portlandite. In both cases, the maximum calculated peak area was assigned to a relative amount of 1.00. Table 4 indicates the calculated relative amounts (see also Figure 7) of portlandite together with the absolute values deduced from TGA and PDRX experiments. The differences between TGA relative values and the three other series come from the amorphous features of portlandite before 475 K.
The extremely broad band in DRIFT spectra, with maximum at around 3450 cm-1,
corresponds to stretching vibrations of hydroxyl bonds which could be assigned to four different species: i/ hydrogen bonded physisorbed water; ii/ water inserted in the calcite structure (hydrogen bonded 'structural' water, CaCO3·yH2O); iii/ over-stoechiometric water from amorphous portlandite (Ca(OH)2·xH2Oamorph) hydrogen bonded; and iv/ hydrogen bonded hydroxyls from amorphous portlandite. The number of species involved in this band makes its use inappropriate. Besides, the use of the bending mode of water
near 1620 cm-1 was not be possible due to the strong underlying carbonate modes in this
region. Moreover, the use of the first (ν + δ) water combination band at around 5200 cm-1
[14], which eliminates the contribution of hydroxyls from the amorphous portlandite, was not possible either because of the different kind of water involved and as well because this spectral range is strongly dominated by the physisorbed water contribution, whose level is
higher. This explained as well the differences in the intensity of the band at 3450 cm-1, as
seen in Figure 5 left, where it was more important in PCC-1 and quasi-absent in GCC, in good agreement with the physisorbed water level from KF (Table 2) and the specific
surface areas (Table 1). Finally, neither the mid infrared range (3450 or 1620 cm-1) nor the
near infrared one (near 5200 cm-1 for sole water contribution - no other changes relative to
Accepted manuscript
and 4000 cm-1 [14]) were usable to confirm the presence of excess water in the amorphous
portlandite.
The Raman spectra on CO32- A1g symmetric stretching vibration mode at 1087 cm-1,
characteristic of calcite [11], showed a sharpening of HWHM (half width at half maximum, as presented in Table 4) for samples thermally treated above 500 K. This indicates an increase of the local environment homogeneity of carbonate anions in the calcite structure. This observation is in agreement with the departure of some inserted water molecules from the calcite structure, and cannot be explained by the crystallisation process of portlandite, in agreement with the PXRD analyses.
3.4 Solid state 1H MAS NMR
Solid state 1H MAS NMR spectroscopy was performed on the three as-synthesised
samples and on thermally treated PCC-1 samples at 425 K, 475 K, 575 K and 725 K (Figure 8). Spectra from as-synthesised samples (top of Figure 8) underline the differences between PCC and GCC samples. Whereas free water was visible on the GCC spectrum by the line centred at chemical shift 4.8 ppm/TMS (indicated by a star in Figure 8), two other contributions centred at 8.6 ppm, and as well relative to water (one broad and one sharp part), are also present in the GCC spectrum. The two PCC spectra both exhibit one sharp signal at 10.3 ppm and one broad line with a higher area centred close to
9.0 ppm (9.1 ppm for PCC-1 and 8.7 ppm for PCC-2). A first interpretation of these 1H
NMR spectra seems to assign the fixed sharp contribution at 10.3 ppm to water inserted in the calcite structure and the broad contribution close to 9.0 ppm to amorphous Ca(OH)2. It must be noted that the well resolved spinning side bands were relative to the line at 10.3
ppm. Two facts can explain the sharpness of the line at 10.3 ppm: i/ 1H nuclei were
diluted in the CaCO3·yH2O solid solution resulting in a lowering of the 1H-1H
homonuclear dipolar coupling and then in a narrower line, ii/ the well-ordered crystalline structure reduced the possible number of slightly different environments, leading also to line width reduction. The spectrum obtained with a commercial portlandite sample is shown at the bottom of Figure 8 (dotted line). The crystallized Ca(OH)2 spectrum (extremely broad band at 5.1 ppm) was different from the contributions observed in the PCC samples. Nevertheless, this difference can be explained by the difference in crystallinity: in well crystallized Ca(OH)2, the proton coupling is optimized involving a
Accepted manuscript
agreed with these interpretations. Changes in the 1H NMR spectrum after a treatment at
425 K were low. On the contrary, drastic changes appeared for a treatment at 475 K: large decrease in intensity of the contribution at 10.3 ppm, in addition to sharpening and shift of the most important peak from 9.1 ppm to 8.9 ppm. Treatment at 575 K led to the same observations. The sharp contribution at 10.3 ppm significantly decreased and the main band centred at 8.8 ppm became sharper. Another broad contribution was well observable at 5.0 ppm chemical shift: it can be assigned to well crystallized portlandite. The spectrum from sample PCC-1 treated at 725 K showed the disappearance of the main band at 8.8 ppm and the broad band at 5.0 ppm. Taking into account the presence of their spinning side bands and their disappearance at 475 K (beginning of the first water release) the sharp band at 10.3 ppm was indeed assigned to water molecules inserted in the calcite structure. The broad line close to 9.0 ppm which became sharper and sharper, before disappearing at 725 K (temperature of the second water release), was indeed assigned to amorphous portlandite.
The 1H NMR signal of Ca(OH)2 contained in PCCs was different from the one of
commercial portlandite by both a shift of the maximum peak and its sharpness. Two facts had to be considered: i) the hydrogen bonds network could be completely different in Ca(OH)2·xH2Oamorph before crystallization of portlandite, ii) the nanometric feature of crystalline Ca(OH)2 in PCCs after 525 K (as indicated by PDRX patterns and Rietveld
refinements) can decrease the 1H-1H coupling. Nevertheless, an amount of well
crystallized portlandite was observable by the broad signal at 5.0 ppm after a treatment at
575 K. 1H NMR experiments showed again the simultaneity of the two phenomena upon
heating: disappearance of the contribution of structural water inserted in the calcite CaCO3·yH2O, simultaneously with the crystallisation process of portlandite. But no evidences were brought about the possible excess water present in amorphous portlandite Ca(OH)2·xH2Oamorph.
4. Conclusion
Three distinct water releases were observed in PCCs: one monotonic up to the carbonate
dissociation, and two thermal events at 525 K and 725 K. Solid state 1H MAS NMR
spectroscopy confirmed the existence of three sets of proton in PCCs, leading to three different natures of water. The water content in PCCs is sample dependent, which means synthesis dependant. A complete characterization of these PCC water releases should give
Accepted manuscript
information about their natures, and subsequently information about the improvements to implement in the PCC synthesis process. The monotonic water release has been associated to physisorbed surface water molecules and early decarbonation (also present in case of GCCs). Identification of the second thermal event at around 725 K was clearly assigned to portlandite Ca(OH)2 dehydroxylation. Ca(OH)2 was present and at amorphous state in the as-synthesized PCCs. Its crystallisation happened at about 525 K (Figure 7), simultaneously with the first water release. These two simultaneous phenomena were not linked. PXRD (Figure 4) and Raman spectroscopy (right insert, Figure 7) gave indication about the nature of the first water release which results from departure of water molecules inserted in the calcite structure. The reaction occurring at 525 K was CaCO3·yH2O → CaCO3 + y H2O. An amount of 0.001 inserted water molecule per mole of CaCO3 was estimated for GCC, and this amount reached 0.01 and 0.04 in case of PCC-2 and PCC-1 respectively. The compositions of the three commercial studied calcium carbonates were the following: GCC was a ground calcium carbonates composed at 100% by CaCO3·0.001H2O, PCC-2 was a precipitated calcium carbonate composed by 0.25 wt % of amorphous Ca(OH)2 and 99.75 wt % of CaCO3·0.01H2O, and PCC-1 was a precipitated calcium carbonate made of 2 wt % of amorphous Ca(OH)2 and 98 wt % of CaCO3·0.04H2O. Physisorbed surface water molecules could not be estimated from the TGA curves as the beginning of the carbonate decomposition contributes also to the monotonic weight loss (simultaneously to the progressive physisorbed water departure). Besides, we can suppose that the origin of the inserted water present in PCCs was due to the speed of the synthesis process. Referring to the PCCs synthesis reactions (1) and (2) given in the introduction, a less than complete stoichiometric reaction (2) can easily explain the presence of a residue of Ca(OH)2 and a quick precipitation rate during reaction (2) can be at the origin of some H2O trapped into the structure of the freshly precipitated calcite.
Acknowledgements
The authors would like to thank Specialty Minerals Inc. for providing the PCC samples and for giving permission to publish the present results.
Accepted manuscript
References
[1] K. Yang, Q. Yang, G. Li, Y. Sun and D. Feng, Mater. Lett., 60(6) (2006) 805, and references therein.
[2] K. K. Mathur and D. B. Vanderheiden, Polymer Modifiers and Additives, Chapt. 5, edited by J. T. Lutz Jr. and R. F. Grossman, Marcel Dekker, 2001.
[3] Y. S. Han, G. Hadiko, M. Fuji and M. Takahashi, J. Eur. Ceram. Soc., 26(4-5) (2006) 843, and references therein.
[4] S. Kobe, G. Drazic, P. J. McGuiness, T. Meden, E. Sarantopoulou, Z. Kollia and A. C. Cefalas, Mater. Sci. Eng. C, 23(6-8) (2003) 811, and references therein.
[5] D. M. Ansari, ECC International Ltd. Patent WO 2000 012434.
[6] A. Labrosse, F. Villiéras, Internal Report: "Synthèse, flottation, épuration et morphologie des carbonates de calcium précipités". LEM-GRESD, Nancy, June 1999.
[7] JCPDS – International Centre for Diffraction Data, PDF2 Data Base, release 2001, ID 87-0673 for portlandite, and ID 88-1807 for calcite.
[8] J. Rodriguez-Carvajal, PROGRAM FullProf.2k – version 3.30, Laboratoire Léon Brillouin (CEA-CNRS), France, 2005 (FullProf.2k manual available on http://www-llb.cea.fr/fullweb/fp2k/fp2k_divers.htm). See also J. Rodriguez-Carvajal, T. Roisnel, EPDIC-8, 23-26 May 2002, Trans. Tech. Publication Ltd, Uppsala, Sweden, Materials Science Forum 123 (2004) 443.
[9] H. Effenberger, K. Mereiter and J. Zemann, Zeit. Krist., 156 (1981) 233. [10] H. E. Petch, Acta Cryst., 14 (1961) 950.
[11] W. B. White, in The Infrared Spectra of Minerals, ed. V. C. Farmer, Mineralogical. Society, London, monograph no. 4, 1974, pp. 227-284.
[12] H. D. Lutz, H. Möller and M. Schmitt., J. Mol. Struct., 328 (1994) 121. [13] O. Oehler and Hs. H. Günthard, J. Chem. Phys. 48, 5 (1968) 2036. [14] S. J. Gaffey, Jour. Sed. Petrology, 58, 3 (1988), 397-414.
Accepted manuscript
Tab le 1 Phy sic al charac teriza tion (grain s iz es distribution, specific su rface area a nd grain sh ap e) and ele m ental analy sis of th e th re e a s-sy nt hes ized sam ples. PCC-1 P CC-2 G CC G rai n siz es di stri bu tion (a ) (V olum e d ist ribution) D (v, 0.1) ( µm) D (v, 0.5) ( µm) D (v, 0.9) ( µm) Sp an 0.58 0.81 1.36 1.0 0.8 9 3.0 9 9.1 7 2. 7 0.97 3.40 8.45 2.2 S pec ific surface a rea (m 2 .g -1 ) (b ) 7 26 3 G rai n s hape pris m atic prism ati c Round a nd irre gu la rly rhom bohedral X -ray s fluorescence analy sis (w t %) CaO MgO PO2 5 SO 3 Fe2 O3 SrO 98.8 0.58 0.36 0.10 0.07 0.05 CaO MgO SiO2 SO 3 Al2 O3 99.2 0.50 0.19 0.07 0.07
CaO MgO SiO
2 Al2 O3 99.4 0.41 0.11 0.07 (a ) m easured by laser granulom et ry w ith a Mal vern Ma stersize r In strum ent u sing the dry -sievi ng technique. (b ) m easured by nitrogen at 7 7 K after a n out gasi ng step a t 393
K and using the BET m
et
ho
Accepted manuscript
Tab le 2 Com pa ri son of TGA weight l osses and K arl F ischer (KF ) water contents for the three a
s-sy nthesized sam ples. TGA weight l os s (w t % ) KF wate r c on tent (wt %) Sam ple s RT – 3 93K 393 - 573 K RT – 393K 393 - 573K PCC-1 0.17 0.88 0.2 2 1.00 PCC-2 0.49 0.80 0.5 0 0.83 GCC 0.19 0.16 0. 17 0.08
Accepted manuscript
Tab le 3 Structure a nd m icrostructure para m eters Riet veld refine m ent re sults on as-s yn th esized and therm
ally -tre ated PCC-1 , P CC-2 and G CC sam ples. Measur em ents Calci te refine m ent Portlandit e refinem ent Sa m pl e Th er m al tre atm ent a (Å) c (Å) V (Å 3 ) Ox yg en x (a ) (b ) Grain size (Å) Strai n (‰) (c ) Q ua ntitat ive analy sis (d ) (b ) Gra in size (Å ) St ra in (‰) (c ) R p, χ 2 (e ) as-sy nthesiz ed 4.9984(6) 17 .040(2) 368.69 (7) 0.2583(4) 750 2.75 0.3( 4) - - 0.077, 2. 35 325 K 4.9994(3) 17 .046(1) 368.9 8(4) 0.2592(4) 750 2.75 0.3( 4) - - 0.064, 1 .57 375 K 5.0000(4) 17 .047(2) 369.08 (5) 0.2589(4) 850 2.50 0.3( 4) - - 0.068, 1 .68 425 K 5.0006(7) 17 .055(3) 369.3 5(9) 0.2583(5) 750 2.50 0.4( 4) - - 0.078, 2 .42 475 K 4.9951(6) 17 .066(5) 368.8 (1) 0.2577(6) 650 2.75 1.2( 3) 50 10 .75 0.083, 2 .90 525 K 4.9948(4) 17 .069(2) 368.7 9(7) 0.2561(5) 650 2.75 1.6( 3) 50 10 .50 0.074, 1 .97 575 K 4.9907(4) 17 .060(2) 368.00 (6) 0.2570(4) 600 2.50 1.9( 3) 50 11 .50 0.069, 1 .73 625 K 4.9884(3) 17 .060(1) 367.6 6(4) 0.2562(4) 650 2.50 1.6( 3) 100 9. 00 0.064, 1 .45 675 K 4.9894(3) 17 .065(2) 367.9 2(5) 0.2555(4) 700 2.50 1.5( 3) 100 6. 00 0.071, 1 .82 725 K 4.9880(3) 17 .064(1) 367.67 (4) 0.2570(4) 750 2.50 1.0( 4) 100 9. 25 0.064, 1 .59 PCC-1 775 K 4.9876(5) 17 .065(2) 367.6 3(8) 0.2562(5) 650 2.50 - 0.075, 2 .28 as-sy nthesiz ed 4.9931(3) 17 .052(2) 368.16 (5) 0.2576(4) 500 2.25 - 0.070, 1. 56 325 K 4.9936(5) 17 .053(3) 368.2 5(7) 0.2591(5) 750 2.50 - 0.076, 2 .21 375 K 4.9931(4) 17 .051(2) 368.1 5(5) 0.2585(4) 600 2.75 - 0.064, 1 .48 425 K 4.9944(4) 17 .053(2) 368.3 8(7) 0.2577(4) 650 2.50 - 0.073, 1 .85 475 K 4.9904(9) 17 .056(5) 367.9 (1) 0.2580(6) 750 2.75 - 0.078, 3 .23 525 K 4.9909(2) 17 .062(1) 368.06 (4) 0.2570(4) 550 2.50 - 0.061, 1 .35 575 K 4.9884(3) 17 .060(1) 367.64 (4) 0.2573(4) 550 2.50 - 0.061, 1 .36 625 K 4.9868(6) 17 .066(3) 367.5 5(9) 0.2568(6) 650 2.50 - 0.083, 2 .40 675 K 4.9843(6) 17 .064(3) 367.1 4(8) 0.2573(5) 550 2.75 - 0.078, 2 .34 725 K 4.9847(3) 17 .075(1) 367.4 4(4) 0.2566(4) 500 2.75 - 0.062, 1 .34 PCC-2 775 K 4.9834(4) 17 .076(3) 367.47 (7) 0.2569(5) 500 3.00 - 0.082, 2 .34 as-sy nthesiz ed 4.9870(7) 17 .049(4) 367.2 (1) 0.2520(5) 450 2.75 - 0.084, 2. 64 325 K 4.9897(9) 17 .057(2) 367.8 (1) 0.2504(6) 500 2.75 - 0.088, 2 .97 GCC 375 K 4.9889(4) 17 .055(3) 367.61 (6) 0.2530(5) 650 2.75 - 0.081, 2 .38
Accepted manuscript
425 K 4.9893(6) 17 .056(3) 367.69 (9) 0.2558(5) 500 2.50 - 0.082, 2 .65 475 K 4.9888(8) 17 .054(4) 367.6 (1) 0.2550(6) 550 2.50 - 0.090, 2 .98 525 K 4.9879(8) 17 .053(4) 367.4 (1) 0.2581(6) 600 2.50 - 0.085, 3 .19 575 K 4.9910(6) 17 .063(3) 368.1 (1) 0.2576(5) 800 2.50 - 0.095, 3 .03 625 K 4.9888(4) 17 .056(2) 367.62 (7) 0.2576(5) 750 2.50 - 0.077, 2 .41 675 K 4.9887(3) 17 .056(2) 367.6 0(5) 0.2564(4) 800 2.50 - 0.074, 1 .94 725 K 4.9855(3) 17 .050(2) 366.99 (4) 0.2571(4) 700 2.50 - 0.078, 2 .05 775 K 4.9886(5) 17 .058(2) 367.63 (7) 0.2564(5) 800 2.50 - 0.070, 2 .35 (a ) indicates the refine
m
ent of the oxy
gen atom s posi tion in site 18 e ( x, 0, ¼) in ca lcit e s tru ct ure, (b ), (c ) c orre spond respective ly to average apparent coherent dom ai n siz e and average m axim al strai n, (d ) is the q ua nt itat ive Riet veld determ in ation of portlandi te in the sam ple in w ei ght %, and (e ) indica
tes the factors
agree
m
ent of the refin
em ent. Standa rd deviat ions i ndi cated i n bra ckets correspo nd to 3 σ weighte d b y χ 2 .
Accepted manuscript
Tab
le 4.
A
bsolute and relati
ve quant itat ive a naly ses of Ca(OH) 2 in P CC-1 by TGA extrapola tions, PX RD Riet veld r efinem ents, DRIFT and Ram an m ethods. S tandard deviat ions from the diffe rent profil fit
ting procedure are i
ndicate d in brackets. Ca(O H )2 w eight content Abso lu te value s (weight perce nt ) Rela tive value s (a ) PCC-1 sam ple TG A PX RD TG A P X RD D R IFT Ram an HWH M (b ) of A 1g Ram an m ode of CO 3 2- (cm -1 ) as-sy nthesize d 2.1 (2) 0.3 (4) 0.78 (8 ) 0.2 ( 2) 0.25 (1) 0. 23 (1) 3.27 325 K 2.5 (2) 0.3 (4) 0.93 (8 ) 0.2 ( 2) - - - 375 K 2.3 (2) 0.3 (4) 0.85 (8 ) 0.2 ( 2) 0.24 (1) 0. 34 (1) 2.76 425 K 2.7 (2) 0.4 (4) 1.00 (8 ) 0.2 ( 2) 0.26 (1) - - 475 K 2.4 (2) 1.2 (3) 0.89 (8 ) 0.6 ( 1) 0.40 (1) 0. 52 (1) 2.68 500 K - - - - 0.92 (1) 0. 86 (1) 2.31 525 K 2.4 (2) 1.6 (3) 0.89 (8 ) 0.8 ( 1) 0.97 (1) - - 550 K - - - - 0.99 (1) 1. 00 (1) 2.10 575 K 2.4 (2) 1.9 (3) 0.89 (8 ) 1.0 ( 1) 1.00 (1) - - 625 K 2.4 (2) 1.6 (3) 0.89 (8 ) 0.8 ( 1) - - - 675 K 0.5 (2) 1.5 (3) 0.19 (8 ) 0.8 ( 1) - - - 725 K 0.0 (2) 1.0 (4) 0.00 (8 ) 0.5 (2 ) - - - 775 K 0.0 (2) 0.0 (-) 0.00 (8) 0.0 (-) - - - (a ) Relat
ive weight fract
ion of po rt landite is ca lcul ated as a f uncti on of the m axim um am ount of portlandit e foun d by the conside ring technique. (b ) Half Width a t H alf Maxi m um o f t he A 1g Ram an vibra tion from carbonate i n calci te (1087 cm -1 ).
Accepted manuscript
Figures captions
Figure 1. Thermogravimetric analyses of GCC (A; showing only the monotonic weight loss due to physisorbed water), as-synthesized PCC-1 and PCC-2 (respectively B and C; showing the two studied thermal events superimposed to the monotonic weight loss) from RT up to 825 K. TGA curves (a) and derivative curves (b) are shown.
Figure 2. Weight losses calculated from the TGA curves for the first thermal event at about 525 K (a, ■) and the second thermal event at about 725 K (b, ●) for GCC (A), PCC-1 (B) and PCC-2 (C). The calculations have been performed after removal of the monotonic weight loss (i.e. without taking into account the physisorbed water). Dashed lines are only guides for eyes.
Figure 3. Rietveld plots of as-synthesized PCC-1 (a), thermally-treated at 525 K (b) and thermally-treated at 775K (c). Observed (dots) and calculated (black lines) powder patterns (λ = 1.5418 Ǻ) are shown with the difference curve (lines above). The ticks indicate the Bragg peak positions of Si, CaCO3, Ca(OH)2 and CaO. Small amounts of Ca(OH)2 and CaO were detected; see arrows in the inserts in (b) and (c).
Figure 4. Rietveld analysis on calcite phase from GCC (A), PCC-1 (B) and PCC-2 (C): evolution of lattice parameter a (a), lattice parameter c (b) and unit cell volume (c). Dashed lines are only guides for eyes.
Figure 5. DRIFT spectra realized on as-synthesized samples (a, range 4000 - 2000 cm-1), and
thermally-treated samples (b, range 3660 – 3620 cm-1, with indication of the temperature of
treatment, bold lines for as-synthesized samples). Spectra were recorded on GCC (A), PCC-1 (B) and PCC-2 (C).
Figure 6. Raman spectra on PCC-1 thermally-treated at 375 K, 475 K, 500 K and 550 K;
carbonate vibration from calcite (a, range 1070 cm-1 to 1100 cm-1) and hydroxyl stretching
mode from portlandite (b, range 3500 cm-1 to 3750 cm-1).
Figure 7. Relative weight fraction of portlandite determined by DRIFT, Raman, TGA and PXRD as a function of thermal treatment of PCC-1 (a). Dashed line and dotted curve are only guides for eyes for respectively the total (i.e. amorphous and crystallized) relative amount of portlandite as determined by TGA, and the relative amount of crystallized portlandite as determined by DRIFT, Raman and PXRD. Evolution of the Half Width at Half Maximum (HWHM) of the A1g carbonate vibration for PCC-1, from the Raman spectra, is shown in insert (b). Error bars correspond to the standard deviations of the different profile fitting procedures.
Figure 8. Solid state 1H MAS NMR spectra on as-synthesized samples (a) and on thermally-treated PCC-1 samples with portlandite Ca(OH)2 (dotted line) as a comparison (b). Spectra (A) correspond to GCC, (B) to PCC-1 and (C) to PCC-2. Stars (*) indicate the contribution of physisorbed water. ‘S’ indicates the position of the spinning sidebands.