E L S E V I E R Magnetic Resonance Materials in Physics, Biology and Medicine I0 (2000) 18-26
MAGMA
Magnetic Resonance Materials in Physics, Bkdogy 'and Medicinewww.elsevier.com/locate/magma
Assessment of prosthetic aortic valve performance by magnetic
resonance velocity imaging
Ren6 Botnar a,,, Eike Nagel
b
Markus Beat Scheidegger
a
Erik Morre Pedersen c,
Otto Hess b, Peter Boesiger
a
~' Institute oJ" Biomedical Engineering, Unirersi O, of Zurich and Swiss Federal Institute of Technology, Zurich, Switzerhmd b pepartment of btternal Aledichw, Cardiology, University Hospital Zurich, Zurich, Switzerhmd
c O{Tartment of Carcliothoracic and Vascular Surgery and Institute of E.vperimental Clinical Research, dartms University Hospital. Aarhus, Denmark
Received 17 May 1999; received in revised form 13 August 1999; accepted 26 August 1999
Abstract
Objectives: Magnetic resonance (MRI) velocity mapping was used to evaluate non-invasively the flow profiles of the ascending aorta in normal volunteers and in patients with an aortic (mechanical) wtlve prosthesis.
Background: In patients with artificial aortic wtlves the flow profile in the ascending aorta is severely altered. These changes have
been associated with an increased risk of thrombus formation and mechanical hemolysis.
Methods: Velocity profiles were determined 30 mm distal to the aortic valve in six healthy volunteers and seven patients with aortic valve replacement (replacement within the last 2 years) using ECG triggered phase contrast MRI. Peak flow, mean flow and mean reverse flow were measured in intervals of 25 ms during the entire heart cycle. Systolic reverse flow, end-systolic closing and diastolic leakage volume were calct, lated for all subjects.
Results: Peak flow velocity during mid-systole was significantly higher in patients with valvular prosthesis than in normals (mean • SD, 1.9 + 0.4 m/s vs. 1.2 + 0.03 m/s, P < 0.001) with a double peak and a zone of reversed flow close to the inner (left lateral) wall of the ascending aorta of the patients. Closing volume was significantly larger in patients than in controls ( - 3.3 _+ 1.2 ml beat vs. - 0.9 ___ 0.5 ml/beat; P < 0.001). There was reverse flow during systole in valvular patients amounting to 15.7 ___ 6.7%
of total cardiac output compared to 2.3 + 1.2% in controls (P < 0.001). Diastolic mean flow was negative in patients after valve replacement but not in controls ( - 11,0 • 15.2 ml/beat vs. 6.8 _+ 3.2 ml/beat: P < 0.01).
Conclusions: The following three major quantitative observations have been made in the present study: (1) Mechanical valve prostheses have an increased peak flow velocity with a systolic reverse flow at the inner (left lateral) wall of the ascending aorta. (2) A double peak flow velocity pattern can be observed in patients with bileaflet (,mechanical) prosthesis. (3) The blood volume required for leaflet closure and the diastolic leakage blood volume are significantly higher for the examined bileaflet valve than for native heart valves. <9 2000 Elsevier Science B.V. All rights reserved.
Keywords: Aortic flow; Magnetic resonance velocity mapping; Prosthetic cardiac valves; Bileaflet ~alves; Reverse flow; Aortic stenosis
1. Introduction
Since the first use o f c a r d i a c valve p r o s t h e s e s in 1951 b y C h a r l e s H u f n a g e l m o r e t h a n 50 different valve p r o s - theses h a v e been i m p l a n t e d . T o d a y c a r d i a c valve replace-
* Corresponding author. Present address: Beth Israel Deaconess Medical Center, Cardiovascular Division, Cardiac MR Center, 330 Brookline Avenue, Boston, MA, 02215, USA. Tel.: + 1-617-6671747; tax: + 1-617-9755480.
E-mail a&lre.~w: [email protected] (R. Botnar)
1352-8661 00 S - see front matter (i', 2000 Elsevier Science B.V. All rights PII: S 1 3 5 2 - 8 6 6 1 ( 9 9 ) 0 0 0 7 2 - 1
m e n t has b e c o m e a r o u t i n e p r o c e d u r e ( w o r l d w i d e 175 000 p e r year), but there are still u n s o l v e d l o n g - t e r m issues. The m o s t severe p r o b l e m s a r e t h r o m b o s i s , h e m o l y s i s a n d tissue o v e r g r o w t h [ 1 - 4 ] . T h e s e p r o b l e m s are m a i n l y d e p e n d e n t on valve design, b l o o d flow velocity a n d t u r b u l e n c e fields [ 5 - 1 1 ] . R e g i o n s o f slow flow, reversed flow a n d flow s e p a r a t i o n m a y p r o m o t e f o r m a t i o n o f b l o o d clots, l e a d i n g to t h r o m b u s f o r m a t i o n a i d cere- b r o v a s c u l a r e m b o l i z a t i o n [12]. A n t i c o a g u l a t i o n g r e a t l y reduces the incidence o f t h r o m b o e m b o l i s m , b u t is asso- ciated with an increased risk o f h e m o r r h a g e .
R. Botnar et al. . Magnetic Resonance Materials in Physics, Biology and Medicine I0 (2000) 18-26 19 The purpose of the present study was (1) to investi-
gate the utility of magnetic resonance (MR) flow veloc- ity m a p p i n g for measuring blood flow patterns in the ascending aorta of patients with an aortic valve pros- thesis; and (2) to study the differences in velocity and flow patterns between these patients and a group of volunteers with healthy native valves. The presence of abnormal flow patterns distal to different types of mechanical valve prostheses has been described b o t h under in-vitro conditions and in experimental animals [10:13-19]. Due to the complexity of the flow velocity fields distal to a prosthetic valve and lack of accurate non-invasive measurement techniques, precise measure- ments are difficult to obtain and only a few studies have been performed in humans [20-23].
In the present study a short echo-time MRI-tech- nique was applied [24-27]. It allows for the assessment of blood flow velocities across the entire area of the ascending aorta with high temporal and spatial resolu- tion. We hypothesize that the flow patterns a m o n g those with native valves represent aortic flow under normal physiologic conditions. The performance of a valvular prosthesis should therefore be optimal if simi- lar flow patterns are observed.
2. Materials and methods
2. I. M a t e r i a l s
We studied six healthy adult volunteers (male, mean age, 27 years, range, 25-28) and seven patients (male, mean age, 66 years, range, 61-71) with bileaflet aortic prosthesis implanted 1 - 2 years prior to study. All patients were in stable condition with no evidence of valve dysfunction on echocardiographic examinations. No patient had s y m p t o m s suggestive of coronary artery disease and all had no evidence of disease on c o r o n a r y angiograms prior to surgery. In the patient collective mean systolic blood pressure was 138 m m H g + 1 6 m m H g and mean heart rate was 71 + 10 b p m (mean + SD).
2.2. Mag~vetic r e s o n a n c e t, e l o c i t y m a p p i n g
Written infom~ed consent was obtained from all sub- jects. Measurements were performed on a t.5 Tesla Phitips N T whole body scanner. The subjects were examined in prone position with a prototype cardiac receiver coil. An E C G gated T u r b o Field Echo (TFE)
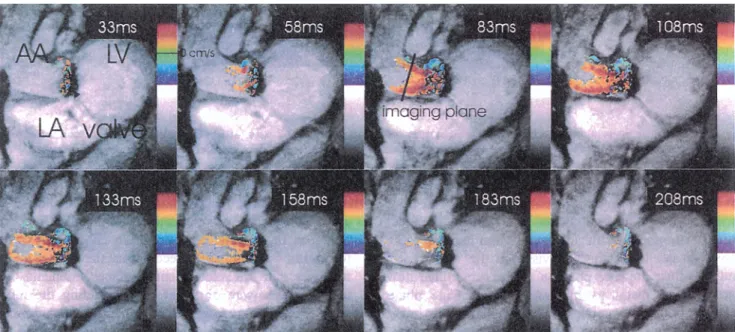
Fig. 1. Color-coded velocity images of the aortic outflow tract during systolic contraction in a patient after aortic valve replacement. The mechanical bileaflet valve causes a disk shaped black artifact. Art imaging plane through the left ventricle (LVL Ieft atrium (LA) and ascending aorta (AA) has been chosen for flow visualization. Temporal resolution is 50 ms per frame. The image plane of the subsequent through plane flow measurement is indicated as white bar. Red colors stand for antegrade, blue for retrograde flow.
20 R. Bomar et aI. /Magnetic Resonance Materials #~ Physics, Biology and Medicb?e I0 (2000) 18-26
a)
b)
Fig. 2. Axial flow velocity images through the ascending aorta 30 mm above the aortic annulus. A normal volunteer (a) and a patient with mechanical valve prosthesis of the bileaflet type (b) are shown during systolic ejection. The brightness of the images is proportional to forward flow velocities tke darkness to retrograde flow velocities. Temporal resolution is 25 ms per frame. R: right, L: left, A: anterior, P: posterior.
AI
7;? r
systole
. . . t . : ~ I ~ - ~ ~' -- ] r,', r : : ~ t ~ ! 1 , ; e b ! ~ ~N;~ I, i!11'9 '1 ~;.!l,;:[!i!'?'~ 'i ~ ~ b I "B)
systole
. . . . r - . ., r t ~' ~
e n d - d i a s t o l e
c
,~/,(,/
t,~,!l
s ~ ~ [ - t I ,~ ~ ,~.l,~ ' ,. ',,,, {: ~.. " T ~ - - ~ "t i m e
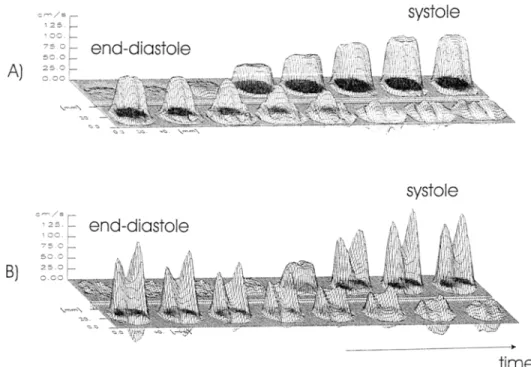
Fig. 3. Flow velocity maps in the ascending aorta during systolic ejection in a normal volunteer (a) and in a patient with a mechanical valve (b). a, b) Top left frame: end-diastole; top right frame: systole, bottom right frame: early diastole. Temporal resolution is 25 ms per frame. sequence with three orthogonal slice packages was used
to determine the orientation of the aortic valve or prosthesis. A double-angulated TFE image was ac- quired orthogonal to the aortic valve and parallel to the proximal ascending aorta to visualize the velocity jets and to adjust the slice position of the subsequent flow measurement distal to the aortic valve. Cin~ phase velocity mapping was performed parallel to this imag- ing plane (Fig. 1) and orthogonal (Fig. 2) to the ascend- ing aorta approximateIy 30 mm (1 annulus diameter) distal to the aortic valve.
To reduce image artifacts due to local blood flow acceleration and turbulence, a short echo time (TE =
2.Sms (13 roT/m, 45 m T / m / m s ) - 6 . 4 ms (10 roT/m, 10 roT/m/ms)) partial echo (62.5% of the full echo) ECG gated phase contrast sequence was applied. After zero filling of the missing echo samples a 2D-Fourier trans- formation was applied to reconstruct the images of the reference and the velocity encoded measurements. Ve- locity images were obtained by subtracting the refer- ence from the corresponding velocity encoded phase images. Velocity encoding was set according to the maximal expected blood flow velocity and varied be- tween 120-280 cm/s. In-plane velocity maps were used to visualize the velocity jets originating from the differ- ent orifices of the prosthetic valves along the course of
R. Bomar et al. / Magnetic Resonance Materhds in Physics. Biology and Medicine 10 (2000) 18-26 21 the a o r t a (Fig. 1). T h r o u g h - p l a n e velocity images al-
lowed distinguishing between antegrade and retrograde flow (Figs. 2 and 3).
T h e slice thickness was 10 mm, field o f view 350 x 280 m m 2 and image matrix 256 x 204 resulting in an in-plane resolution o f 1.37 x 1.37 m m 2. T h e time reso- lution was 25 ms and the echo time varied between 3 and 6 ms. Velocity c o m p e n s a t e d and velocity encoded m e a s u r e m e n t s were p e r f o r m e d in consecutive heart phase intervals. Acquisition time was 5.8 min for a heart rate o f 70 beats/min.
2.3. Velocity &zta analysis
D a t a analysis was p e r f o r m e d on a D E C - A l p h a (Dig- ital E q u i p m e n t C o r p o r a t i o n , U S A ) w o r k s t a t i o n with a flow analysis software package developed at o u r institu- tion. Vessel c o n t o u r s are either d r a w n manually or
using m o v a b l e and d e f o r m a b l e ellipses. The c o n t o u r identification can either be d o n e on the m o d u l u s or the velocity (phase) images o f each heart phase. T h e ob- tained c o n t o u r s are copied to the c o r r e s p o n d i n g m o d - ulus or velocity (phase) images. After vessel wall segmentation t h r o u g h - p l a n e m e a n flow (Fig. 4), peak velocity (Fig. 5), m e a n f o r w a r d and mean reverse flow (Fig. 6) are calculated for each heart phase. Peak flow velocity was defined for each heart phase as the highest velocity value measured within the lumen o f the aorta. M e a n flow rate per second is defined as sum o f m e a n f o r w a r d and mean reverse flow rate. Linear interpola- tion was used to estimate m e a n flow rates per beat. To allow p r o p e r c o m p a r i s o n o f different subjects the time axis is normalized by defining end-systole (100%) as the time o f the zero crossing o f mean flow rate (Fig. 4). Using the a p p r o a c h o f Y o g a n a t h a n , closing a n d leak- age volume were defined [28]. Integration o f the m e a n M e a n F l o w R a t e 600 la e.., -200 4 -- ' -- -- l . -- -- p a t i e n t s : N p = 7 - - - v o l u n t e e r s : N v = 6 t - - l e a k a g e v o l u m e - - 0 25 50 75 100 125 150 Time to endsystole [ %]
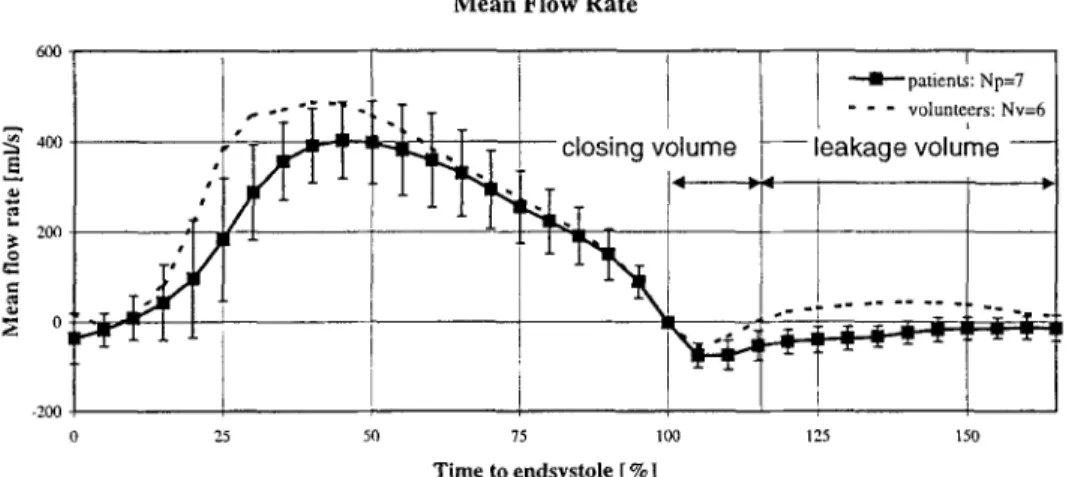
Fig. 4. Mean flow rate ( 4- standard deviation) over time in six vohmteers (dashed) and seven patients alter aortic valve replacement (line). During systole no significant differences in mean flow rate can be observed bnt during diastole flox,, is significantly lower in patients and becomes even negative dne to leakage flow. Definitions of closing and leakage volume are given accordingly to Yoganathan [28]. X-axis: time normalized lbr end-systole; Y-axis: mean flow rate.
1
2000 84 1500 "~ woo 500 2500 P e a k V e l o c i t y I F " p a d e n ~ : N p = 7 - " - v o l u n t e e r s : N v = 6 25 50 75 100 125 150 Time to endsystole [%]Fig. 5. Peak flow velocity ( + standard deviation) in six volunteers (dashed) and seven patients with a mechanical bileaflet valve (line). During early systole peak rio,,,,' is significantly higher in patients with valvular prosthesis than in controls probably due to the smaller valve o,ifice. Diastolic peak flow velocities are similar in the two groups. )(-axis: time normalized for end-systole: Y-axis: peak flow velocity.
22 R. Botnar et al./'Magnetic Resonance Materials in Physics, Biology atul Medichw tO (2000) 18-26 M e a n R e v e r s e F l o w R a t e 40[ T [ l [ "-'41-- patients: Np=7 0 . - 1 2 0 - 1 6 0 ~ 0 25 50 73 too 125 15o Time to endsystole [ %]
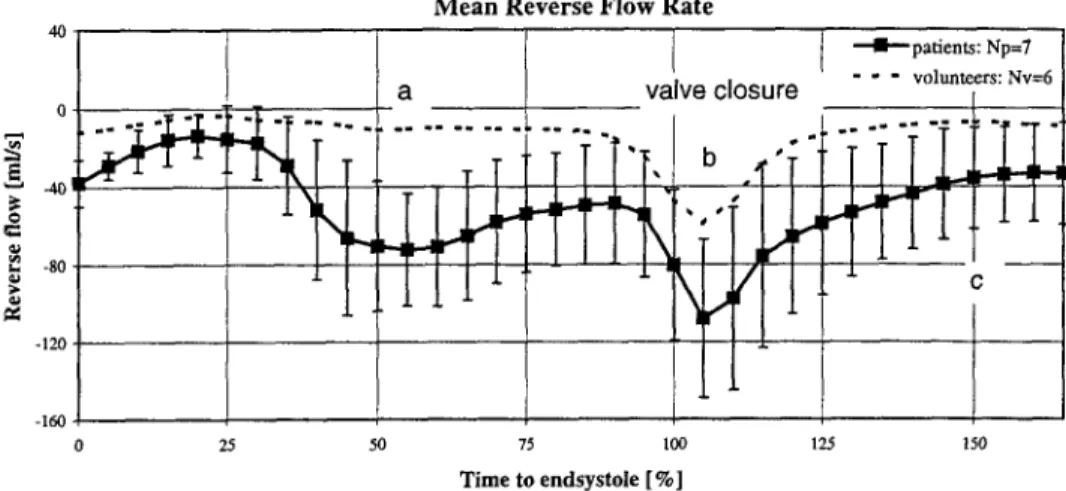
Fig. 6. Mean reverse flow-rate ( + standard devaition) over time in six volunteers (dashed) and seven patients with mechanical bileaflet valves (line). In controls only a small reverse flow can be seen during systolic ejection with a large peak during valve closure (end-systole: 100%). In contrast, valvular patients show a large reverse flow during systolic ejection with a peak during valve closure. X-axis: time normalized for end-systole; Y-axis: mean reverse flow rate.
flow rate fl'om 100 to I15"/,, of end-systole was defined as closing volume and the integral from 115% of end-systole to the next R-wave as diastolic flow volume. The velocity maps are visualized as 3D-mesh plots with the underlying corresponding gray-vahte coded velocity map on a high resolution video monitor (Fig. 3).
2.4. Statistics
All data a,'e represented as mean _+ SD. The unpaired Student's t-test was applied for comparisons of mean values between patients and normal volunteers. Signifi- cance was defined by a P value of _< 0.05.
3. R e s u l t s
All patients and volunteers completed MR studies without incidence. Representative in-plane and through-plane velocity images of a volunteer and a patient are shown in Fig. l and Fig. 2, respectively. The quality of the phase maps (Fig. 2) suggest that no significant flow voids were present. A horizontal imag- ing plane through the left ventricle (LV)', left atrium (LA) and ascending aorta (AA) has been chosen for flow visualization (Fig. 1). The valve prosthesis can be observed as a black disk. The flow velocities distal to the prosthetic valve are displayed as color encoded images overlaid on an anatomical background image of the aortic outflow tract. Three antegrade velocity jets, two marginal and one central are visible throughout systole. During early systole, the marginal jets follow the curvature of the aorta. Then, from mid-systole to end-systole, the two outer jets run parallel to each other and are relatively orthogonal to the valvular plane. Due to susceptibility artifacts of the prosthesis ring, flow
velocities are noisy in the vicinity of the valve.
A 3D-reconstruction of the flow velocities in the ascending aorta is depicted in Fig. 3 for a normal volunteer and a patient with bileaflet prosthesis. In the normal subject, a flat flow profile can be observed during systolic ejection with some flow reversed during early diastole. In contrast, the patient with mechanical valve shows two large peaks during systolic ejection with simultaneous systolic backward flow and large early diastolic reverse flow ( = closing volume).
3.1. Flow velocity ~&ta
Mean flow rates are calculated by integration of flow velocities over the vessel areas (Fig. 4). From end-dias- tole to end-systole no significant difference in mean flow rate can be observed in patients with mechanical valves. A significant difference in mean flow rate can be observed during valve closure ( - 3.3 + 1.2 ml/beat vs.
- 0.9 + 0.5 ml:beat; P < 0.001) and during diastole ( - 11.0 + 15.2 ml/beat vs. + 6.8 + 3.2 ml/beat; P < 0.01) revealing slight leakage flow in patients with a valvular prosthesis. The measured values for each subject are presented in Table 1.
Temporal changes in peak flow velocity are similar during early systole (Fig. 5). However, during systolic ejection significantly higher peak flow velocities (1.9 + 0.4 m/s vs. 1.2 _+ 0.03 m/s; P < 0.001) can be observed in patients with mechanical valves than in controls. During early and mid-diastole, peak flow velocities are similar for valvular patients and controls (P > 0.2)
3.2. Retrograde flow
There were significant differences in retrograde flow between patients and controls (Fig. 6) during mid-sys
R. Bomar et al. / Magnetic Resonance Materials in Phy.~ics, Biology and Medichw 10 (2000) 18-26 23 t o l e ( a ) ( - 72 _+ 29 ml/s vs. - 1 1 _ + 1 1 ml/s; P < 0 . 0 0 1 )
a n d also during diastole (c) ( - 36 _+ 26 ml/s vs. - 7 _+ 9 ml/s; P < 0.04). A tendency o f increased reverse flow volume was observed during end-systole (b) ( - 108 _+ 41 ml/s vs. - 59 _+ 26 ml/s; P < 0.07) (valve closure).
3.3. A o r t i c d i a m e t e r
T h e diameter o f the a o r t a was significantly higher in valvular patients (36 _+ 2 m m vs. 30 + 2 ram, P < 0.001).
4 . D i s c u s s i o n a n d c o n c l u s i o n s
A n increasing n u m b e r o f patients require aortic valve replacement because Of degenerative aortic valve disease. Non-invasive assessment and follow up o f valve perfor- mance is, therefore, i m p o r t a n t to detect valve dysfunc- tion in a p p r o p r i a t e time. D o p p l e r e c h o c a r d i o g r a p h y represents currently the gold s t a n d a r d for detection o f valve dysfunction but newer techniques such as M R imaging m a y provide more detailed information with regard to flow distribution, presence or absence o f a n t e g r a d e or retrograde flow jets as well as a n a t o m y o f the ascending aorta.
Previous h e m o d y n a m i c e x a m i n a t i o n s o f artificial heart valves have used e c h o c a r d i o g r a p h i c methods for diagno- sis o f valvula," dysfunction [28-30]. However, these studies have so far been limited to one-dimensional flow profiles, except from perioperative studies [31], and the results m a y be observer dependent with variable image
quality and interobserver variability. F o r the description o f the mechanical function o f valve prostheses quantita- tive data on ante- a n d retrograde blood flow volumes m a y provide additional information.
C o m p a r e d to e c h o c a r d i o g r a p h y , M R I b l o o d flow measurements not only allow determination o f regional blood flow velocities, but also overall blood flow rate t h r o u g h the aortic valve. Therefore, accurate predictions can be obtained on ante- a n d retrograde flow, closing and leakage blood volumes as well as systolic and diastolic mean and peak flow velocities.
This study d e m o n s t r a t e s that using a short echo time phase velocity m a p p i n g technique, it is possible to obtain quantitative i n f o r m a t i o n a b o u t the blood velocity distri- bution across the whole vessel area d o w n s t r e a m o f artificial mechanical heart valves. The measurements can be obtained with a high spatial (1.37 • 1.37 ram-') and temporal (25 ms) resolution. Only neglectable flow voids due to turbulence k n o w n to be present d o w n s t r e a m o f artificial heart valves also in-vivo [16,20] were seen. This is in a c c o r d a n c e with recent in-vitro studies o f velocity fields at artificial heart valves using magnetic resonance phase velocity m a p p i n g [18,19].
4.1. L # l l i t a t i o n s
In this study only patients without signs o f valvular dysfunction were examined. T h e usefulness o f the pre- sented technique for the assessment of valve dysfunction therefore still has to be proven. However, it can be expected that for mild and m o d e r a t e aortic stenoses, this Table I
Values are mean + SD of the volunteer group and the patient group for closing volume, diastolic flow volume (leakage volume), systolic reverse flow volume and aortic diameter ~
Patient Closing volume (ml/beat) Diastolic flow volume (leakage volume) (ml beat) Mean aortic diameter (ram)
1 - t.6 - 1.7 35 "~ -2.6 -4.9 38 3 -3.5 -37.0 32 4 -2.2 0.0 37 5 -3.8 -2.1 38 6 -4.7 -3.4 33 7 -4.6 -28.6 37 Mean - 3.3 - 11.0 36.0 SD 1.2 15.2 2 Vohmteer 1 - 0 . 8 12.2 32 2 -0.03 5.6 28 3 - 1.3 5.8 27 4 - 1.4 5.2 32 5 - 1.3 8.7 31 6 -0.6 3.3 31 Mean - 0.9 6.8 30 SD 0.5 3.2 2 P value <0.001 <0.01 <0.001
" All quantities were quantified 30 mm distal to the aortic valve, and the prosthetic aortic valve, respectively. Instead of leakage volume, diastolic flow volume was quantified in volunteers. Leakage was only observed in patients with prosthetic valves.
24 R. Botnar et al./'Magnetic Resonance Materials in Physics, Biology and Medic#w 10 (2000) 18-26
technique still provides reliable phase maps and there- fore information about the hemodynamic performance of valvular prosthesis.
All examined patients had surgery 1-2 years prior to the MR examination. This short time span therefore did not allow studying aging effects of prosthetic valves. By selecting another patient population these effects, however, should be accessible with the pre- sented technique,
The patient and the volunteer population of the presented study were not age matched. This might cause a bias in the comparison of the both groups. The finding that MR allows for the assessment of flow fields (jet like flow, closing volume, leakage volume) distal to prosthetic valves, however, should not be influenced by this fact.
MRI-velocity mapping is furthermore limited to a certain extent by image artifacts, which are caused by turbulent blood flow, and in-plane flow [32-34]. Reli- able images can be acquired with very short echo times as they can be achieved with new MR-scanners using partial echo acquisition scheme like the one presented here. The metallic ring of the artificial valve induces severe image artifacts and, thus, flow velocities can be assessed only in a certain distance from the valve. In-vitro studies carried out in our lab showed that reliable flow measurements still can be performed in a distance of a ~ of the diameter of the valve [35]. At this location even the central high velocity jet, which is assessed by Doppler echocardiography to estimate the pressure drop, could be assessed. In-vivo measure- ments, however, are subject to valvular motion, which, if not compensated for can cause artifacts and phase drifts due to the metallic ring of the prosthesis. Kozerke and co-workers [36] therefore suggested adapting the slice position for each single heart phase. In the present study this technique was not incorporated and therefore it only allows for aortic flow measurements at a certain distance to the aortic valve plane ( > 15mm). Because of this limitation the central peak velocity jet that is assessed by US cannot be measured and one is limited to the assessment of the two outer velocity jets that remain visible also further downstream. Kozerke and co-workers [36] also showed that without valvular mo- tion correction early diastolic retrograde flow is overes- timated by about 20%. This number might be, however, smaller in patients with aortic regurgitation where over- all diastolic retrograde flow is increased.
Since the slice location is distal to the coronary ostia, coronary blood flow and aortic compliance might cause a bias of the results as described by Chatzimavroudis and co-workers [37]. Incorporating slice tracking in future measurements, however, should compensate for these errors. Prospective triggering does not allow the assessment of late diastole unless the measurement is performed over two heartbeats. This seems, however,
only to be a small limitation since diastolic blood flow is slow with only small temporal variations. Extrapola- tion of diastolic flow should therefore only result in minor errors. Temporal resolution of the MR measure- ments is less than for Doppler echocardiography but likely adequate for assessing valvular function in the clinical setting.
4.2. Clinical aspects
High velocity jets, as they are measured in artificial heart valves, but do not occur in healthy natural valves, are associated with turbulent blood flow. These velocity jets may increase regional wall shear stress and favour dilatation as well as local aneurysm formation. This may be more severe if the valve is not properly aligned and the jet is directed towards the wall. Proper align- ment of the valve prosthesis within the aorta and appropriate sizing of the valve are, therefore, of clinical importance to reduce regional wall stress and aneurysm formation.
Clinical evaluation of artificial heart valves by MRI might thus become more important since these velocity maps can be achieved non-invasively. From these mea- surements, information on valve function, prosthesis alignment and presence of transvalvular or paravalvu- lar jets can be obtained. This high degree of detail might allow the disclosure of even minor quantitative hemodynamic changes over time in individual patients. Further repeatability studies are needed to clarify these issues.
The following three major quantitative observations have been made in the present study: (1) Mechanical aortic valve prostheses induce an increased peak flow velocity with a systolic reverse flow at the inner (left lateral) wall of the ascending aorta. (2) A double peak flow velocity pattern is observed in patients with bileaflet (mechanical) prosthesis. (3) The blood volume for leaflet closure and the diastolic leakage volume are significantly higher than blood volume for leaflet clo- sure in native aortic valves.
In conclusion magnetic resonance flow velocity map- ping is a promising tool for a detailed, quantitative non-invasive assessment of the hemodynamic valvular performance in patients with valve prostheses.
Acknowledgements
We acknowledge the support of EUREKA and the Swiss Commission for Technology and Innovation; Philips Medical Systems, Best, The Netherlands; De- sir6e and Niels Foundation, Denmark; The Danish Heart Foundation and Sulzer Innotec, Winterthur, Switzerland. We also like to thank Dr Warren Manning for helpful discussions.
R. Botnar et a l . / Magnetic Resonance Materials in Physics, Biology and Medichw 10 (2000) 18-26 25
References
[1] Bodnar E, Yacoub M. Biologic and Bioprosthetic valves. New York: York Medical Books, 1986.
[2] Bodnar E, Frater R. Replacement Cardiac Valves. New York: Pergamon Press, 1991.
[3] Butchart EG, Bodnar E. Thrombosis, embolism and bleeding. UK: ICR Publishers, 1992.
[4] Roberts WC. Choosing a substitute cardiac valve, type, size, surgeon. Am J Cardiol 1976;38:633-44.
[5] Chandran KG, Cabell GN, Khalighi B, Chen CJ. Laser anemometry measurements of pulsatile flow past aortic valves. J Biomech 1983;16:865-73.
[6] Chandran KG, Cabell GN, Khalighi B, Chen CJ. Pulsatile flow past aortic valve bioprosthesis in a model human aorta. J Biomech 1984; 17:609-19.
[7] Woo Y-R, Yoganatfian AP. In vitro pulsatile flow velocity and turbulent shear stress" measurements in the vicinity of mechani- cal aortic heart valve prosthesis. Life Support Syst 1985;3:283 312.
[8] Woo Y-R, Yogan,lthan AP. In vitro pulsatile flow velocity and turbulent shear stress measurements in the vicinity of mechani- cal mitral heart wive prosthesis. J Biomech 1986:19:39-51. [9] Yog,'mathan AP, Woo Y-R, Sung H-W, Williams FP, Franch
RH, Jones M. In vitro hemodynamic characteristics of tissue bioprosthesis in the aortic position. J Thorac Cardiowlsc Surg
1986:92:198 209.
[10] Yoganathan AP, Woo Y-R, Sung H-W. Turbulent shear stress measurements in the vicinity of aortic heart valve prosthesis. J Biomech 1986;19:433 42.
[ll] Yoganathan AP, Sung H-W, Woo Y-R. In vitro velocity and turbulence mcasurcments in the vicinity of three new mechani- cal aortic heart valve prostheses, J Thorac Cardiovasc Surg
1988:95:929 39.
[12] Schoephoerster RT, Oynes F, Nunez G, K:lpadvanjwala M, Dewanjee MK. Effects of local geometry and fluid dynamics on regional platelet deposition on artificial surlaces. Arte- rioscler Thromb 1993:13:1806- 13.
[13] Tillmann W, Reul H. Herold M, Bruss KH, Van Gilse J. In-vitro walt shear stress measurements at aortic valve prosthe- sis. J Biomech 1984:17:263-79.
[14] Hasenkam JM, Giersiepen M, Reul H. Three-dimensional visu- alization of velocity fields downstream of six mechanical aortic valves in a pulsatile flow model. J Biomech 1988;21:647-61. [15] Hasenkam JM, Westphal D, Nyg:tard H, Reul H. Giersiepen
M, Stodkilde-Jorgensen H. In vitro stress measurements in the vicinity of six mechanical aortic valves using hot-film anemometry in steady-flow. J Biomech 1988:21:235-47. [16] Hasenkam JM, Pedersen EM, Ostergaard JH, Nygaard P,
Paulsen PK, Johannsen G, Schurizek BA. Velocity fields and turbulent stresses downstream of biological and mechanical aortic valve prosthesis implanted in pigs. Cardiovasc Res 1988:22:472-83.
[17] Grigg L, Fulop J, Daniel L, Weisel R, Rakowski H. Doppler echocardiography assessment of prosthetic heart valves. Echocardiography 1990;7(2):97-114.
[18] Walker PG, Pedersen EM, Oyre S, Flepp L, Ringaard S, Hein- rich RS, Walton SP, Hasenkam JM, Stodkilde-Jorgensen H, Yoganathan AP. Magnetic resonance velocity imaging: a new method for prosthetic heart valve study. J Heart Valve Dis 1995:4:296-307.
[19] Fontaine AA, Heinrich R, Walker PG, Pedersen EM, Scheideg- ger MB, Boesiger P, Walton SP, Yoganathan AY. Comparison of MRI and LDA velocity measurements downstream of pros- thetic heart valves: Implications l\~r in vivo assessment of pros-
thetic valve function. J Heart Valve Dis 1996;5:66-73.
[20] Paulsen PK, Hasenkam JM, Stodkilde-Jorgensen H, Albrecht- sen O. Three-dimensional visualization of velocity profiles in the ascending aorta in humans with normal aortic valves and after insertion of St Jude Medical and Starr-Edwards Silastic Ball valves in the aortic position, lnt J Artif Organs 1988;11(4):277-92.
[21] Nygaard H, Paulsen PK, Hasenkam JM, Kromann-Hansen O, Pedersen EM, Rovsing PE. Quantitation of the turbulent shear stress distribution downstream of normal, diseased and artifi- cial aortic valves in humans. Cardiothorac Surg 1992;6:609-17. [22] Houlind K, Eschen O, Pedersen EM, Jensen T, Hasenkam JM,
Paulsen PK. IVlagnetic resonance imaging of blood velocity distribution around St Jude Medical aortic valves in patients. J Heart Valve Dis 1996;5:51 I-7.
[23] Kilner P J, Yang ZY, Mohiaddin RH, Firmin DN, Longmore DB. Helical and retrograde secondary flow patterns in the aortic arch studied by three-dimensional magnetic resonance velocity mapping. Circulation 1993;88:2235-47.
[24] Nayler GL, Firmin DN, Longmore DB. Blood flow imaging by cine magnetic resonance imaging. J Comp Assist Tomogr
1986;12:715 22.
[25] Stahlberg F. Thomsen C. Sondcrgaard L, Henriksen O. Pulse sequence design for MR velocity mapping of complex flow: notes on the necessity of low echo times. Magn Reson Imaging 1994:12(8):1255 62.
[26] Botnar R, Schcidegger MB, Boesiger P. Qt.antitication of blood [low patterns in human vessels by magnetic resonance imaging. Technol Health Care 1996;4:97 112.
[27] Botnar R, Rmgaard S, Hirt F. Pedersen EM, Scheidegger MB, Boesiger P. Assessment of velocity fields downstream of pros- thetic heart valves by magnetic resonance imaging, in-vivo and in-vitro studies. Proceedings, Fourth Scientific Meeting, New York. Berkeley. CA, Society of Magnetic Resonance in Medicinc, 1996. p. 696
[28] Yoganathan AP. Cardiac valve prosthescs. In: Bronzino JD, editor. The Biomcdical Engineering Handbook. Boca Raton: CRC, 1995:1847 -70.
[29] Reisner SA. Meltzer RS. Normal values of prosthetic valve Doppler echocardiographic parameters: a review. J Am Soc Echo 1988:1:201 -- 10.
[30] Goldrath N, Zimes R, Vered Z. Analysis of Doppler-obtained velocity curves in functional evaluation of mechanical pros- thetic valves in the mitral and aortic positions. J Am Soc Echo 1988;1:211-25.
[31] Wiseth R, Samstad S, Rossvoll O, Torp HG, Skjaerpe T, Hatle L. Cross-sectional left ventricular outflow tract velocities before and alter aortic valve replacement: a comperative study with two-dimensional Doppler ultrasound. J Am Soc Echocardiogr 1993;6:279- 85.
[32] Spielmann RP. Schneider O, Thiele F, Heller M, Biicheler E. Appearance of poststenotic jets in MRI: dependence on flow velocity and imaging parameters. Magn Reson Imag 1991;9:67-72.
[33] Stfihlberg F, Sondergaard L, Thomsen C. Henriksen O. Quan- tification of complex flow using MR phase imaging-a study of parameters influencing the phase/velocity relation. Magn Reson Imag 1992:10:13-23.
[34] Urchuk SN, Plewes DB. Mechanisms of flow-induced signal loss in MR-angiography. J Magn Reson Imaging 1992;4:453- 62.
[35] Botnar R, Ringgaard S, Hirt F, Pedersen EM, Scheidegger MB, Boesiger P. Assessment of velocity fields downstream of prosthetic heart valves: in-vivo and in-vitro studies. In: Pro- ceedings, ISMRM. Fourth Annual Meeting, New York, 1996. p. 696.
26 R. Botnar et al. / Magnetic Resonance Materials in Physics, Biology attd Medicine I0 (2000) 18-26
[36] Kozerke S, Scheidegger MB, Pedersen EM, Boesiger P. Heart motion adapted cine phase contrast flow measurements through the aortic valve. In: Proceedings, ISMRM, Sixth Annual Meet- ing, Sydney, 1998, p. 277.
[37] Chatzimavroudis GP, Walker PG, Oshinski JN, Franch RH, Pettigrew RI, Yoganathan AP. Slice location depend~nce of aortic regurgitation measurements with phase velocity mapping. Magn Res Med 1997;37:545-51.