HAL Id: hal-03037787
https://hal.sorbonne-universite.fr/hal-03037787
Submitted on 3 Dec 2020HAL is a multi-disciplinary open access archive for the deposit and dissemination of sci-entific research documents, whether they are pub-lished or not. The documents may come from teaching and research institutions in France or abroad, or from public or private research centers.
L’archive ouverte pluridisciplinaire HAL, est destinée au dépôt et à la diffusion de documents scientifiques de niveau recherche, publiés ou non, émanant des établissements d’enseignement et de recherche français ou étrangers, des laboratoires publics ou privés.
stiffness in patients with tricuspid or bicuspid aortic
valve aortopathy using magnetic resonance imaging
Ariel Pascaner, Sophia Houriez–Gombaud-Saintonge, Damian Craiem, Umit
Gencer, Mariano Casciaro, Etienne Charpentier, Kévin Bouaou, Alain de
Cesare, Thomas Dietenbeck, Yasmina Chenoune, et al.
To cite this version:
Ariel Pascaner, Sophia Houriez–Gombaud-Saintonge, Damian Craiem, Umit Gencer, Mariano Cas-ciaro, et al.. Comprehensive assessment of local and regional aortic stiffness in patients with tricuspid or bicuspid aortic valve aortopathy using magnetic resonance imaging. International Journal of Car-diology, Elsevier, 2020, �10.1016/j.ijcard.2020.11.046�. �hal-03037787�
Comprehensive assessment of local and regional aortic stiffness in patients with tricuspid or bicuspid aortic valve aortopathy using magnetic resonance imaging
Ariel F. Pascaner1,6*, Sophia Houriez--Gombaud-Saintonge2,3,4,6*, Damian Craiem1,6,
Umit Gencer5,6, Mariano E. Casciaro1,6, Etienne Charpentier5,6, Kevin Bouaou2,4,6,
Alain De Cesare2,4,6, Thomas Dietenbeck2,4,6, Yasmina Chenoune3,6, Nadjia Kachenoura2,4,6,
Elie Mousseaux5,6, Gilles Soulat5,6, Emilie Bollache2,4,6
1Instituto de Medicina Traslacional, Trasplante y Bioingeniería (IMETTyB), Universidad Favaloro –
CONICET, Buenos Aires, Argentina
2Sorbonne Université, CNRS, INSERM, Laboratoire d’Imagerie Biomédicale, LIB, Paris, France 3ESME Sudria Research Lab, Paris, France
4Institute of Cardiometabolism and Nutrition (ICAN), Paris, France
5Département de Radiologie Cardiovasculaire, Hôpital Européen Georges Pompidou - INSERM U970,
PARCC, Paris, France
6This author takes responsibility for all aspects of the reliability and freedom from bias of the data
presented and their discussed interpretation *AFP and SHGS share co-first authorship
Corresponding author
Emilie Bollache
Laboratoire d'Imagerie Biomédicale LIB - Campus des Cordeliers-Escalier A-3e étage
75006 Paris, France
emilie.bollache@inserm.fr +33 1 01 44 27 90 11
Grant support: PIP #1220130100480 (CONICET, Argentina), PICT #2016-0945 (MINCyT, Argentina), ESME Sudria (France), ECOS-SUD project #A15S04 (France-Argentina), FRM #ING20150532487 (France) and Interface pour le Vivant (IPV) PhD program (Sorbonne Université, France).
Conflicts of interest: The authors report no relationships that could be construed as a conflict of interest
Abstract
Background: We aimed to provide a comprehensive aortic stiffness description using magnetic resonance imaging (MRI) in patients with ascending thoracic aorta aneurysm and tricuspid (TAV-ATAA) or bicuspid (BAV) aortic valve.
Methods: This case-control study included 18 TAV-ATAA and 19 BAV patients, with no aortic valve stenosis/severe regurgitation, who were 1:1 age-, gender- and central blood pressures (BP)-matched to healthy volunteers. Each underwent simultaneous aortic MRI and BP measurements. 3D anatomical MRI provided aortic diameters. Stiffness indices included: regional ascending (AA) and descending (DA) aorta pulse wave velocity (PWV) from 4D flow MRI; local AA and DA strain, distensibility and theoretical Bramwell-Hill (BH) model-based PWV, as well as regional arch PWV from 2D flow MRI. Results: Patient groups had significantly higher maximal AA diameter (median[interquartile range], TAV-ATAA: 47.5[42.0-51.3]mm, BAV: 45.0[41.0-47.0]mm) than their respective controls (29.1[26.8-31.8] and 28.1[26.0-32.0]mm, p<0.0001), while BP were similar (p≥0.25). Stiffness indices were significantly associated with age (ρ≥0.33), mean BP (arch PWV: ρ=0.25, p=0.05; DA distensibility: ρ=-0.30, p=0.02) or AA diameter (arch PWV: ρ=0.28, p=0.03; DA PWV: ρ=0.32, p=0.009). None of them, however, was significantly different between TAV-ATAA or BAV patients and their matched controls. Finally, while direct PWV measures were significantly correlated to BH-PWV estimates in controls (ρ≥0.40), associations were non-significant in TAV-ATAA and BAV groups (p≥0.18). Conclusions: The overlap of MRI-derived aortic stiffness indices between patients with TAV or BAV aortopathy and matched controls highlights another heterogeneous feature of aortopathy, and suggests the urgent need for more sensitive indices which might help better discriminate such diseases.
Introduction
Ascending thoracic aortic aneurysm (ATAA) resulting from a pathological dilation of the ascending aorta, and bicuspid aortic valve (BAV)-related aortopathy are both associated with an increased risk of dissection and rupture [1]. Therefore, their early detection is crucial to prevent the occurrence of such acute critical events. While the management and treatment of patients with aortic disease are currently based on aortic diameter and its growth rate [1], there have been controversies regarding purely geometric and non-tailored descriptors since even small ascending aortas can dissect [2]. With the advent of non-invasive imaging techniques, novel biomarkers have been proposed as a complement to aortic size to better understand the pathological progression of dilation and help improve individual patient risk assessment and thus surgical decisions.
Arterial stiffening, which is associated with alterations in large artery wall structure and elasticity as well as blood flow hemodynamics, has been shown to be a strong independent predictor of cardiovascular events and morbidity as well as all-cause mortality in several populations [3]. Indeed, elasticity of the thoracic aorta plays a major role in damping pulsatility of pressure and flow waves generated by the beating left ventricle, and is used as a clinical surrogate for cardiovascular disease risk. As such, an almost two-fold increase in the risk of developing cardiovascular events and mortality was reported in subjects with increased aortic stiffness [3]. Besides applanation tonometry [4–6], numerous imaging studies previously investigated elastic properties of the central aorta in vivo in patients with either a BAV or a tricuspid aortic valve and ATAA(TAV-ATAA), using ultrasound [4,7–17], cardiovascular magnetic resonance imaging (MRI) [18–22], or computed tomography [23]. However, most works comparing against controls did not match populations for age [22], gender [16], blood pressure [5,6,9,10,17–19,22] or valve impairment such as stenosis or regurgitation [10–12,14– 17,20,21], which have known confounding effects on arterial stiffness. In the remaining studies, conflicting findings were reported as to whether aortic stiffness in aortopathy remains unchanged [4,8,22], or increases [4,7,8,13] as reflected by significantly reduced strain and distensibility or elevated pulse wave velocity (PWV).
Accordingly, the main objective of this case-control study was to provide a comprehensive description of both local and regional aortic stiffness, as assessed non-invasively using MRI, in patients with either a BAV or a TAV and ATAA, in comparison with healthy volunteers. To discard potential confounders, careful matching for age, gender and central blood pressures was performed and we studied only patients without significant valve dysfunction. A secondary objective was to test in such patients the validity of the Bramwell-Hill theoretical model describing the relationship between aortic distensibility and PWV.
Methods
Participants
We retrospectively identified based on chart review, all patients with TAV-ATAA, as well as all patients with a BAV and ascending aortic (AA) dilation, who underwent a standard-of-care thoracic aortic MRI along with 3D, time-resolved, three-directional velocity-encoded (4D flow MRI) acquisitions and simultaneous measurement of central blood pressures. ATAA was defined by a maximal diameter over the AA ≥ 41 mm or ≥ 22 mm/m² when normalized by body surface area (BSA). Exclusion criteria were: concomitant presence of aortic valve stenosis, regurgitation (AR) graded more than moderate, aortic coarctation, Marfan or Turner syndrome, history of aortic dissection and previous surgery. Aortic valve function as well as BAV confirmation and fusion pattern according to Sievers classification were evaluated using conventionally acquired stacks of 2D cine anatomical and velocity images perpendicular to the aortic root. Each patient was retrospectively 1:1 matched, in terms of age as well as sex and central blood pressures as close as possible, to healthy volunteers from an already existing prospective local MRI cohort of 57 individuals free of overt cardiovascular disease. Approval from the local ethics committee and subjects informed consent were obtained.
Data acquisition
Healthy volunteers were scanned on a Discovery MR750w GEM (3T, GE Healthcare, Chicago, IL, USA) and patients were scanned either on the Discovery MR750w, a SIGNA Architect (3T) or SIGNA
Artist (1.5T, GE Healthcare). Gadolinium-based contrast agent was typically injected (0.1 to 0.2 mmol/kg) prior to acquisitions. Central blood pressures were recorded simultaneously to MRI using the Sphygmocor Xcel device (AtCor Medical, Australia) [24]. Three measurements were averaged to provide central systolic (SBP), diastolic (DBP) and pulse (PP = SBP-DBP) pressures. Mean pressure was also collected. Aortic 2D phase-contrast (PC) and 4D flow data were acquired, along with 3D anatomical data using either a spoiled gradient-recalled echo (SPGR, at 3T) or steady-state free precession (SSFP, 1.5T) MRI sequence.
Through-plane 2D PC data were acquired during breath-holding, in an axial plane perpendicular to both the mid-ascending aorta and descending aorta at the level of the right pulmonary artery, with a pixel size of 1.24 x 1.24 mm², slice thickness ranging from 5 to 8 mm and acquired temporal resolution of 22 ms reconstructed to 11 ms. 4D flow MRI data were acquired during free breathing, in a sagittal-oblique 3D volume encompassing the thoracic aorta. Acquired spatial and temporal resolutions ranged within 1.3-2.4 x 2.0-2.7 mm² and 33-51 ms, respectively, with a reconstructed pixel size = 1.3-1.7 x 1.4-2.7 mm², slice thickness = 1.0-2.6 mm and a reconstructed temporal resolution = 15-25 ms. An acceleration factor of 3 to 4 was used (ESPIRiT or kat-ARC). For both sequences, retrospective ECG gating and view sharing were used, and single encoding velocity Venc was set to 160-400 cm/s according to the suspected presence of aortic valve stenosis. Finally, 3D anatomical data were acquired in a volume including the thoracic aorta in a sagittal-oblique view during diastolic phase using ECG gating, slice thickness = 3.2 mm and the smallest in-plane pixel size amongst acquisitions which was 0.67 x 0.67 mm, to provide a better depiction of aortic borders and a more accurate measurement of maximal diameter over the AA. More detailed scan parameters are provided in Supplementary Table S1.
Analysis of 4D flow MRI data: regional proximal and descending aorta PWV
A custom software programmed in C# (Lattido, Buenos Aires, Argentina) was used to import and visualize 4D flow MRI images, correct for eddy current effects using a third-order surface interpolation [25], and segment the aortic volume (Figure 1). Segmentation was performed on the anatomic modulus images at the time phase with maximal velocity magnitude, and then applied to the remaining phases.
Such process started with the manual placement of four 2D planes using a multiplanar reconstruction scheme and definition of circular regions of interest (ROIs) delineating the aortic cross-sectional borders, at specific anatomical landmarks (Figure 1.A in red). The center of these ROIs was used to automatically position 6 additional 2D planes (Figure 1.A in blue), in which ROIs delineating aortic borders were subsequently defined manually. An interpolating centripetal Catmull-Rom spline connecting ROIs centers was then used to define the aortic centerline. Additional ROIs were automatically reconstructed every 5 mm orthogonal to the centerline, by linearly interpolating the aortic diameter between the 10 previously defined ROIs (Figure 1.B). We performed a visual inspection of every reconstructed ROI to check for the absence of velocity aliasing or other artifacts. Since only global indices were considered in the present study, single local ROIs with detected artefacts were discarded from further analyses. We then computed the velocity field within each ROI using a trilinear interpolation scheme for each velocity component. Finally, net flow rate was computed inside each ROI, for each phase, as the averaged velocities along the spatial direction that was orthogonal to the cross-section multiplied by its area, resulting in time-resolved waveforms throughout the cardiac cycle (Figure 1.C) along the aorta.
Regional ascending (AA-PWV) and descending (DA-PWV) aorta PWV was derived using a reproducible and consistent method [26], which was applied to the reflectionless systolic upslope of normalized and interpolated (to 1 ms) net flow rate waveforms. Briefly, the time delay or transit time (TT) between waveforms in the diaphragm aortic plane (ROI-Desc100%) and each of the remaining ROIs was calculated using a 4th-order complex Gaussian wavelet transform [27]. Distance (D) along the centerline between each ROI and the most proximal ROI-AV was also computed. Then, AA-PWV, DA-PWV were equal to the inverse slope of the linear regression of TT vs. D points between ROI-AV and ROI-45°, ROI-45° and ROI-Desc150%, respectively (Figure 1.D).
Analysis of 2D PC MRI data: local AA, DA strain, distensibility and PWV, and regional aortic arch PWV
2D PC data were analyzed using the ArtFun software (Sorbonne Université, U1146 Inserm) as previously described [28]. Briefly, AA and DA borders throughout the cardiac cycle were automatically
delineated on modulus anatomical images, and diastolic minimal (Amin) as well as systolic maximal
(Amax) cross-sectional aortic areas were extracted to estimate local strain (%)= 100.
𝐴𝑚𝑎𝑥−𝐴𝑚𝑖𝑛 𝐴𝑚𝑖𝑛 and distensibility (10−3mmHg−1) = 𝐴𝑚𝑎𝑥−𝐴𝑚𝑖𝑛
𝐴𝑚𝑖𝑛∙𝑃𝑃 [29]. Local AA and DA PWV were then derived from distensibility measurements using the theoretical Bramwell-Hill model as BH-PWV = 1
√𝜌Distensibility [30], where ρ = 1059 kg.m-3 is blood density.
Finally, the automatically detected AA and DA contours were superimposed on velocity-encoded images, and regional PWV through the aortic arch was calculated as the AA-to-DA distance divided by the transit time between normalized net flow rate systolic upslopes at both locations [31]. The distance between AA and DA centers was measured as the arch length from SPGR/SSFP data in 3D using a semi-automated custom segmentation method (Mimosa, Sorbonne Université) while registering the 2D PC MRI axial plane on such 3D data [32]. We also reported mid-AA and proximal DA diameters at that same location as extracted from the 3D SPGR/SSFP images segmentation [32].
Statistical analysis
Statistical analysis was performed using JMP Pro 14.0.0 (SAS Institute, Cary, NC, USA). Values were expressed as median (interquartile range, IQR) unless stated otherwise. Differences between each patient group and its respective matched controls were tested using a Wilcoxon rank-sum test, except for gender which was studied using a Fisher's exact test. The reliability of MRI aortic stiffness measurements was studied through their physiological associations over the whole group with age, mean blood pressure and mid-ascending aortic diameter. Finally, validity of the Bramwell-Hill theoretical model was tested in each group, while comparing distensibility-derived BH-PWV against regional PWV estimates measured from 4D flow MRI (AA PWV and DA PWV) as well as from 2D PC MRI (arch PWV). For the latter, the average between AA and DA BH-PWV was considered. Spearman rho’s correlation coefficients ρ and p values are provided. p values below a threshold of 5% were considered significant.
Results
Population characteristics
Four patients had to be excluded due to 4D flow MRI extensive artefacts that could not be corrected (n=2), acquisition volume which was too small (n=1) or the segmentation algorithm that failed because the descending aorta was too tortuous (n=1), resulting in n=18 TAV-ATAA, n=19 BAV patients and n=27 healthy volunteers (10 of them were included in both control groups). Among patients: n=12 (7 TAV-ATAA and 5 BAV) or 33% had no AR; n=16 (5 TAV-ATAA and 11 BAV) or 43% had mild AR; n=9 (6 TAV-ATAA and 3 BAV) or 24% had moderate AR. Among BAV patients, right-left (RL) and right-non coronary (RN) fusion prevalence were 74% (n=14) and 26% (n=5), respectively. Patients were scanned from July 2015 to January 2019. While all (n=27) healthy volunteers and most (n=30) patients were scanned with a 3T magnet (89% over the entire study group), the remaining (n=7, including 4 patients with TAV-ATAA and 3 with a BAV) patients were scanned on a SIGNA Artist 1.5T scanner (11%). Four (IQR: 2-6) ROIs, which represented on average 5 (3-8)% of the total number of ROIs used to compute 4D flow PWV, in 10 patients (8 BAV and 2 TAV-ATAA), were discarded due to artefacts. 4D flow data analysis including eddy current correction, segmentation, flow computation and PWV estimation took approximately 8-10 minutes per patient (Intel® Core™ i5-4460 CPU @ 3.20 GHz, 16.0 GB RAM).
Maximal diameter over the AA was 47.5 (42.0-51.3) mm, ranging from 41.0 to 56.0 mm, or 24.9 (22.4-26.7) mm/m², ranging from 18.6 to 31.9 mm/m² when indexed to BSA, in TAV-ATAA patients; and 45.0 (41.0-47.0) mm, ranging from 34.0 to 51.0 mm, or 22.2 (20.5-24.7) mm/m², ranging from 18.7 to 28.2 mm/m² when indexed to BSA, in BAV patients. It was located at the sinuses of Valsalva in 6 TAV-ATAA and 5 BAV patients, sinotubular junction in 2 TAV-ATAA and 2 BAV patients, and in the mid-ascending aorta in 10 TAV-ATAA and 12 BAV patients. Subjects descriptive characteristics along with central blood pressures and aortic MRI measurements are provided in Table 1 for each patient group and their respective control groups. By design, age, gender and central blood pressures were similar for TAV-ATAA and BAV patient groups when compared to their respective matched controls. As expected, both patient groups had a significantly dilated proximal aorta compared
to controls. However, while such dilation was further extended to the descending aorta in TAV-ATAA patients, it was restricted to the AA in BAV patients.
Local and regional thoracic aortic stiffness
None of the 4D flow and 2D PC MRI-derived local and regional aortic strain, distensibility or PWV measurements was significantly different between TAV-ATAA patients and their matched controls (Table 1 left side, Supplementary Figure S2), as well as between BAV patients and their controls (Table 1 right side, Supplementary Figure S3).
Aortic PWV measurements revealed consistent relationships between increased stiffness and aging as well as elevated pressures (Table 2), which were mostly significant. Of note, Spearman correlation coefficients and p values obtained for distensibility were identical to BH-PWV. Increased AA diameter was also found to be significantly associated with higher regional aortic arch (ρ=0.28, p=0.03) and DA (ρ=0.32, p=0.009) PWV, while no tendency was observed between diameter and BH-PWV or distensibility (AA: p=0.31; DA: p=0.83).
Finally, while direct measures of PWV derived from 4D flow MRI in the AA (ρ=0.50, p=0.007) and DA (ρ=0.40, p=0.04), or from 2D PC MRI in the aortic arch (ρ=0.66, p=0.0002) were significantly correlated to distensibility-derived BH-PWV estimates in healthy volunteers, such associations were non-significant both in TAV-ATAA (AA: p=0.79, arch: p=0.69 and DA: p=0.78) and BAV (AA: p=0.25, arch: p=0.18 and DA: p=0.21) patients.
Discussion
We presently report a comprehensive, quantitative, non-invasive assessment of regional and local aortic stiffness biomarkers in patients with dilated ascending thoracic aorta associated with either a normal tricuspid aortic valve (TAV-ATAA group) or a bicuspid aortic valve (BAV group). Our major findings were that: 1- neither regional nor local surrogates of thoracic ascending and descending aortic stiffness were significantly different between patients and their respective matched controls; 2- in addition, the
theoretical Bramwell-Hill (BH) model linking distensibility to pulse wave velocity measured from MRI was unmet in either patient group.
A major strength of our case-control study is the similar age, gender and blood pressure between patient and control groups, while excluding patients with significant valve dysfunction such as stenosis or severe regurgitation, given their previously described effects on arterial stiffness [12]. The measurement of central instead of peripheral brachial blood pressures, which were also acquired simultaneously to aortic MRI scans [24], is another advantage of our work. As a result, the reliability of our MRI stiffness indices was confirmed by their expected associations with age [9,12,14,20,21,23], aortic diameter [13,18] or blood pressure [14], as well as between PWV measures and BH model-derived PWV estimates based on distensibility in healthy volunteers [30]. Of note, the physiological associations we obtained are further in agreement with the fact that in aortopathies, age has been identified as an essential determinant of the arterial stiffening process, while the influence of blood pressure or diameter was less significant [14].
Differences between our results and previous literature might be explained by several factors. Indeed, thoracic aortic stiffness as evaluated in vivo was reported to be significantly increased in BAV [5–7,9,11–19,21,22] or aneurysm [8,14] patients compared to controls. However, most studies were not designed to account for the confounding impact of valve impairment [11–17,21], blood pressure [5,6,9,17,18,22], age [22] or gender [16]. In addition, a few were restricted to young BAV patients (78±57 months [15], 12±5 years [12], 16±4 years [19] or 23±10 years [9]), which might reflect a specific early stage in the disease process, or were focused on male patients [7,9], which might introduce another bias. Our study is in agreement with confounder-adjusted reports in adult patients, which observed similar stiffness between BAV patients and controls with tricuspid aortic valve [4,22]. Importantly, similar to our findings, several groups acknowledged the considerably wide stiffness variation observed within BAV [9,14,21] or aneurysm [14] groups, and overlap with normal values [18,19] regardless of pediatric or adult populations. It was also found that, while distensibility was significantly lower compared to controls in patients with an aorta larger than 5 cm only, it was actually higher in aneurysms below 4 cm [8], further highlighting such heterogeneity.
According to the Moens-Korteweg equation: PWV= √𝐸.ℎ
2.𝑟.𝜌, where E is Young’s elastic modulus, h is wall thickness and r is the vessel radius, we hypothesize that the theoretical dilation-related decrease in PWV could be counterbalanced by a simultaneous increase in E (reduced elasticity) and/or wall thinning or thickening. This equation illustrates the fact that so-called indices of stiffness such as PWV should not be considered as equivalent synonyms of wall elasticity markers, since it is related to E but also to wall and lumen geometry. Indeed, at a fixed E or E.h and thus a fixed level of aortic wall stiffness, PWV theoretically depends on the vessel diameter. In other words, for a given degree of aortic medial elastin fibers fragmentation as observed in TAV-ATAA or BAV patients, PWV will be determined by the extent of vessel expansion: the larger the arterial diameter the lower the PWV, at the same wall elasticity. This effect was previously hypothesized in abdominal aortic aneurysms, in which PWV was shown to be increased in the thoracic but similar in the abdominal aorta compared to controls, suggesting that the enlargement might cancel out the intrinsic wall stiffening [33]. Inversely, at a fixed aortic dilation degree and given the heterogeneity we found in PWV measurements, we could also hypothesize that patients who did show an increased PWV through elevated E might be at higher risk of developing aortic complications later than patients with a normalized PWV.
To the best of our knowledge, the validity of the BH model was previously tested in vivo in healthy subjects [30] or patients with suspected coronary artery disease [34]. The present study evaluated the BH model for the first time in patients with dilated aorta associated with either BAV or TAV-ATAA, and we found no significant correlations between the theoretical BH-PWV and 2D PC as well as 4D flow MRI PWV measurements in either patient group. This could be due to the fact that PWV and/or distensibility estimates might not be suitable to accurately reflect stiffness in case of dilated and non-elastic aortas. Another potential explanation is that in such situations, BH assumptions might not be completely fulfilled. Also, measurements of regional PWV using 3D MRI volumetric coverage might not be sensitive enough to detect local changes, while distensibility measured through a 2D MRI acquisition plane reflects wall properties averaged over the circumference and restricted to that single axial location. In contrast, ultrasound techniques have the advantage to provide more local information throughout a vessel, such as aortic longitudinal strain which was demonstrated using speckle tracking
to be asynchronous along the ascending aorta in BAV patients [17]. Derwich et al. have also shown considerable variations in local wall strain distribution, including circumferentially, in patients with abdominal aortic aneurysms compared with controls of similar age using 4D ultrasound [35]. Finally, Koullias et al. revealed using epiaortic echocardiography significant differences in local wall stress and distensibility between narrow and wider locations within AA aneurysms [8]. Technical issues pertaining to MRI should be further mentioned: despite constant advances, higher spatial and temporal resolutions will help provide wall thickness as well as more local distensibility or PWV measures, which are needed especially in aortas with elevated stiffness resulting in both limited cross-sectional area time-variations and narrow transit times. Flow disorganization previously described [20] in patients with a BAV and/or aortic aneurysm might also hamper PWV calculation which is based on velocity or flow rate time-resolved profiles.
Our study has some limitations. While PWV estimated using 4D flow MRI was recently compared to applanation tonometry-derived carotid-femoral PWV [26], such validation has not been confirmed in patients with aortic disease, and no gold standard for aortic stiffness assessment such as invasive data or carotid-femoral PWV was available in our patients. In addition, due to the small number of patients, groups were heterogeneous in terms of aortic dilation or BAV fusion phenotypes, which were shown to have an impact on arterial stiffness [4,6,12]. Indeed, while we found no significant differences in thoracic aortic stiffness indices between matched controls and patients when considering the whole group, such indices might still be of clinical usefulness to identify specific patients who might be at higher risk of developing aortic complications eventually. Another potential drawback is related to the two different MRI scanner field strengths. This is due to the retrospective design of our study, and our goal to increase the patient population to overcome the small sample size, while limiting exclusion criteria to clinical factors only. This consideration was based on our previous experience showing similar aortic PWV measurements between 1.5 and 3T [27]. Importantly, the same acquisition sequences were used across scanners.
Conclusions
We found no significant differences in terms of MRI-derived ascending and descending aortic strain, distensibility and PWV, in patients with TAV-ATAA or BAV aortopathy and no stenosis or significant regurgitation compared to matched controls. The variability in aortic stiffness and overlap with normal values reported by us and other groups highlight another heterogeneous feature within TAV or BAV aortopathy spectrums, and suggest the urgent need for more local indices which might help better discriminate such diseases. However, better resolved imaging techniques to enable estimation of aortic wall thickness in order to determine more realistic elasticity applied to larger and longitudinal cohorts are warranted to identify such biomarkers.
Acknowledgements: The authors thank Prof. Emmanuel Messas, Principal Investigator of the ElastoCardio Project (Identifier NCT02537041).
References
[1] L.F. Hiratzka, G.L. Bakris, J.A. Beckman, R.M. Bersin, V.F. Carr, D.E. Casey, K.A.
Eagle, L.K. Hermann, E.M. Isselbacher, E.A. Kazerooni, N.T. Kouchoukos, B.W. Lytle,
D.M. Milewicz, D.L. Reich, S. Sen, J.A. Shinn, L.G. Svensson, D.M. Williams, 2010
ACCF/AHA/AATS/ACR/ASA/SCA/SCAI/SIR/STS/SVM Guidelines for the Diagnosis
and Management of Patients With Thoracic Aortic Disease, J Am Coll Cardiol. 55 (2010)
e27–e129. https://doi.org/10.1016/j.jacc.2010.02.015.
[2] L.A. Pape, T.T. Tsai, E.M. Isselbacher, J.K. Oh, P.T. O’Gara, A. Evangelista, R. Fattori,
G. Meinhardt, S. Trimarchi, E. Bossone, T. Suzuki, J.V. Cooper, J.B. Froehlich, C.A.
Nienaber, K.A. Eagle, Aortic Diameter ≥5.5 cm Is Not a Good Predictor of Type A Aortic
Dissection: Observations From the International Registry of Acute Aortic Dissection
(IRAD),
Circulation.
116
(2007)
1120–1127.
https://doi.org/10.1161/CIRCULATIONAHA.107.702720.
[3] C. Vlachopoulos, K. Aznaouridis, C. Stefanadis, Prediction of Cardiovascular Events and
All-Cause Mortality With Arterial Stiffness: A Systematic Review and Meta-Analysis, J
Am Coll Cardiol. 55 (2010) 1318–1327. https://doi.org/10.1016/j.jacc.2009.10.061.
[4] S.Y. Lee, C.Y. Shim, G.-R. Hong, J. Seo, I. Cho, I.J. Cho, H.-J. Chang, J.-W. Ha, N.
Chung, Association of Aortic Phenotypes and Mechanical Function With Left Ventricular
Diastolic Function in Subjects With Normally Functioning Bicuspid Aortic Valves and
Comparison to Subjects With Tricuspid Aortic Valves, Am J Cardiol. 116 (2015) 1547–
1554. https://doi.org/10.1016/j.amjcard.2015.08.017.
[5] N. Tzemos, E. Lyseggen, C. Silversides, M. Jamorski, J.H. Tong, P. Harvey, J. Floras, S.
Siu, Endothelial Function, Carotid–Femoral Stiffness, and Plasma Matrix
Metalloproteinase-2 in Men With Bicuspid Aortic Valve and Dilated Aorta, J Am Coll
Cardiol. 55 (2010) 660–668. https://doi.org/10.1016/j.jacc.2009.08.080.
[6] C.Y. Shim, I.J. Cho, W.-I. Yang, M.-K. Kang, S. Park, J.-W. Ha, Y. Jang, N. Chung,
Central Aortic Stiffness and Its Association with Ascending Aorta Dilation in Subjects
with a Bicuspid Aortic Valve, J Am Soc Echocardiogr. 24 (2011) 847–852.
https://doi.org/10.1016/j.echo.2011.04.017.
[7] S. Nistri, M.D. Sorbo, C. Basso, G. Thiene, Bicuspid aortic valve: abnormal aortic elastic
properties, J. Heart Valve Dis. 11 (2002) 369–373; discussion 373-374.
[8] G. Koullias, R. Modak, M. Tranquilli, D.P. Korkolis, P. Barash, J.A. Elefteriades,
Mechanical deterioration underlies malignant behavior of aneurysmal human ascending
aorta,
J
Thorac
Cardiovasc
Surg.
130
(2005)
677.e1-677.e9.
https://doi.org/10.1016/j.jtcvs.2005.02.052.
[9] S. Nistri, J. Grande-Allen, M. Noale, C. Basso, P. Siviero, S. Maggi, G. Crepaldi, G.
Thiene, Aortic elasticity and size in bicuspid aortic valve syndrome, Eur Heart J. 29
(2008) 472–479. https://doi.org/10.1093/eurheartj/ehm528.
[10] S.-C. Yap, A. Nemes, F.J. Meijboom, T.W. Galema, M.L. Geleijnse, F.J. ten Cate, M.L.
Simoons, J.W. Roos-Hesselink, Abnormal aortic elastic properties in adults with
congenital valvular aortic stenosis, Int J Cardiol. 128 (2008) 336–341.
https://doi.org/10.1016/j.ijcard.2007.06.065.
[11] S. Biner, A.M. Rafique, I. Ray, O. Cuk, R.J. Siegel, K. Tolstrup, Aortopathy Is Prevalent
in Relatives of Bicuspid Aortic Valve Patients, J Am Coll Cardiol. 53 (2009) 2288–2295.
https://doi.org/10.1016/j.jacc.2009.03.027.
[12] C. Pees, I. Michel-Behnke, Morphology of the Bicuspid Aortic Valve and Elasticity of
the Adjacent Aorta in Children, Am J Cardiol. 110 (2012) 1354–1360.
https://doi.org/10.1016/j.amjcard.2012.06.043.
[13] G. Santarpia, G. Scognamiglio, G. Di Salvo, M. D’Alto, B. Sarubbi, E. Romeo, C. Indolfi,
M. Cotrufo, R. Calabrò, Aortic and left ventricular remodeling in patients with bicuspid
aortic valve without significant valvular dysfunction: A prospective study, Int J Cardiol.
158 (2012) 347–352. https://doi.org/10.1016/j.ijcard.2011.01.046.
[14] A. de Wit, K. Vis, R.W. Jeremy, Aortic Stiffness in Heritable Aortopathies: Relationship
to
Aneurysm
Growth
Rate,
Heart
Lung
Circ.
22
(2013)
3–11.
https://doi.org/10.1016/j.hlc.2012.08.049.
[15] I. Oulego-Erroz, P. Alonso-Quintela, M. Mora-Matilla, S. Gautreaux Minaya, S.
Lapeña-López de Armentia, Ascending aorta elasticity in children with isolated bicuspid aortic
valve, Int J Cardiol. 168 (2013) 1143–1146. https://doi.org/10.1016/j.ijcard.2012.11.080.
[16] G. Goudot, T. Mirault, A. Rossi, S. Zarka, J. Albuisson, P. Achouh, M. Pernot, E. Messas,
Segmental aortic stiffness in patients with bicuspid aortic valve compared with
first-degree relatives, Heart. 105 (2019) 130–136.
https://doi.org/10.1136/heartjnl-2018-313232.
[17] L. Longobardo, M.L. Carerj, G. Pizzino, A. Bitto, M.C. Piccione, M. Zucco, L. Oreto,
M.C. Todaro, M.P. Calabrò, F. Squadrito, G. Di Bella, G. Oreto, B.K. Khandheria, S.
Carerj, C. Zito, Impairment of elastic properties of the aorta in bicuspid aortic valve:
relationship between biomolecular and aortic strain patterns, Eur Heart J Cardiovasc
Imaging. 19 (2018) 879–887. https://doi.org/10.1093/ehjci/jex224.
[18] H.B. Grotenhuis, J. Ottenkamp, J.J.M. Westenberg, J.J. Bax, L.J.M. Kroft, A. de Roos,
Reduced Aortic Elasticity and Dilatation Are Associated With Aortic Regurgitation and
Left Ventricular Hypertrophy in Nonstenotic Bicuspid Aortic Valve Patients, J Am Coll
Cardiol. 49 (2007) 1660–1665. https://doi.org/10.1016/j.jacc.2006.12.044.
[19] G. Donato Aquaro, L. Ait-Ali, M.L. Basso, M. Lombardi, A. Pingitore, P. Festa, Elastic
Properties of Aortic Wall in Patients With Bicuspid Aortic Valve by Magnetic Resonance
Imaging,
Am
J
Cardiol.
108
(2011)
81–87.
[20] M.M. Bissell, A.T. Hess, L. Biasiolli, S.J. Glaze, M. Loudon, A. Pitcher, A. Davis, B.
Prendergast, M. Markl, A.J. Barker, S. Neubauer, S.G. Myerson, Aortic Dilation in
Bicuspid Aortic Valve Disease: Flow Pattern Is a Major Contributor and Differs With
Valve
Fusion
Type,
Circ
Cardiovasc
Imaging.
6
(2013)
499–507.
https://doi.org/10.1161/CIRCIMAGING.113.000528.
[21] N.S. Burris, P. Dyverfeldt, M.D. Hope, Ascending Aortic Stiffness with Bicuspid Aortic
Valve is Variable and Not Predicted by Conventional Parameters in Young Patients, J.
Heart Valve Dis. 25 (2016) 270–280.
[22] A. Guala, J. Rodriguez-Palomares, L. Dux-Santoy, G. Teixido-Tura, G. Maldonado, L.
Galian, M. Huguet, F. Valente, L. Gutiérrez, T. González-Alujas, K.M. Johnson, O.
Wieben, A. Sao Avilés, D. Garcia-Dorado, A. Evangelista, Influence of Aortic Dilation
on the Regional Aortic Stiffness of Bicuspid Aortic Valve Assessed by 4-Dimensional
Flow Cardiac Magnetic Resonance, JACC Cardiovasc Imaging. 12 (2019) 1020–1029.
https://doi.org/10.1016/j.jcmg.2018.03.017.
[23] O. Trabelsi, M. Gutierrez, S. Farzaneh, A. Duprey, S. Avril, A non-invasive methodology
for
ATAA
rupture
risk
estimation,
J
Biomech.
66
(2018)
119–126.
https://doi.org/10.1016/j.jbiomech.2017.11.012.
[24] G. Soulat, S. Millasseau, S. Stroer, S. Tavolaro, N. Kachenoura, H. Khettab, P.
Boutouyrie, S. Laurent, E. Mousseaux, Impact of simultaneous measurement of central
blood pressure with the SphygmoCor Xcel during MRI acquisition to better estimate
aortic
distensibility:,
J
Hypertens.
37
(2019)
1448–1454.
https://doi.org/10.1097/HJH.0000000000002061.
[25] D. Craiem, A.F. Pascaner, M.E. Casciaro, U. Gencer, J. Alcibar, G. Soulat, E. Mousseaux,
Automatic correction of background phase offset in 4D-flow of great vessels and of the
heart in MRI using a third-order surface model, MAGMA. 32 (2019) 629–642.
https://doi.org/10.1007/s10334-019-00765-z.
[26] S. Houriez--Gombaud-Saintonge, E. Mousseaux, I. Bargiotas, A. De Cesare, T.
Dietenbeck, K. Bouaou, A. Redheuil, G. Soulat, A. Giron, U. Gencer, D. Craiem, E.
Messas, E. Bollache, Y. Chenoune, N. Kachenoura, Comparison of different methods for
the estimation of aortic pulse wave velocity from 4D flow cardiovascular magnetic
resonance, J Cardiovasc Magn Reson. 21 (2019) 75.
https://doi.org/10.1186/s12968-019-0584-x.
[27] I. Bargiotas, E. Mousseaux, W.-C. Yu, B.A. Venkatesh, E. Bollache, A. de Cesare, J.A.C.
Lima, A. Redheuil, N. Kachenoura, Estimation of aortic pulse wave transit time in
cardiovascular magnetic resonance using complex wavelet cross-spectrum analysis, J
Cardiovasc Magn Reson. 17 (2015) 65. https://doi.org/10.1186/s12968-015-0164-7.
[28] A. Herment, N. Kachenoura, M. Lefort, M. Bensalah, A. Dogui, F. Frouin, E. Mousseaux,
A. De Cesare, Automated segmentation of the aorta from phase contrast MR images:
validation against expert tracing in healthy volunteers and in patients with a dilated aorta,
J Magn Reson Imaging. 31 (2010) 881–888. https://doi.org/10.1002/jmri.22124.
[29] A. Redheuil, W.-C. Yu, C.O. Wu, E. Mousseaux, A. de Cesare, R. Yan, N. Kachenoura,
D. Bluemke, J.A.C. Lima, Reduced ascending aortic strain and distensibility: earliest
manifestations of vascular aging in humans, Hypertension. 55 (2010) 319–326.
https://doi.org/10.1161/HYPERTENSIONAHA.109.141275.
[30] A. Dogui, N. Kachenoura, F. Frouin, M. Lefort, A. De Cesare, E. Mousseaux, A. Herment,
Consistency of aortic distensibility and pulse wave velocity estimates with respect to the
Bramwell-Hill theoretical model: a cardiovascular magnetic resonance study, J
Cardiovasc Magn Reson. 13 (2011) 11. https://doi.org/10.1186/1532-429X-13-11.
[31] A. Dogui, A. Redheuil, M. Lefort, A. DeCesare, N. Kachenoura, A. Herment, E.
Mousseaux, Measurement of aortic arch pulse wave velocity in cardiovascular MR:
Comparison of transit time estimators and description of a new approach, J. Magn. Reson.
Imaging. 33 (2011) 1321–1329. https://doi.org/10.1002/jmri.22570.
[32] T. Dietenbeck, D. Craiem, D. Rosenbaum, A. Giron, A. De Cesare, K. Bouaou, X. Girerd,
P. Cluzel, A. Redheuil, N. Kachenoura, 3D aortic morphology and stiffness in MRI using
semi-automated cylindrical active surface provides optimized description of the vascular
effects of aging and hypertension, Comput Biol Med. 103 (2018) 101–108.
https://doi.org/10.1016/j.compbiomed.2018.10.006.
[33] A. Abbas, M. Cecelja, T. Hussain, G. Greil, B. Modarai, M. Waltham, P.J. Chowienczyk,
A. Smith, Thoracic but not abdominal phase contrast magnetic resonance-derived aortic
pulse wave velocity is elevated in patients with abdominal aortic aneurysm, J Hypertens.
33 (2015) 1032–1038. https://doi.org/10.1097/HJH.0000000000000516.
[34] J.J.M. Westenberg, E.P. van Poelgeest, P. Steendijk, H.B. Grotenhuis, J.W. Jukema, A.
de Roos, Bramwell-Hill modeling for local aortic pulse wave velocity estimation: a
validation study with velocity-encoded cardiovascular magnetic resonance and invasive
pressure
assessment,
J
Cardiovasc
Magn
Reson.
14
(2012)
2.
https://doi.org/10.1186/1532-429X-14-2.
[35] W. Derwich, A. Wittek, K. Pfister, K. Nelson, J. Bereiter-Hahn, C.P. Fritzen, C. Blase, T.
Schmitz-Rixen, High Resolution Strain Analysis Comparing Aorta and Abdominal Aortic
Aneurysm with Real Time Three Dimensional Speckle Tracking Ultrasound, Eur J Vasc
Endovasc Surg. 51 (2016) 187–193. https://doi.org/10.1016/j.ejvs.2015.07.042.
Figure captions
Figure 1. Assessment of proximal ascending (AA) and descending (DA) aortic pulse wave velocity (PWV) using 4D flow MRI. A: Landmarks used to initialize 4 manual cross-sectional regions of interest (ROIs, in red): aortic valve (ROI-AV), mid-ascending (ROI-Asc) and descending aorta both at the level of the pulmonary artery bifurcation (ROI-Desc), and diaphragm (ROI-Desc100%). The following 6 ROIs are then automatically positioned (in blue): ROI-Asc50%, which was half-way between ROI-AV and ROI-Asc; ROI-135, ROI-90 and ROI-45, which were located within the aortic arch at 135, 90 and 45, respectively, with respect to the plane comprising ROI-Asc and Desc; ROI-Desc50%, which was half-way between ROI-Desc and ROI-Desc100%; ROI-Desc150%, which was located at the same distance as ROI-Desc50% further distally from ROI-Desc100%. B: Representative 3D peak systolic aortic volume segmentation based on ROIs automatically interpolated every 5 mm along the centerline of a patient with ascending aorta dilatation (in red). The plane separating the AA and DA is shown in green. C: Example of three time-resolved net flow rate waveforms computed within ROI-Asc (pink), ROI-Desc (orange) and ROI-Desc100% (green). D: Ascending and descending aorta PWV (AA-PWV and DA-PWV) were calculated as the inverse of the slope of the transit-time vs distance regression throughout the corresponding segments.
Supplementary Figure S2. Comparison of aortic stiffness MRI indices between patients with a tricuspid aortic valve and thoracic ascending aortic aneurysm (TAV-ATAA, n=18 including 14 men) and their matched controls (n=18 including 11 men). A, from top to bottom: local distensibility and Bramwell-Hill-derived pulse wave velocity (BH-PWV) in the ascending (AA) and descending (DA) aorta, as well as regional aortic arch PWV measured using 2D PC MRI . B: regional PWV in the AA and DA measured using 4D flow MRI . Differences between patients and matched controls were tested using a Wilcoxon rank-sum test.
Supplementary Figure S3. Comparison of aortic stiffness MRI indices between patients with a bicuspid aortic valve (BAV, n=19 including 17 men) and their matched controls (n=19 including 17 men). A, from top to bottom: local distensibility and Bramwell-Hill-derived pulse wave velocity (BH-PWV) in the ascending (AA) and descending (DA) aorta, as well as regional aortic arch PWV measured
using 2D PC MRI . B: regional PWV in the AA and DA measured using 4D flow MRI . Differences between patients and matched controls were tested using a Wilcoxon rank-sum test.
Figures
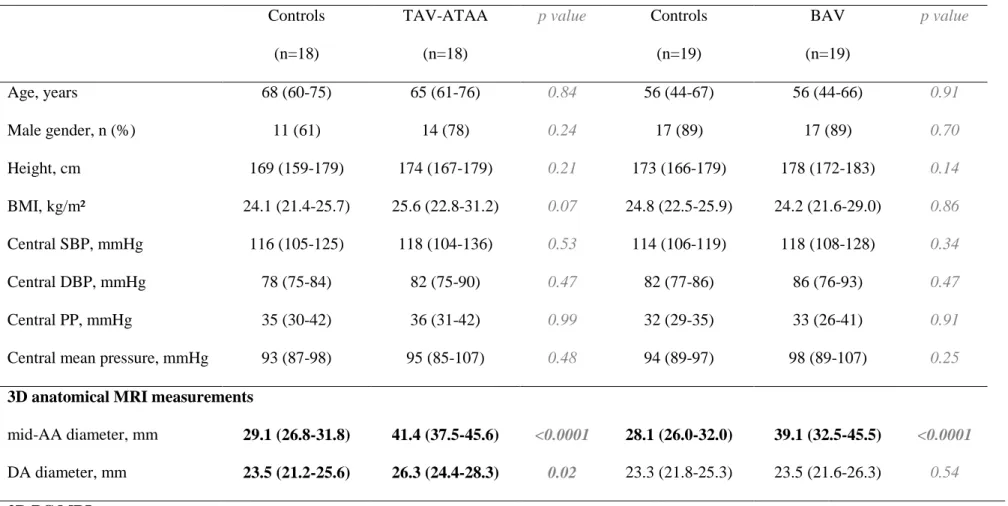
Table 1. Basic characteristics, aortic diameters provided by 3D anatomical MRI, as well as 2D phase-contrast (PC) and 4D flow MRI measurements of local and regional aortic stiffness indices in patients with a tricuspid aortic valve and dilated ascending aorta (TAV-ATAA, left side) or a bicuspid aortic valve (BAV, right side), and their respective matched healthy volunteers.
Controls (n=18) TAV-ATAA (n=18) p value Controls (n=19) BAV (n=19) p value Age, years 68 (60-75) 65 (61-76) 0.84 56 (44-67) 56 (44-66) 0.91 Male gender, n (%) 11 (61) 14 (78) 0.24 17 (89) 17 (89) 0.70 Height, cm 169 (159-179) 174 (167-179) 0.21 173 (166-179) 178 (172-183) 0.14 BMI, kg/m² 24.1 (21.4-25.7) 25.6 (22.8-31.2) 0.07 24.8 (22.5-25.9) 24.2 (21.6-29.0) 0.86 Central SBP, mmHg Central DBP, mmHg Central PP, mmHg
Central mean pressure, mmHg
116 (105-125) 78 (75-84) 35 (30-42) 93 (87-98) 118 (104-136) 82 (75-90) 36 (31-42) 95 (85-107) 0.53 0.47 0.99 0.48 114 (106-119) 82 (77-86) 32 (29-35) 94 (89-97) 118 (108-128) 86 (76-93) 33 (26-41) 98 (89-107) 0.34 0.47 0.91 0.25
3D anatomical MRI measurements
mid-AA diameter, mm 29.1 (26.8-31.8) 41.4 (37.5-45.6) <0.0001 28.1 (26.0-32.0) 39.1 (32.5-45.5) <0.0001 DA diameter, mm 23.5 (21.2-25.6) 26.3 (24.4-28.3) 0.02 23.3 (21.8-25.3) 23.5 (21.6-26.3) 0.54
AA strain, % DA strain, % 3.7 (1.9-6.8) 2.9 (1.8-6.3) 4.1 (2.8-6.6) 4.8 (3.5-9.8) 0.68 0.09 5.1 (2.0-7.4) 5.4 (1.8-8.5) 7.9 (4.3-13) 7.0 (2.9-19) 0.05 0.15 AA distensibility, 10-3 mmHg-1 DA distensibility, 10-3 mmHg-1 1.0 (0.5-1.9) 0.7 (0.6-1.9) 1.1 (0.7-1.8) 1.6 (0.8-3.2) 0.64 0.09 1.7 (0.6-2.7) 1.8 (0.6-2.4) 2.6 (1.2-3.8) 2.1 (0.9-5.0) 0.08 0.21 AA BH-PWV, m/s 11.7 (8.2-15.6) 10.7 (8.3-13.3) 0.64 8.7 (6.8-14.7) 7.0 (5.8-10.3) 0.08 DA BH-PWV, m/s 13.4 (8.3-14.9) 9.0 (6.3-12.4) 0.09 8.5 (7.3-14.2) 7.7 (5.0-11.5) 0.21 Aortic arch PWV, m/s 7.7 (6.1-9.4) 9.5 (6.0-12.7) 0.20 5.7 (4.8-7.8) 6.7 (5.7-8.8) 0.21
4D flow MRI measurements AA PWV, m/s DA PWV, m/s 7.8 (5.5-11) 10.7 (8.7-12.1) 7.8 (6.8-10.5) 10.6 (9.4-12.4) 0.68 0.47 6.1 (5.0-10.1) 8.8 (7.6-11.1) 5.8 (4.1-6.9) 8.7 (6.7-10.2) 0.13 0.65
TAV-ATAA: tricuspid aortic valve with ascending thoracic aortic aneurysm; BAV: bicuspid aortic valve; BMI: body mass index; SBP: systolic blood pressure; DBP: diastolic blood pressure; PP: pulse pressure; MRI: magnetic resonance imaging; AA: ascending aorta; DA: descending aorta; PC: phase-contrast; BH: Bramwell-Hill; PWV: pulse wave velocity. Significant differences (p<0.05) are highlighted in bold.
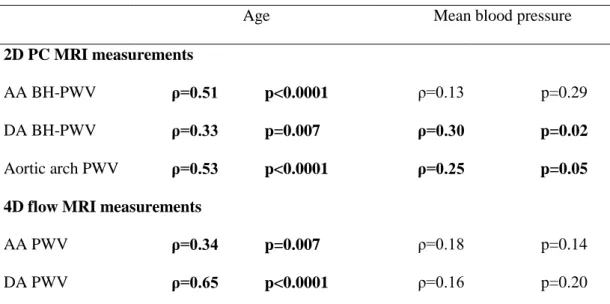
Table 2. Associations of 2D PC and 4D flow MRI aortic PWV measurements with age (left column) and mean blood pressure (right column) over the n=64 subjects. For each, Spearman ρ correlation coefficient and p value are provided.
Age Mean blood pressure
2D PC MRI measurements
AA BH-PWV ρ=0.51 p<0.0001 ρ=0.13 p=0.29
DA BH-PWV ρ=0.33 p=0.007 ρ=0.30 p=0.02
Aortic arch PWV ρ=0.53 p<0.0001 ρ=0.25 p=0.05 4D flow MRI measurements
AA PWV ρ=0.34 p=0.007 ρ=0.18 p=0.14
DA PWV ρ=0.65 p<0.0001 ρ=0.16 p=0.20
PC: phase-contrast; MRI: magnetic resonance imaging; AA: ascending aorta; BH: Bramwell-Hill; PWV: pulse wave velocity; DA: descending aorta. Significant differences (p<0.05) are highlighted in bold.
Supplementary Table S1. Advanced scan parameters used for aortic MRI acquisitions.
2D PC 4D flow 3D SPGR/SSFP
cardiac 32-channel phased-array coil
Acquisition matrix 256x128 180-256x96-180x96-140 160x160x70-128
Repetition time TR (ms) 5.6 4.2-4.4 3.1
Echo time TE (ms) 3.5 1.7-2.2 1.3
Flip angle (°) 20-25 8-15 20