HAL Id: hal-00329141
https://hal.archives-ouvertes.fr/hal-00329141
Submitted on 1 Jan 1999
HAL is a multi-disciplinary open access archive for the deposit and dissemination of sci-entific research documents, whether they are pub-lished or not. The documents may come from teaching and research institutions in France or abroad, or from public or private research centers.
L’archive ouverte pluridisciplinaire HAL, est destinée au dépôt et à la diffusion de documents scientifiques de niveau recherche, publiés ou non, émanant des établissements d’enseignement et de recherche français ou étrangers, des laboratoires publics ou privés.
Stratospheric background aerosol and polar cloud
observations by laser backscattersonde within the
framework of the European project ”Stratospheric
Regular Sounding”
A. Adriani, F. Cairo, L. Pulvirenti, Francesco Cardillo, M. Viterbini, G. Di
Donfrancesco, Jean-Pierre Pommereau
To cite this version:
A. Adriani, F. Cairo, L. Pulvirenti, Francesco Cardillo, M. Viterbini, et al.. Stratospheric background aerosol and polar cloud observations by laser backscattersonde within the framework of the European project ”Stratospheric Regular Sounding”. Annales Geophysicae, European Geosciences Union, 1999, 17 (10), pp.1352-1360. �hal-00329141�
Stratospheric background aerosol and polar cloud observations
by laser backscattersonde within the framework
of the European project ``Stratospheric Regular Sounding''
A. Adriani1, F. Cairo1, L. Pulvirenti1, F. Cardillo1, M. Viterbini1, G. Di Donfrancesco2, J. P. Pommereau3
1CNR ± Istituto di Fisica dell'Atmosfera, Via del Fosso del Cavaliere 100, 00133 ± Roma, Italy
E-mail: [email protected]
2ENEA Casaccia, Dip. Ambiente, Via Anguillarese 301, 00060 ± S. Maria di Galeria, RM, Italy 3CNRS ± Service d'Aeronomie ± BP 3, 91371 Verrieres le Buisson CEDEX, France
Received: 2 December 1998 / Revised: 19 May 1999 / Accepted: 16 June 1999 Abstract. The Stratospheric Regular Sounding project
was planned to measure regularly the vertical pro®les of
several tracers like ozone, water vapor, NOx, ClOxand
BrOx radicals, aerosol, pressure and temperature, at
three latitudes, to discriminate between the transport and photochemical terms which control their distribu-tion. As part of this project, the ``Istituto di Fisica dell'Atmosfera'' launched nine laser backscattersondes (LABS) on board stratospheric balloons to make observations of background aerosol and PSCs. LABS was launched with an optical particle counter operated by the University of Wyoming. Observations have been performed in the arctic, mid-latitudes and tropical regions in dierent seasons. Polar stratospheric clouds have been observed in areas inside and outside the polar vortex edge. A background aerosol was observed both in mid-latitudes and in arctic regions with a backscat-tering ratio of 1.2 at 692 nm. Very strati®ed aerosol layers, possibly transported into the lower stratosphere by deep convective systems, have been observed in the lower stratosphere between 20 and 29 km in the tropics in the Southern Hemisphere.
Key words. Atmospheric composition and structure (aerosols and particles; middle atmosphere ±
composition and chemistry; instruments and techniques)
1 Introduction
The long-term ozone loss at mid and high latitudes in the stratosphere depends on dynamical and chemical factors. Ozone is transported from the tropics where it originates. Later gas phase and heterogeneous processes
involving radicals (HOx, NOx, ClOx, BrOx) and particles
(background aerosol and PSCs) take place, controlling further evolution of its concentration. The sources of these radicals are long-lived natural or man-made gases emitted at the surface of the Earth and transported upward across the troposphere in a few weeks, then move slowly into the stratosphere over a few years. The vertical distribution of the concentration of the radicals and ozone is thus the result of a combination of transport and chemical processes experienced by the air mass along its trajectory. In such scenarios, important dynamical parameters are the time constants of trans-port across the tropopause at the equator and across the sub-tropical jet and the edge of the polar vortex from the tropopause up to 30 km. From the microphysical and photochemical points of view, the de-hydration mech-anisms at the pole and at the equator, the size distribution of aerosol, the heterogeneous conversion
of NOxinto aerosol or PSCs, the global distribution of
BrO and the average ozone reduction and denitri®cation in the Arctic vortex in winter play key roles.
The Stratospheric Regular Soundings (SRS) project was funded by the European Commission for the years 1996±1997. The project objective was the regular mea-surement of the vertical pro®les of several tracers such
as ozone, water vapor, source gases (N2O, CFCs, CH4),
radicals (NO2, OClO, BrO), background and volcanic
aerosol, PSCs, pressure and temperature at three latitudes and from the tropopause up to 30 km, to discriminate between the transport and photochemical terms which control their distribution. Another objec-tive was to investigate the anticipated time constants of transport by correlation between tracers of dierent atmospheric history, and to simulate the results with 3D and Langrangian photochemical models to dierentiate transport and chemical terms. The vertical pro®les of the species were measured by a combination of light-weight instruments carried by relatively small balloons with dierent payloads. The instruments included the SAOZ uv-visible spectrometers (Pommereau et al., 1994) of the
Service d'AeÂronomie du CNRS, France, for O3, NO2,
OClO, BrO and optical extinction; the DESCARTES Correspondence to: A. Adriani
sampler (Pyle et al., 1994) of the University of Cam-bridge, United Kingdom, optimized for CCF 11, but
also used for measuring pro®les of CFC 113, CCl4and
CH3CCl3; the Lyman-alpha hygrometer (Katthatov
et al., 1994) of the Central Aerological Observatory, Russia, for in-situ water vapor, the Optical Particle Counter (Hofmann et al., 1989; Deshler et al., 1994) of the University of Wyoming, USA, and the laser backscattersonde (Adriani et al., 1998, 1999) of the Istituto di Fisica dell'Atmosfera del Consiglio Nazionale delle Ricerche, Italy, for optical, concentration and size measurements on stratospheric particulate matter. A total of 31 ¯ights with dierent payloads were made from dierent sites in Europe and Brazil. Among these, nine ¯ights were performed from Andoya (69°N, Nor-way), Gap Tallard (44°N, France), Laramie (42°N, USA), and Bauru (22°S, Brazil) with payloads equipped with optical particle counters and laser backscatter-sondes for aerosol measurements.
A number of papers describing some of the SRS results, except for those described here, have been published by Nilsson et al. (1997), Preston et al. (1997), Deniel et al. (1998), Danis et al. (1998), Lambert et al. (1999), Pommereau et al. (1998), and Pundt et al. (1998).
We focus our presentation on the observations made by laser backscattersondes. We dedicate a section to the description of the instrument (characteristics and prod-ucts) and another to the observations made over the two years of the project.
2 The laser backscattersonde
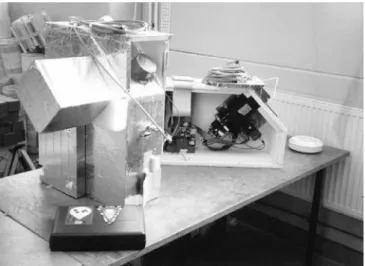
Laser backscattersondes (LABS), Fig. 1, have been used in order to perform optical measurements on the stratospheric background aerosol and PSCs. LABS has been routinely ¯own along with optical particle counters (OPC) from the University of Wyoming.
The basic instrument had two detection channels and can measure laser light backscattered from atmosphere in the close ®eld. It uses laser diodes as a light source and the emission is polarized. A version of the instru-ment, with two lasers at 692 and 830 nm, was used for background aerosol measurements. A second version of LABS with one single laser wavelength (692 nm) but able to make backscattering measurements on parallel and cross polarization was preferred for observations in the presence of PSCs. One more laser and one more receiving channel at 830 nm were developed on an instrument of the second type. Such a modi®ed LABS instrument was used only once during a strong PSC event because it was lost after the ¯ight because of a malfunction in the balloon separation system. Its optical layout is sketched in Fig. 2. The main functional characteristics of the instruments are summarized in Table 1.
The lasers emitted powers were about 20 and 15 mW respectively. The instrument actually performs an in situ
Fig. 1. Two of the laser backscattersondes used in the SRS project. One of the II type (open, on right): 1 wavelength/2 receiving channel; the modi®ed version of the same type (closed, on left): 2 wavelengths/3 receiving channels. The open one shows the optical head on the right and electronics batteries on the left. Box size is about 61 ´ 22 ´ 50 cm
Top view Lateral view
APD1 APD2 APD3 IF IF IF 680 nm 680 nm 830 nm 692 nm 830 nm Lasers DC DC L L Laser temperature
control A/D converters and
housekeepings Counters Computer board Mass memory To telemetry Temperature and pressure sensors
Laser monitors and optical detectors
Fig. 2. Layout of one of the LABS used during the SRS project. Note that the optical part is split into two views. APD, avalanche photodiodes; DC, dicroics for polarization and for wavelength separation; IF, interference ®lters; L, lens
measurement by sounding the atmosphere at close range between 5 and 40 m. The backscattered signal was acquired for 1 s in a 2 s duty cycle, the vertical resolution, determined by the balloon ascent speed, was 10 m on average. The detection channels used avalanche photodiodes working in a photon counting mode. The sondes had on-board computers for data acquisition and the data were both stored in mass memory and sent through the OPC's telemetry to the ground station.
LABS is able to measure some optical parameters of the atmospheric particles (Adriani et al., 1998a, b). The primary parameters retrieved from the measurements are backscattering ratio at any used wavelength and volume depolarization. In order to produce the back-scattering ratio, the pressure and the temperature of the external environment have to be used. Such data were directly measured in ¯ight by OPC. On this basis, the signal expected from the molecular atmosphere and the backscattering ratio R could be calculated. R is equal to
(bp+bm)/bm, where bpand bmare the volume
backscat-tering cross sections for particles and molecules,
respec-tively. bpis a function of the particle sizes distribution
and concentration, the refractive index and the
wave-length. At a given wavelength, bmis proportional to the
molecular air density. Essentially, R is a measurement of how much the signal backscattered from the particles exceeds the molecular one. On this basis it is possible to retrieve the vertical structure of the cloud and some
other optical parameters. bp is proportional to the
optical extinction of the cloud and to the average surface area of the particles. The particle extinction coecient,
Ep, can be retrieved by Ep= C*bm*(R)1) where the
parameter C is dependent on the kind of particles involved in the measurement. Values of C can be found in the literature (Collis and Russell, 1976; Jaeger et al., 1991, 1995). R = 1 means that no particles are present in the air volume sounded.
Depolarization measurements were used in PSCs observations to distinguish between liquid and/or solid particles because the former ones, since they are spherical, do not depolarize the backscattered light. According to the most recent theories on PSCs (Peter, 1997), they may be formed by liquid and/or solid particles depending on the air-mass temperature, their thermal history and a proper abundance of their constituents in gas phase to condense. Liquid particles may be supercooled ternary solution droplets (LTA)
H2O/H2SO4/HNO3 and solid particles sulfuric acid
tetra-hydrated (SAT) crystals or, if they experience temperatures lower than about 195 K, nitric acid tri-hydrated (NAT) or, at even lower temperatures, possi-bly ice.
Knowledge of the thermodynamic phase of the particles can help in studies of polar stratospheric clouds which have a key role in ozone depletion in polar stratospheres. Indeed, PSCs formation processes and their other characteristics are not yet well known. The volume depolarization, D, can be computed by the
formula D = k(Sc/Sp) where Spand Scare respectively
the polarized and the cross-polarized signals at a given wavelength measured by the sonde. The calibration constant, k, is calculated making the depolarization equal to 1.4 where no particles are present. Such a value is the one estimated for the pure molecular atmosphere (Young, 1980; Cohen and Low, 1969).
3 Observations
Nine launches of LABS have been carried out in the frame of the SRS project. They are listed in Table 2. Four launches were performed at arctic latitudes, three at mid-latitudes and two in the Southern Hemisphere near the Tropic of Capricorn latitude. The arctic ¯ights were performed both outside and inside the vortex with the main goal of investigating polar stratospheric clouds. Aerosol background measurements were per-formed at the same time. The stratospheric aerosol background was also measured at mid-latitudes and at the tropics. A brief description of all the observations of stratospheric particulate matter during SRS is given hereafter. The most interesting cases illustrated are now under more detailed study.
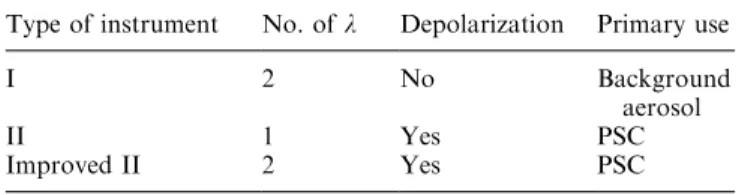
Table 1. Typology of the LABS sondes used in SRS project Type of instrument No. of k Depolarization Primary use
I 2 No Background
aerosol
II 1 Yes PSC
Improved II 2 Yes PSC
Table 2. List of the LABS
ob-servations Date Site Comments
23-1-96 Andoya, Norway Successful. External side of the polar vortex border.
6-2-96 Andoya, Norway Successful. Inside the polar vortex. 26-6-96 Gap, France Successful. No particle data from OPC
11-11-96 Laramie, USA Successful
14-1-97 Andoya, Norway Successful. No particle data from OPC. Inside the polar vortex.
19-1-97 Andoya, Norway LABS failure: payload crash during take-o in strong winds
27-6-97 Gap, France Noisy signal
23-11-97 Bauru, Brazil Telemetry failure at 20 km
3.1 Arctic measurements
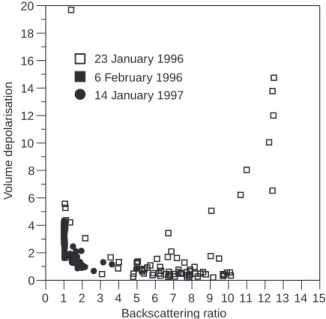
Observations in the arctic region were performed from Andoya during both 1996 and 1997 winters. Four launches took place as listed in Table 2. The two 1996 ¯ights, on 23 January and 6 February, were fully successful. A successful ¯ight was performed also during 1997, on 14 January. PSCs were detected during all three ¯ights. All clouds are reported in the volume-depolariza-tion/backscattering-ratio scatter plot in Fig. 3. The observed PSCs can be classi®ed as Ia, probably NAT or SAT, (6 February, 1996) and Ib, probably LTA, (23 January, 1996 and 14 January, 1997) according to the classi®cation suggested by Browell et al. (1990) based on depolarization and backscattering ratio measurements. In the picture, the 23 January cloud shows a tail going toward type II PSC (ice cloud) due to a depolarizing core observed inside the cloud itself. On the other hand, the top layer of the same cloud can be classi®ed as Ia PSC type.
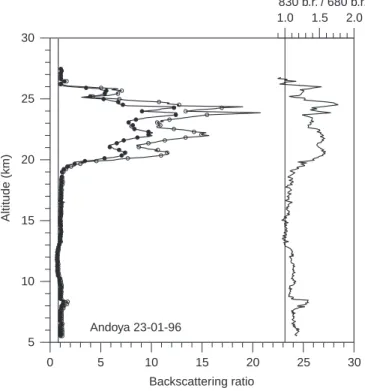
The 23 January, 1996, observation represents a quite unique and interesting case study for the contemporary observations of the same event by laser backscattersonde, optical particle counter, condensation nuclei counter and ground-based ALOMAR lidars at Andoya. The latter were the Norwegian ozone lidar and the French rayleigh lidar. LABS and lidars provided optical measurements of the same cloud at 308, 353, 532, 692, 830 and 1064 nm. So far, most of the scienti®c work has been focused on this case study (Adriani et al., 1998; Deshler et al., 1998, 1999; Fierli et al., 1998). According to correlated information, the cloud was observed on the external side of the polar vortex edge. The PSC, shown in Fig. 4, was observed between 20 and 26 km altitude. It was mostly liquid with a core containing solid particles at 23±24 km; solid particles were also detected at the top of the cloud at 26±27 km. The temperature was close to ice frost point (»185 K) at its minimum inside the cloud. The condensation
temper-ature for ice, NAT (Hanson and Mauerberger, 1988) and LTA (Carslaw et al., 1995) formation are reported in
Fig. 4 on the temperature plot. Values of 4.5 ppmv H2O
mixing ratio at the cloud levels were measured on the same day at Sodankyla in northern Finland by a frost point hygrometer. A value of 10 ppbv has been used for the
HNO3 mixing ratio. Unfortunately, the Lyman-alpha
hygrometer was never able to ¯y in conjuction with LABS ¯ights. Backtrajectories show that the airmass experi-enced a cooling rate of 16 K/day during the previous 36 h. The particle counters showed that all particles in the airmass grew to sizes larger 0.3 lm in diameters (T. Deshler, private communication). Balloon and lidar measurements have been correlated. By combining opti-cal particle counter and laser backscattersonde measure-ments, an index of refraction of 1.47 in the liquid part of the cloud was derived (Deshler et al., 1999).
PSCs were also observed during the other two arctic LABS ¯ights. On 6 February, Andoya was just inside the polar vortex border and a solid PSC was observed at 25± 27.5 km (Fig. 5). Temperatures were relatively high at those altitudes ranging between 200 and 210 K. LABS measurements showed a very low backscattering ratio (1.02±1.03) along with a volume depolarization up to 3± 4%. Contemporaneously, at the same altitude, the optical particle counter showed the presence of a cloud composed by small particles (T. Deshler, personal communication). Since the observed temperature was relatively high for nitric acid tri-hydrated (NAT) cloud particles, it is possible that sulphuric acid tetrahydrate (SAT) particles, very small in size and solid then depolarising, were observed in this case. Evidence of observations of solid sulfate aerosols has been reported in the literature by other authors (Gobbi and Adriani, 1993; Toon et al., 1993; Larsen et al., 1995) but this is the ®rst in situ observation where optical and particle concentration measurements were performed. Backtra-jectory calculations show that the air mass in which the cloud was observed passed over south Greenland 18± 20 h before reaching the Scandinavian peninsula. Tem-perature and wind pro®les, as measured by meteorolog-ical sondes in that area, clearly show a local cyclonic activity associated with gravity wave perturbations propagating to high altitude. The formation of SAT particles could be associated with the formation of solid particles inside the lee waves above Greenland. At the moment, this case is under further investigation. During the same measurement a backscattering ratio from the stratospheric aerosol background of about 1.15±1.2 was observed from the tropopause (about 11 km) to 17 km. During the 1997 arctic campaign, another PSC (liquid, i.e., no depolarizing) was observed at altitudes of 25± 27 km near Andoya on 14 January, 1997, (Fig. 6). The temperature at that altitude range was lower than 186 K with a minimum reaching about 183 K. There, the temperature was about 2 K higher than the ice frost point at that altitude and the cloud was probably formed
by liquid ternary aerosol formed by HNO3/H2SO4/H2O
solution. The condensation temperature versus the altitude for NAT, LTA and ice are plotted in Fig. 6 along with the temperature pro®le. Unfortunately, as
0 1 2 3 4 5 6 7 8 9 10 11 12 13 14 15 Backscattering ratio 0 2 4 6 8 10 12 14 16 18 20 23 January 1996 6 February 1996 14 January 1997 V olume depolar isation
Fig. 3. Volume depolarization versus backscattering ratio scatter plot for PSC measurements during SRS at 692 nm
0 5 10 15 20 25 30 Backscattering ratio 5 10 15 20 25 30 Andoya 23-01-96 1.0 1.5 2.0 830 b.r. / 680 b.r. 0 5 10 15 20 Depolarization ratio (%) Andoya 23-01-96 180 190 200 210 220 Temperature (K) H2O NAT 5 10 15 20 25 30 LTA Altitude (km)
Fig. 4. 23 January, 1996. Left: backscattering ratio at 692 nm (black dots) and 830 nm (open circles) by LABS and color index (solid line) as ratio between two backscattering ratios. Right: volume depolarization
at 692 nm (black dots) and temperature; condensation temperatures are also shown as a function of the ice altitude. LTA and NAT calculated for 4.5 ppmv H2O and 10 ppbv HNO3mixing ratios
1 10
Backscattering ratio / depolarization 5 10 15 20 25 30 Andoya 06-02-96 1.2 br 180 190 200 210 220 Temperature (K) 1.44 dep H2O NAT Altitude (km)
Fig. 5. Polar stratospheric cloud observed over Andoya, Norway, on 6 February, 1996. Backscattering ratio at 692 nm (black dots) and volume depolarisation at the same wavelength (open circles) and temperature; condensation temperature are also reported as function of the altitude for ice and NAT calculated for 4.5 ppmv H2O and 10 ppbv HNO3mixing
ratios 1 10 Backscattering ratio 5 10 15 20 25 30 Andoya 14-01-97 180 190 200 210 220 Temperature (K) 1.0 10.0 Depolarization H2O NAT LTA Altitude (km)
Fig. 6. Polar stratospheric cloud observed over Andoya, Norway, on 14 January, 1997. Backscattering ratio at 692 nm (black dots) and volume depolarisation at the same wavelength (open circles) and temperature; condensation temperature are also reported as function of the altitude for ice, LTA and NAT calculated for 4.5 ppmv H2O
previously mentioned, no particle measurements were taken during this ¯ight so that no comparison between optical data and particle size distribution is possible. 3.2 Mid-latitude and tropical measurements
During the SRS campaigns at mid-latitudes, good measurements were taken only in 1996 (Fig. 7). They are from Gap Tallard in southern France on 26 June and from Laramie, Wyoming, USA, on 11 November. Another ¯ight from Gap Tallard was attempted during
1997 but, some electronic problem made the signal very noisy and, thus those measurements are not reliable for quantitative measurements. All 1996 measurements show cirrus clouds just below the tropopause. The temperature pro®les show tropopause levels very dier-ent from one case to the other. On 26 June, the tropopause above Gap was at about 10 km and, on 11 November, there was a double tropopause at approx-imately 14.8 and 16 km above Laramie with a temper-ature of 200 K.
The backscattering ratio was around 1.2 in both cases with small dierences between wavelengths (Gap
mea-1 10 100 1000 Backscattering ratio Backscattering ratio 0 5 10 15 20 25 30 Gap-Tallard 26-06-96 0 1 2 830 b.r. / 680 b.r. 1.2 Gap-Tallard 26-06-96 0 5 10 15 20 25 30 210 220 230 240 250 260 270 280 290 Temperature (K) 1 10 0 5 10 15 20 25 30 200 220 240 260 280 300 Temperature (K) 1.2 Laramie, 11-11-96 Altitude (km) Altitude (km) Altitude (km)
Fig. 7. Mid-latitude measurements taken on 26 June 1996 at Gap-Tallard, Southern France and on 11 November 1996 at Laramie, Wyoming, USA. Upper left panel: backscattering ratio at 692 (black dots) and 830 (open circles) nm, and colour index (solid line) as ratio between the two backscattering ratios. Upper right panel: tempera-ture. Lower panel: Backscattering ratio at 692 (black dots) and temperature (solid line)
surement) and altitudes. In both cases the aerosol particles extended to high altitude levels. During the 26 June ¯ight, LABS observed the presence of particles up to 27 km (no particle measurements are available from the OPC). On 11 November the optical particle counter measured particles up to 31±32 km. In that case the LABS data were quite close to the instrumental signal background at 27 km and the data above 26 km have been removed from the plot because they lost signi®cance for low signal-to-noise ratio.
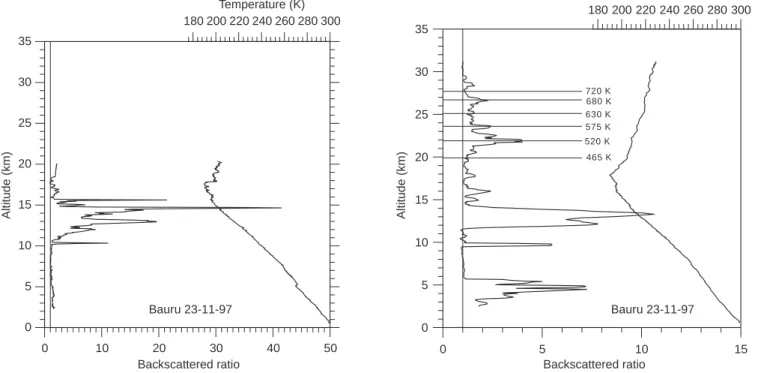
Two launches were performed at Bauru, Brazil, on 23 and 26 November, 1997, (Fig. 8). During the 23 November ¯ight, the telemetry started malfunctioning at the tropopause level (17.5 km) and stopped working completely at 20±21 km because of battery problems. Strati®ed cloud was observed in the troposphere be-tween 10 km and the tropopause at about 16±17 km. The temperature at the tropopause was 190 K.
A similar situation was present in the troposphere three days later during the second ¯ight. On 26 Novem-ber the tropopause was at 17.8 km and its temperature was still 190 K. Various cloud layers were present in the troposphere between 3 and 18 km. In the lower strato-sphere, between 20 and 29 km, a layered aerosol struc-ture was observed. The temperastruc-ture at that interval of altitudes increased from 204 to 224 K. Those aerosols were probably injected in the lower stratosphere at the intertropical convergence zone and advected above the observation site. Nine-days of backtrajectories based on the ECMWF data base have been calculated in order to investigate the origin of those layered aerosol clouds. The backtrajectories have been computed at many isentropic levels between 400 and 720 K and the more
signi®cant layers are shown in Fig. 8. The strati®cation observed in the aerosol pro®le suggests that the injection of this aerosol was quite recent since not much vertical homogeneity was observed. Air mass trajectories from the east show two dierent histories for the two portions of the atmosphere between 19 and 24 km (450±600 K) and between 24 and 28 km (600±720 K). However, they show that both layers passed over central Africa about 9 days earlier, before moving above South America, from southern and northern Zaire respectively. The aerosol layer could easily be injected by a deep convective system which pierced the lowest part of the troposphere and transported the particles up into the lower stratosphere. This case is presently under further investigation. How-ever, the issue of the aerosol budget in the intertropical lower stratosphere has a key role both in the radiation budget of the planet and in the transport of aerosol toward the polar regions. So far, the knowledge in this ®eld is still poor. Questions such as how important is the role of the convective systems in transporting particulate matter from the lower troposphere to the upper tropo-sphere and into the lower stratotropo-sphere or how much of the material is directly transported from the boundary layer and how much is formed in situ are still not completely answered. More extended and systematic investigations into the troposphere±stratosphere ex-changes in the intertropical region are certainly needed. 4 Conclusions
The goal of the Stratospheric Regular Sounding projects was the monitoring of the stratosphere using various
180 200 220 240 260 280 300 0 5 10 15 20 25 30 35 0 10 20 30 40 50 0 5 10 15 0 5 10 15 20 25 30 35 180 200 220 240 260 280 300 465 K 520 K 575 K 630 K 680 K 720 K Bauru 23-11-97 Bauru 23-11-97
Backscattered ratio Backscattered ratio
Altitude (km) Altitude (km)
Temperature (K)
Temperature (K)
Fig. 8. Tropical measurements at Bauru, Brazil. Backscattering ratio and temperature pro®les as measured on 23 and 26 November 1997. Backscattering ratios are measured at 692 nm. On the right panel, the most signi®cant insentropics levels at which the backtrajectories have been calculated
instruments ¯own by small balloons at dierent lati-tudes and seasons in low-volcanic aerosol conditions. In fact, the last large eruption was from Mount Pinatubo in June 1991 from Philippines. The use of small balloons permitted us to reduce signi®cantly the campaign costs along with an easy access to launching facilities in dierent parts of the world. The SRS project demon-strated the complete success of such a kind of observa-tion strategy.
A quite wide amount of data on the status of the stratosphere was taken during the years 1996±1997. The dierent instruments provided measurements on several
stratospheric gases like O3, H2O, N2O, CFCs, CH4,
NO2, OClO, BrO. They also sampled particles like
background aerosols and PSCs, pressure and tempera-ture at dierent latitudes and from the tropopause up to 30 km. During this project a laser backscattersonde (LABS) was operated giving measurements of back-ground aerosol and polar stratospheric clouds. The most interesting observations were made in the arctic, on polar stratospheric clouds, and in the tropics.
At least two of the polar stratospheric clouds resulted in quite interesting case studies. The PSC observed on 23 January, 1996, was simultaneously observed by two groundbased lidars and in situ by OPC-LABS. This is the ®rst measurement of the refractive index in the visible range of wavelengths of the liquid ternary solution particles. A refractive index of 1.47 at 692 nm was measured by the combination of OPC and LABS data. Such a cloud was observed on the external side of the polar vortex edge. The other PSC, observed in the same year on 6 February, appears to be a clear example of clouds formed of SAT particles generated out of a gravity wave perturbation consequent to a cyclonic circulation above south Greenland. This case is still under study.
Both arctic and mid-latitude measurements of back-ground aerosols gave backscattering ratios of 1.2 at 692 nm during 1996. It was observed that the back-ground aerosol layer extended up to 25 km over France and even higher over central America where the tropo-pause was split into two distinct levels at 14.8 and 16 km. Consequently the aerosol background layer was observed extending above 30 km.
In the tropics, quite strati®ed aerosol layers were observed in the lower stratosphere between 20 an 30 km. The strati®cation suggests the presence of relatively young aerosols recently injected into the stratosphere possibly by a deep convective system. More systematic observation would be needed in the future for a better characterization of the aerosol budget in the inter-tropical regions.
Acknowledgements. Topical Editor F. Vial thanks U.P. Hoppe and another referee for their help in evaluating this paper.
References
Adriani, A., F. Cairo, M. Viterbini, S. Mandolini, and G. Di Donfrancesco, Multiwavelength aerosol scatterometer for air-borne experiments to study the optical properties of the stratospheric aerosol, J. Atmos. Ocean. Tech., (in press), 1999.
Adriani, A., F. Cairo, S. Mandolini, G. Di Donfrancesco, T. Deshler, and B. Nardi, A new joint balloon-borne experiment to study polar stratospheric clouds: laser backscatter sonde and optical particle counter, in Eds. R.D. Bojkov, and G. Visconti, Atmospheric Ozone, Proceedings of XVIII Quadriennial Ozone Symposium, vol 2, 879±882, Edigra®tal for Parco Scienti®co e Tecnologico d'Abruzzo, 1998.
Browell, E. V., C. F. Butler, S. Ismail, P. A. Robinette, A. F. Carter, N. S. Higdon, O. B. Toon, M. R. Schoeberl, and A. F. Tuck, Airborne lidar observations of nitric acid aerosol formation in the wintertime Arctic stratosphere: 1, polar stratospheric clouds, Geophys. Res. Lett., 17, 385±388, 1990.
Carslaw, K. S., B. Luo, and Te. Peter, An analytic expression for the composition of acqueous HNO3-H2SO4stratospheric
aero-solincluding gas phase removal of HNO3, Geophys. Res. Lett.,
22, 1877±1880, 1995.
Cohen, A. J., and W. Low, An experimental determination of the depolarization of scattered laser light by atmospheric air, J. Appl. Meteorol., 8, 952±954, 1969.
Collis, R. T. H., and P. B. Russel, Lidar measurements of particles and gases by elastic backscattering and dierential absorption, in Laser Monitoring of the Atmosphere, Ed. E.D. Hinkley, Topics in Applied Physics, Springer-Verlag, Berlin Heidelberg New york 1976.
Danis, F., K. Persson, H. Nilsson, A. D. Robinson, M. P. Chipper®eld, J. D. McIntyre, P. G. Simmonds, N. R. P. Harris, and J. Pyle, Tracer measurements with DESCARTES during ILAS in early 1997, Proc. of 4thEuropean Symposium on Polar
Stratospheric Ozone Research, Schlierzee, Bavaria, Sept. 1997, EC Air pollution research report 66, 423±426, 1998.
Deniel, C., R. M. Bevilacqua, F. Lefevre, and J. P. Pommereau, Measued and simulated ozone ozone loss in the arctic polar vortex in 1996, Geophys. Res. Lett., (in press), 1998.
Deshler, T., B. J. Johnson, and W. R. Rozier, Changes in the character of polar stratospheric clouds over Antarctica in 1992 due to the Pinatubo volcanic aerosol, Geophys. Res. Lett., 21, 273±276, 1994.
Deshler, T., B. Nardi, A. Adriani, F. Cairo, G. Hansen, and F. Fierli, The characterization of polar stratospheric clouds above Scandinavia by combining in situ measurements and lidar, On polar stratospheric ozone 1997, Proc. of the IV European Symposium, Eds. N.R.P. Harris I. Kilbane-Dawe G.T. Ama-natidis, EUR 18032, 1998.
Deshler, T., B. Nardi, A. Adriani, F. Cairo, G. Hansen, and F. Fierli, Determining the index of refraction of polar stratospheric clouds above Andoya (69°N) by combining size resolved concentration and optical scattering measurements, J. Geophys. Res., in press, 1999
Fierli, F., F. Cairo, L. Pulvirenti, B. Nardi, S. Mandolini, G. Di Donfrancesco, A. Adriani, A. Hauchecorne, F. Goutail, A. Sarkissian, T. Deshler, V. Rizi, G. Redaelli, G. Visconti, and B. Knudsen, Jan 23rd 1996 PSC above Andoya: dierent aerosol characteristics retrieval from backscatter data, com-parison with optical particle counter measurements and interpretation by Lagrangian box modelling, On polar strato-spheric ozone 1997: Proc. of the IV European Symposium, Eds. N.R.P. Harris I. Kilbane-Dawe G.T. Amanatidis, EUR 18032, 1998.
Gobbi, G. P., and A. Adriani, Mechanisms of formation of stratospheric clouds observed during the Antarctic late winter of 1992, Geophys. Res. Lett., 20, 1427±1430, 1993.
Hanson, D. R., and K. Mauersberger, Laboratory studies of the nitric acid trihydrate: implication for the south polar strato-sphere, Geophys. Res. Lett., 15, 855±858, 1988.
Hofmann, D. J., and T. Deshler, Stratospheric cloud observations during formation of the Antarctic ozone hole in 1989, J. Geophys. Res., 96, 2897±2912, 1991.
Jaeger, H., and D. Hofmann, Midlatitude lidar backscatter to mass, area, and extintion conversion model based on in situ aerosol measurements, Appl. Opt., 30, 127±138, 1991.
Jaeger, H., T. Deshler, and D. Hofmann, Midlatitude Lidar backscatter conversion model based on ballon-borne aero-sol measurements, Geophys. Res. Lett., 22, 13, 1729±1732, 1995.
Khattatov, V., V. Yushkov, I. Zaitzev, M. Khaplanov, J. Rosen, and N. Kjome, Some results of water vapor, ozone and aerosol balloon borne measurements during EASOE., Geophys. Res. Lett., 21, 13, 1299±1302, 1994.
Larsen, N., J. M. Rosen, N.T. Kjome, and B. Knudsen, Deli-quiscence and freezing of stratospheric aerosol observed by balloon-borne backscattersonde, Geophys. Res. Lett., 22, 1233± 1236, 1995.
Lambert, J-C., M. Van Roozendael, M. De Maziere, P. C. Simon, J-P. Pommereau, F. Goutail, A. Sarkissian, and J. F. Gleason, Investigation of to pole ± to pole performances of space-borne atmospheric chemistry sensors with the NDSC, J. Atmos. Sci., 56, 176±193, 1999.
Nilsson, H., K. Persson, F. Danis, N. Harris, and J. Pyle, CFC measurements with DESCARTES during the ILAS validation campaign ± early results, Proc. 13thESA Symposium on Rocket
and Balloon Programmes and Related Research, ESA SP-397, 231±236, 1997.
Peter, T., Microphysics and heterogeneous chemistry of polar stratospheric clouds, Ann. Rev. Phys., 48, 779±816, 1997.
Pommereau, J. P., F. Goutail, J. Piquard, L. Denis, and C. Phillips, The SAOZ balloon optical sonde for atmospheric chemistry study, Proc. 11th ESA Symp. Eur. Rocket and Balloon Prog., ESA SP 355, 87, 1994.
Pommereau, J. P., J. A. Pyle, and R. Zellner, Stratospheric chemistry, in European Research in the Stratosphere, Chap. 4, Stratospheric Chemistry, Ed. European Commission, Report EUR 16986 EN, 1998.
Preston, K. E., R. L. Jones, and H. K. Roscoe, Retreival of NO2
vertical pro®les from ground-based UV-visible measurements: method and validation, J. Geophys. Res., 102, 19089±19097, 1997. Pundt, I., J. P. Pommereau, C. Phillips, and E. Lateltin, Upper limit of iodine oxide in the lower stratosphere, J. Atmos. Chem., 30, 173±185, 1998.
Pyle, J. A., G. D. Carver, and U. Schmidt, Some case studies of chlorine activation during the EASOE campaign, Geophys. Res. Lett., 21, 1431±1434, 1994.
Toon, O., E. Browell, B. Gary, L. Lait, J. Livingston, P. Newman, R. Pueschel, P. Russel, M. Schoeberl, G. Toon, W. Traub, F. P. J. Valero, H. Selkirk, and J. Jordan, Heterogeneous reaction probabilities, solubilities, and the physical state of cold volcanic aerosols, Science, 261, 1136±1140, 1993.
Young, A. T., Revised depolarization correction for atmospheric extinction, Appl. Opt., 19, 3427±3428, 1980.