HAL Id: hal-03220565
https://hal.archives-ouvertes.fr/hal-03220565
Submitted on 28 May 2021
HAL is a multi-disciplinary open access
archive for the deposit and dissemination of
sci-entific research documents, whether they are
pub-lished or not. The documents may come from
teaching and research institutions in France or
abroad, or from public or private research centers.
L’archive ouverte pluridisciplinaire HAL, est
destinée au dépôt et à la diffusion de documents
scientifiques de niveau recherche, publiés ou non,
émanant des établissements d’enseignement et de
recherche français ou étrangers, des laboratoires
publics ou privés.
Experimental investigation of the interaction between
two oscillating gas bubbles
Gabriel Regnault, Cyril Mauger, Philippe Blanc-Benon, Claude Inserra
To cite this version:
Gabriel Regnault, Cyril Mauger, Philippe Blanc-Benon, Claude Inserra. Experimental investigation
of the interaction between two oscillating gas bubbles. Forum Acusticum, Dec 2020, Lyon, France.
pp.3457-3460, �10.48465/fa.2020.0221�. �hal-03220565�
EXPERIMENTAL INVESTIGATION OF THE INTERACTION BETWEEN
TWO OSCILLATING GAS BUBBLES
Gabriel Regnault
1,2Cyril Mauger
1Philippe Blanc-Benon
1Claude Inserra
21
Laboratoire de M´ecanique des Fluides et d’Acoustique, Ecully, France
2Laboratoire d’Application des Ultrasons `a la Th´erapie , Lyon, France
ABSTRACT
Two closely spaced bubbles, if oscillating, are subjected to an interaction force. This force, first discovered at the be-gining of the 20thcentury [1], takes part in the complex phenomena occuring during the cavitation process (bub-ble cluster behavior, bub(bub-bles filament, . . . ). Qualitative agreement between theoretical approaches and the exper-imental measurements have already been achieved in lit-terature [2–4]. In this study, we propose an experimental method that allows assessing at two time scales this in-teraction with quantitative estimation of the force. Both the bubble oscillations and their 2-D motions are recorded. This method provides material to compare purely exper-imental observations (the bubbles motion) to interaction force theory in which bubbles radial oscillations are input parameters.
1. INTRODUCTION
A gas bubble in water, set in an acoustic field, behaves following the hydrodynamic and acoustic forces acting upon it. Because the bubble is acoustically driven, it oscil-lates and behaves in the linear regime as a local monopole source. If now two closed bubbles are considered, the local pressure gradient created by one of the bubbles influences the other one, generating a supplementary and mutual interaction force : the secondary Bjerknes force. This force can be either attractive or repulsive, depending on the radii at rest of the bubbles, the excitation frequency and the external pressure amplitude (in the case of nonlinear oscillations, which is not discussed here). If the oscillations are in phase, the bubbles attract each other, if not they repel [5]. In other words, if the excitation frequency lies in between the two natural frequencies of the bubbles they repel each other, otherwise they will move toward each other. The original theoretical approach have been overhauled by many authors by taking into account more realistic parameters such as multiple wave scatering between two bubbles [6] or the non-linearities in the oscillations [7]. Numerical studies [8, 9] have also enabled to better understand the complex characteristics of this force but only few experimental procedures have been developed.
A pioneer study in this domain was made by Crum [2] in which he proposed a way to measure the interaction force acting upon a bubble couple from the approaching velocities of two free bubbles in a standing wave. This set-up have been overhauled by many other authors [3,4], who used more suited excitation frequencies (in the kilohertz range) and managed to make their results qualitatively con-form with improved theories [4, 8]. Other methods, us-ing wall-attached bubbles [10, 11] or optical tweezers and coated-bubbles [4] managed to increase precision in the force measurement. The present study aims at complet-ing the litterature results for free bubbles in a unbounded fluid. We use a new experimental set-up which allows not only to measure the secondary Bjerknes force but also to capture the temporal behavior of the bubbles interface. It provides information of great interest for the purpose of comparison between the experimental results and existing theories. The present study is focused on the case of at-tracting secondary Bjerknes forces for bubbles oscillating spherically in the linear regime.
2. THE EXPERIMENTAL SET-UP
Water
tank
BF transducer
HF transducer
Pressurized
air
Ultra-fast
camera
LED
source
BubblesFigure 1. Experimental system used to assess the sec-ondary Bjerknes force and to capture the bubbles oscilla-tion.
The bubble pair is set on two consecutive nodes of pres-sure of a1 MHz standing wave created in a 8cm-edge cu-bic tank. Bubbles are pushed through the tip of a thin
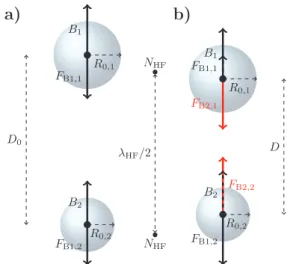
capillary (ID20 μm), fed by an air compressor (Newport, ACWS). The size of the bubbles can be slighly tuned using a microfluidic pressure controller (Elveflow, OB1 MK3). The bubbles are placed in the focal plane of a high frame-rate camera (Vision Research V12.0) equipped with a 12× objective lens (Navitar). A measurement session is divided in two distinct steps (note that for a given session, both the water tank and the camera remain fixed). The first one con-sists in determining the 1 MHz acoustic field. Since the trapping frequency is really high, it is not possible to pre-dict with accuracy the acoustic pressure field (a small error in the measurement of the tank’s dimensions impacts a lot on the computed field). Direct measurements of the field are also not acurate enough for our prupose. We propose here an indirect method to determine the spatial evolution and amplitude of the 1 MHz pressure field. The bubbles are trapped at a given voltage input. They remain fixed due to force balance between the primary Bjerknes force (acoustic radiation force acting on bubbles) and buoyancy (see figure2.a). When submitted to a 1 MHz field, the bub-ble does not experience oscillation since the resonance fre-quency for the studied bubble is in thekHz range. When the amplitude of the field in increased, buoyancy beeing constant (the volume of the bubbles does not change), only the trapping force is increased. Both the bubbles move to-wards the nodes, following an exponential behaviour. An exemple of bubble positions evolution for this calibration part is illustrated in figure 3.a)). For each input voltage, a positional stability is reached. Thus the spatial evolution of the field (which is assumed unchanged whatever the am-plitude) as well as the amplitude of the field associated to a given input voltage can be determined. An estimation of the amplitude is made on each bubbles. The result kept for the following is the average of the two series (see figure 3.b)).
Once the set-up is calibrated, the second step consists in the measurement of the secondary Bjerknes. The high-frequency pressure amplitude is set to a given value and does not change during the following steps. In order to make the bubble interact, a low-frequency wave is set in the tank (31.9 kHz). This acoustic wave is considered as a plane propagating wave (no resonance phenomenon is observed). The bubbles separation distance beeing small compared to this low-frequency wavelength, both of them are submited to the same pressure amplitude. While they oscillate, they also attract each other. When the low-frequency amplitude is step-by step increased, the bubbles oscillate with larger amplitudes, and thus the attraction force increases. Because they lay in the1 MHz trapping field, they move toward each-other but stabilize at fixed positions for each values of low-frequency amplitude pressure set in the tank. The force balance in this case is summarized in figure 2.b).
3. RESULTS AND DISCUSSION
During the measurement, the bubble oscillations remain in the limit of small linear amplitude (amplitude of oscillation
R0,1 R0,2 D0 B1 B2 FB1,1 FB1,2 NHF NHF λHF/2 R0,1 R0,2 D FB2,1 FB2,2 B1 B2 FB1,1 FB1,2
a)
b)
Figure 2. Schematic representation of the forces seen by the bubble with (a) or without (b) low frequency acous-tic excitation. NHFrefers to the position of the high fre-quency nodes separated by half the wavelength, R0,i for the radii at rest of the two bubbles andBi,FB1,iandFB2,i
respectively for the buoyancy force, the primary and the secondary Bjerknes forces.
of less than 10 % of the radius at rest). In this specific case, Crum derived a formula that predicts the interaction force [2]. The force expresses as :
FB2,i = −2πρω2R
2
0,1a1R20,2a2
D2 cos (φ) ur,i, (1)
where D [m] is the distance between the bubbles, ur,i is the vector along axis passing through the center of the bubbles, R0,1 [m] and R0,2 [m] are respectively the
radii at rest of the bubbles 1 and 2. a1 [m] and a2 [m]
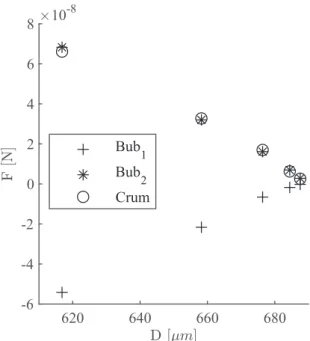
stands for the bubble oscillation amplitudes and φ [rad] is the phase shift between the two oscillators. In the case of Crum’s formula, no attenuation is taken into account in the derivation, hence the phase shift can only be 0, and in this case the bubbles attract each other, or π and leading to bubble bubble repulsion. The indexi = 1, 2 indicates that the force is the one seen by the bubble ”i”. Because the present set-up enables the measurement of the bubbles radii, their oscillation amplitudes and the distance between them, this formula can be easilly used to obtain an estimate of the interaction both by using Eq.(2) or from the force balance procedure. Results for a serie are given in figure 4.
In our experimental configuration, the bubble on the top (bubble 1 on the plots) sees a negative interaction force (i.e. a force on the vertical axis oriented to the bubble on the bottom). Likewise, the bubble on the bottom (bubble 2 on the plots) undergoes a positive interaction force. The force derived from Crum theory is in very good agreement with the measured ones. Multiple series of measurement have been conducted, all corroborating results from figure 4. This global results can be found
0 200 400 600 800 1000 0 0.5 1 120 140 160 180 200 220 240 260 50 100 150 200 250 300
a)
b)
Figure 3. a) Bubble position evolutions with increasing high-frequency voltage input. b) Estimated pressure am-plitude, associated to a given voltage input, for each bubble (+ and ∗) and averaged value (•).
in [12].
Using this new experimental technique, we managed to assess the secondary Bjerknes force acting between two oscillating bubbles. The set-up enables to get acurate values of the force. Also, the oscillations can be recorded and be directly implemented in a simple linearized model. A good agreement is shown between the direct method and the analytical one. It is worth noting that the distance between the two bubbles remains large compared to the radii of the bubbles. Thus multiple scattering effects can be disregarded in our study. Particularly, when bubbles approach as close as three times the mean bubble radius, no evidences of deviation from Crum’s model have been observed.
This work opens new possibilities of experimental approaches on bubble interactions. It can also allows taking into account not only the acoustic interaction force but the hydrodynamic one, occuring when acoustic microstreaming is generated in the vicinity of the bubbles. This phenomenon add a fluid interaction in the force bal-ance, which can modify the overall interaction force. This study report a new method to understand the n-bubbles interaction configuration (bubble clusters) which happens in industrial or medical application of cavitation.
Acknowledgements
This work was supported by the LabEx CeLyA of the Uni-versity of Lyon (ANR-10-LABX-0060 / ANR-11-IDEX-0007). The authors also acknowledge A.A. Doinikov for helpful discussions. 620 640 660 680 -6 -4 -2 0 2 4 6 8 10 -8 Bub1 Bub2 Crum
Figure 4. Estimated interaction force on each bubble. The + and ∗ are obtained from the force balance method and the◦ with Crum formulas (only the amplitude of the pre-dicted force is depicted).
4. REFERENCES
[1] V. F. K. Bjerknes, “Fields of Force,” Columbia Univer-sity Press, 1906.
[2] L. A. Crum, “Bjerknes forces on bubbles in a stationary sound field,” The Journal of the Acoustical Society of America, vol. 57, pp. 1363–1370, June 1975.
[3] J. Jiao, Y. He, S. E. Kentish, M. Ashokkumar, R. Man-asseh, and J. Lee, “Experimental and theoretical analy-sis of secondary Bjerknes forces between two bubbles in a standing wave,” Ultrasonics, vol. 58, pp. 35–42, Apr. 2015.
[4] T. Barbat, N. Ashgriz, and C.-S. Liu, “Dynamics of two interacting bubbles in an acoustic field,” J. Fluid Mech., vol. 389, pp. 137–168, June 1999.
[5] M. Ida, “A characteristic frequency of two mutually in-teracting gas bubbles in an acoustic field,” Physics Let-ters A, vol. 297, pp. 210–217, May 2002.
[6] A. A. Doinikov and S. T. Zavtrak, “On the mutual in-teraction of two gas bubbles in a sound field,” Physics of Fluids, vol. 7, pp. 1923–1930, Aug. 1995.
[7] A. Harkin, T. J. Kaper, and A. Nadim, “Coupled pulsa-tion and translapulsa-tion of two gas bubbles in a liquid,” J. Fluid Mech., vol. 445, pp. 377–411, Oct. 2001. [8] R. Mettin, I. Akhatov, U. Parlitz, C. Ohl, and
W. Lauterborn, “Bjerknes forces between small cavi-tation bubbles in a strong acoustic field,” Phys. Rev. E, vol. 56, pp. 2924–2931, Sept. 1997.
[9] Y. Zhang, Y. Zhang, and S. Li, “The secondary Bjerknes force between two gas bubbles under dual-frequency acoustic excitation,” Ultrasonics Sonochem-istry, vol. 29, pp. 129–145, Mar. 2016.
[10] M. Lanoy, C. Derec, A. Tourin, and V. Leroy, “Manip-ulating bubbles with secondary Bjerknes forces,” Appl. Phys. Lett., vol. 107, p. 214101, Nov. 2015. arXiv: 1510.06866.
[11] K. Yoshida, T. Fujikawa, and Y. Watanabe, “Experi-mental investigation on reversal of secondary Bjerk-nes force between two bubbles in ultrasonic standing wave,” The Journal of the Acoustical Society of Amer-ica, vol. 130, pp. 135–144, July 2011.
[12] G. Regnault, C. Mauger, P. Blanc-Benon, and C. In-serra, “Secondary radiation force between two closely spaced acoustic bubbles,” Phys. Rev. E, vol. 102, p. 031101, Sept. 2020.