To cite this document: Benard, E. and Huang, J.-C. and Raghunathan, S.
Experimental investigation of unsteadiness in transonic shock boundary layer
interaction. In: 45th AAAF Symposium of Applied Aerodynamics, 22-23-24
March 2010, Marseille, France.
OATAO is an open access repository that collects the work of Toulouse researchers and
makes it freely available over the web where possible.
This is an author-deposited version published in:
http://oatao.univ-toulouse.fr/
Eprints ID: 5148
Any correspondence concerning this service should be sent to the repository
administrator:
[email protected]
Experimental investigation of unsteadiness in transonic shock
boundary layer interaction
Emmanuel Benard(1)
, Jui-Che Huang(2)
, S. Raghunathan(2)
(1)
Department of Aerospace Engineering, University of Glasgow, Glasgow G12 8QQ, United Kingdom, [email protected]
(2)
Centre of Excellence for Integrated Aircraft technology, School of Mechanical and Aeronautical Engineering, Queen’s University of Belfast, Belfast, BT9 5AH, United
Kingdom
Abstract
Transonic shock wave/boundary layer interaction over a wall-mounted bump was investigated with specific focus on shock wave unsteadiness and identification of its source. A large separation bubble resulted of an interaction driven by a flow characterized by a peak Mach number of 1.365. Overall this particular type of transonic unsteadiness is characterized with low amplitude and relatively high frequency motion. Low frequency shock unsteadiness was optically estimated and matched spectral content of wall fluctuating pressure. A strong correlation between separation onset and reattachment zones suggested a model of bubble expansion/contraction at the reattachment point where upstream-traveling pressure waves are generated and cause the shock wave excursions.
1. Introduction
Although shock wave/boundary-layer interactions have been studied on their own for more than 60 years [1][2], this field of research still attracts a significant volume of work as the general consensus is that some key issues are not yet understood and correctly predicted. Extensive reviews prove the richness and complexity of physical processes involved in those interactions [3][4][5][6][7].
In the most general case unsteadiness results from several contributions: upstream turbulence, shock motion, separation bubble dynamics, including
shear layer behavior. Interactions inducing
separation exhibit some level of unsteadiness, whatever the configuration considered, i.e incident shock interaction or surface generated.
Smits and Dussauge [7] stated that when pressure rise is strong enough, the boundary layer starts to separate and it leads to a considerable increase in turbulence level across the interaction. The upstream and downstream flows are unsteady and low frequency shock oscillation, typically at
frequencies two orders of magnitude lower than encountered in the incoming flow, is observed. Two
possible mechanisms for shock system
unsteadiness were proposed to explain the unsteadiness of shock wave system [8].
Andreopoulos & Muck [9] and Smith & Muck [10] suggested that the incoming turbulence plays a dominant role in triggering the shock unsteadiness; as the shock wave unsteadiness could originate from the bursting frequency of the incoming boundary layer. Speculated for a while [11][12], upstream elongated low- and high-speed regions, of streamwise lengths greater than many tens of boundary layer thickness, are now suspected to trigger undulation of the instantaneous spanwise separation line and to be at the source of its back and forth low-frequency motion [13].
Alternatively, or concurrently, the response of a shock wave may depend on some downstream flow dynamics. Smits and Dussauge [7] mentioned that if the separated zone has significant features in common with mixing layers, the flow would be sensitive to the compressibility effect, as the free shear flow are. Erengil and Dolling [14] found that the low frequency oscillations of the shock wave is caused by the contraction and expansion cycle of separated zone, where the separated zone is the source of large-scale of fluctuations. Dussauge et al. [15] suggested that low-frequency unsteadiness
could be characterized by a Strouhal
number, s L e f L S U
, based on the shock frequency fs,
the average separation length L, and an external
velocity Ue. Recent contributions of Touber and
Sandham [16], based on a very long running time LES with a digitally filtering inlet condition, thus avoiding any low-frequency recycling pattern, demonstrated the existence of low-frequency unsteadiness with no connection with upstream conditions. Development of a linear-stability analysis of the base flow also led them to find that the most unstable mode is essentially two-dimensional and
affects the bubble dynamics within time-scales compatible with the one observed in the low-frequency range. Piponniau et al. [17] proposed a simple model for prediction of low-frequency, large-scale pulsation of the separated flow, based on the physical model outlined by Wu and Martin [18] but extended to take into account the marked compressibility effects associated with mixing layers.
The transonic case, characterized by a subsonic downstream flow, offers specific challenges as they exhibit mutual interactions between bi-directional traveling pressure waves, significant shear-layer sensitivity to compressibility, above all aspects exposed earlier. Initially studies on transonic interactions have been dedicated to characterization of mean flow properties [19][20]. Some rare detailed investigations were carried out specifically in the transonic regime in the 1960’ [21]. Only much later
some works have been targeted at the
characterization of transonic diffuser flow
oscillations [22]. Experimental surveys have
progressively demonstrated that transonic flow over a bump, in the case of strong interaction with boundary layer behind the shock, is unsteady [23]. Overall there is still debate on the subject of the root causes of the low frequency behavior and no specific scenario is firmly recognized by the research community. The objective of this work is to improve the understanding of transonic flow shock unsteadiness in the process of the shock wave boundary layer interaction as this type of flow has been less studied recently than supersonic or even hypersonic cases.
2. Experimental arrangement
The experimental investigations were carried in an in-draft transonic wind tunnel at Queen’s University Belfast [24], [25]. The test section is square at the inlet, and of constant width, 101.6 mm. A contoured wall was designed [25] for the roof of the test section, opposite the bump, to eliminate the pressure gradient effect upstream of the bump and to minimize the occurrence of interactions on the roof for the testing conditions. The wall-mounted, circular-arc bump has a maximum height of 9.14mm and chord length of 101.6mm. The bump leading edge is located 355.4mm from the inlet of the test section and is used as the reference point of the distance X*, made dimensionless with the bump chord.
Delery and Marvin [26], Liu and Squire [27] stated that for shock wave boundary layer interaction with extensive separation occurs over curved surfaces the peak Mach number must
exceed 1.30. For this reason, the peak Mach number was fixed at 1.365 and the corresponding free stream Mach number is 0.783. Incoming boundary layer thickness and Reynolds number based momentum thickness are 5.3 mm and 1.1 104
, respectively. Special care was given to keep testing conditions relatively dry, typically within the range of 10%-13% [28].
A FASTCAM-X 128PCI 4K high-speed camera was set to view the whole interaction structure through Schlieren flow visualization, under a resolution of 640x256 pixels and sampling frequency of 2000Hz, for assessment of its unsteadiness.
The unsteady pressure measurements were taken from piezoresistive pressure sensors (Kulite XCS-062-10D), installed in 2.4 mm wide cavity through the base of the model leading to 0.5mm diameter orifices on the surface. The natural frequency of the cavity was estimated around 10kHz.
3. Results and discussion
3.1 Mean flow properties
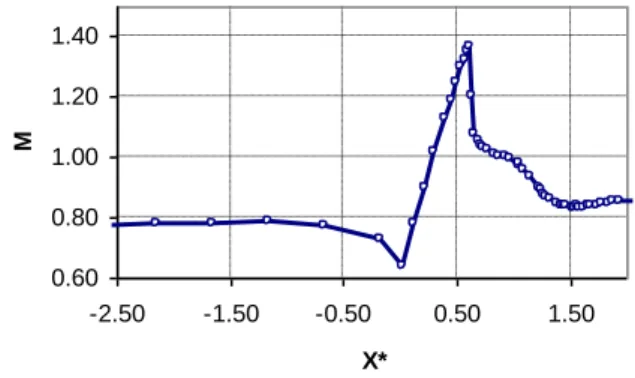
Isentropic Mach number distribution, calculated from static pressures measured at wall and inlet stagnation pressure and assuming an isentropic relationship, was used to characterize the mean flow features of the flow (figure 1). Following an upstream plateau, showing that upstream pressure gradient is negligible, an initial dip from X*=-0.50 to 0 defines the flow approaching the bump leading edge. Then, from the leading edge to the location of peak Mach number, the distribution follows an almost linear trend line.
0.60 0.80 1.00 1.20 1.40 -2.50 -1.50 -0.50 0.50 1.50 X* M
Fig. 1 Isentropic Mach number distribution over the
bump (M=0.783 Ms=1.365).
From the examination of the isentropic Mach number distribution and a Schlieren picture (figure 2) the position of the shock wave and the onset of separation can be estimated at X*=0.63 and 0.65,
respectively. The nearly sonic downstream plateau ending at the trailing edge showed behind shock wave is characteristic of such strong interaction [19][26] as it results of the coupled effects of deceleration behind the shock and the acceleration due to the blockage created by the separation bubble. From the trailing edge to approximately X*=1.4, location of the reattachment line confirmed by China clay visualizations, the flow slows down to a Mach number a bit larger than the freestream value.
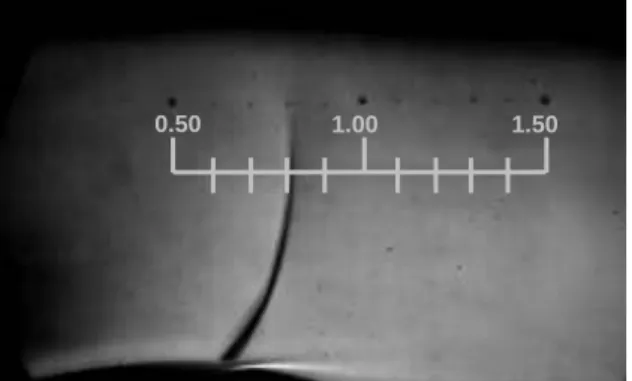
Fig. 2 Schlieren image on Shock wave boundary
layer interaction (M=0.783 Ms=1.365)
The blur aspect of the shock wave is the result of the Schlieren spatial integration and demonstrates that the shock is curved, in particular in the foot region of the shock. This feature reflects the three-dimensional nature of the interaction, as confirmed by China clay surface visualizations. Wall corner vortices were clearly detected downstream of the shock wave and, as a result, a quasi-two-dimensional flow region subsists around the centerline of the bump, covering about 30% of the test section bump span. The current investigation focuses on the two-dimensional region of the interaction, and all wall measurements were carried out in the centre line of the bump model. But the strong three-dimensionality of the interaction should be kept in mind as it might be itself a source of unsteadiness, as stressed by Dussauge et al. [15].
3.2 Optical Shock unsteadiness measurements
The unsteady phenomenon was first observed in the high speed Schlieren images. Series pictures of 8192 shock wave images were taken at a sampling frequency of 2000Hz. Longitudinal cutting-lines were used to compose visualizations of temporal behavior of shock fronts (figure 3). The black region of the image presents the shock wave position and the white line in front of the shock wave corresponds to an upstream compression region. The variation of the compression line position is much less than the shock motion and therefore it indicates that upstream condition is very stable.
Spectral analysis of compression line position does not exhibit any specific frequency, at least in the 50 to 1000 Hz. This element suggests that flow unsteadiness may not come from upstream turbulent boundary layer fluctuations.
streamwise distance (X*) ti m e (s e c o n d ) 80 70 60 50 0.5 1.0 1.5 2.0 2.5 3.0 3.5 4.0
Shock wave position
Fig. 3 Optical measurements from Schlieren images Four heights were surveyed for examination of shock wave unsteadiness (figure 4). Standard deviation of the show position, at Y/C=0.4 height, was approximately 4 mm. In the spectral domain a distinct peak was found in the 325-400 Hz region, for the four investigated levels, consistent with the findings of Bron [23].
Fig. 4 Power spectral density of shock motion
3.3 Unsteady wall pressure measurements
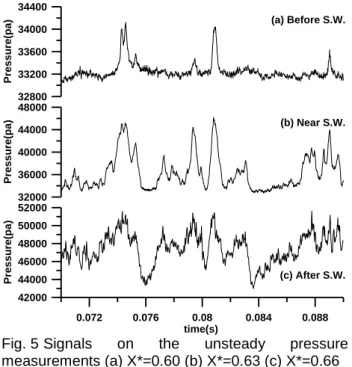
Instantaneous wall pressure signals show highly intermittent nature before and near the shock wave (figure 5). Wall pressure time-histories, near the shock wave location but also shortly ahead of shock wave, reveal intermittency close to 50% and a random pattern. 0.50 1.00 1.50 0 0.1 0.2 0.3 0.4 0.5 0.6 10 100 1000 f (Hz) f E (f ) (a rb it ra ry s ca le ) Y/C=0.40 Y/C=0.30 Y/C=0.15 Y/C=0.05
32800 33200 33600 34000 34400 P re s s u re (p a ) 32000 36000 40000 44000 48000 P re s s u re (p a ) 0.072 0.076 0.08 0.084 0.088 time(s) 42000 44000 46000 48000 50000 52000 P re s s u re (p a ) (a) Before S.W. (b) Near S.W. (c) After S.W.
Fig. 5 Signals on the unsteady pressure
measurements (a) X*=0.60 (b) X*=0.63 (c) X*=0.66 Examples of streamwise distribution of r.m.s wall pressure fluctuations normalized by upstream dynamic pressure are shown in figure 6, for
M∞=0.66 and M∞=0.783, cases which correspond to
tests of shock absence and shock boundary layer interaction, respectively. When the peak Mach number reaches 1.365, the maximum pressure fluctuations appeared near the shock wave position. In the flow separation zone behind the shock wave, the pressure fluctuations increase all the way through the separation bubble and reach a second maximum, at the reattachment position near X*=1.40. The second fluctuation peak may be associated with the shear layer dynamics and the occurrence of flow reattachment, moving back and forth. -2 -1 0 1 2 X* 0 4 8 12 Prm s /q M=0.660 M=0.783
Fig. 6 Pressure fluctuations distribution along the bump model
The peak pressure fluctuation increases with the separation, as found by Dolling and Or [29] in compression ramp flow and in convex-corner flow [30]. In parallel, it has been noted that the
non-dimensional pressure fluctuation Prms/Ps is
proportional to Ms
2
; Ms is the local peak Mach
number and Ps the local static pressure [31]. Chung
[30] successful correlated non-dimensional peak pressure fluctuations σ*p,max=(Prms/ (Ms
2
Ps)) with separation length in different free stream flow conditions (figure 7), demonstrating that large pressure fluctuation amplitude is a dominant feature of shock-induced separation.
From a spectral point of view, incoming boundary layer has a distinct footprint in the 3000-4000 Hz range (figure 8). Then, in the shock wave region, the central frequency is shifted to about 800 Hz, reducing to 350 Hz, at shock and separation time-averaged locations. In the shock induced separation region, high frequency fluctuations dominate (> 10 kHz) and a slightly lower central frequency, of 8 kHz, is found at the trailing edge of the separation bubble. 0 4 8 12 16 Separation length (L/) 0 2 4 6 * p,m a x
Dolling and Or (Ramp, M=3.00)
Dupont et al.(Incident-shock reflection, M=2.30)
Chung(Convex-corner, M=0.83)
Raghuanthan(bump, M=0.83)
Current data (Bump, M=0.78)
Fig.7 Dimensionless pressure fluctuation as a function of separation length
0 1000 2000 3000 4000 fE (f ) 0 400 800 1200 fE (f ) 0 400 800 1200 fE (f ) X*=0.66 X*=0.75 X*=0.91 X*=1.35 0 200 400 600 800 1000 fE (f ) X*=0.60 0 400 800 1200 fE (f ) 0 400 800 1200 1600 2000 fE (f ) X*=1.50 10 100 1000 10000 100000 Frequency (Hz) 0 400 800 1200 1600 fE (f ) X*=1.65 X*=0.81 0 2000 4000 6000 8000 fE (f ) X*=0.63 0 400 800 1200 1600 fE (f ) X*=1.20 10 100 1000 10000 100000 Frequency (Hz) 0 400 800 1200 1600 fE (f ) 0 40 80 120 160 fE (f ) X*=0.50
Fig. 8 Energetic spectrum at (a) X*=0.50 (b)
X*=0.60 (c) X*=0.63(d) X*=0.66 (e)X*=0.75
(f)X*=0.81 (g)X*=0.91 (h) X*=0.91 (i) X*=0.91 (j) X*=1.20 (k) X*=1.35 (l) X*=1.50 (m) X*=1.65
In the previous discussion, the optical
measurements suggested that upstream conditions is weakly unsteady and that shock wave excursions may result from downstream disturbances.
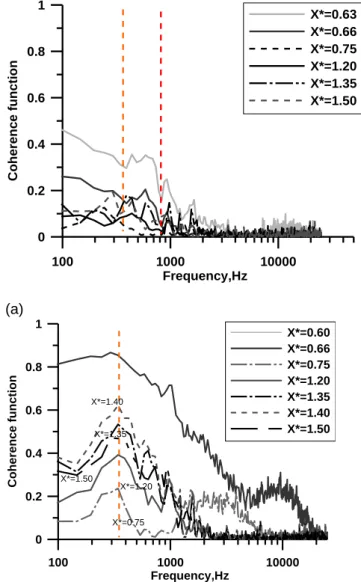
The coherence function can shed some light on this unsteady phenomenon. Figure 9a shows the coherence function between an upstream shock location (X*=0.60) and stations in the separation region; correlations are low at all frequencies. More convincingly, coherence analysis, using a reference point at the shock wave location (X*=0.63), reveals a common peak at 350 Hz in the separation region (figure 9b). This frequency corresponds to the shock wave unsteady motion, as observed from the high speed Schlieren images.
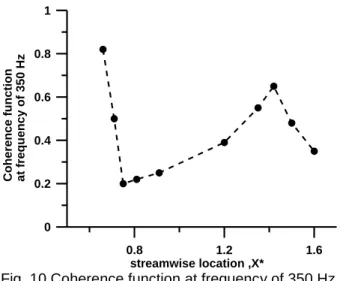
Figure 10 shows the magnitude of the coherence function in the separated region, at frequency of 350 Hz and still using a reference point at mean shock location (X*=0.63). The maximum correlation of 0.60 was found near the reattachment region at X*=1.40. This result strongly suggests that the whole phenomenon is driven by cycles of contraction and expansion of the separation bubble. It is also believed that the high unsteady nature of the flow at
the reattachment location may result in upstream-traveling waves, in an essentially subsonic zone. Those waves would terminate at shock wave and generates the shock wave unsteadiness. This hypothesis is in agreement with the approach of Ferrand et al. [32], who claimed that most of the amplification of the pressure waves is non-linear
and triggered by instantaneous shocklets,
downstream of the main shock. The interaction between shock wave unsteadiness and separation zone was also found in Chung’s experiments [30].
100 1000 10000 Frequency,Hz 0 0.2 0.4 0.6 0.8 1 C o h e re n c e f u n c ti o n X*=0.63 X*=0.66 X*=0.75 X*=1.20 X*=1.35 X*=1.50 (a) 100 1000 10000 Frequency,Hz 0 0.2 0.4 0.6 0.8 1 C o h e re n c e f u n c ti o n X*=0.60 X*=0.66 X*=0.75 X*=1.20 X*=1.35 X*=1.40 X*=1.50 X*=1.40 X*=1.35 X*=1.50 X*=1.20 X*=0.75 (b)
Fig. 9 Coherence functions (a) reference signal at 60% chord, (b) reference signal at 63% chord.
0.8 1.2 1.6 streamwise location ,X* 0 0.2 0.4 0.6 0.8 1 C o h e re n c e f u n c ti o n a t fr e q u e n c y o f 3 5 0 H z
Fig. 10 Coherence function at frequency of 350 Hz
4. Conceptual model
The shock boundary layer interaction can be roughly divided into 4 different zones, as shown in figure11.
Fig. 11 Conceptual model of shock wave turbulent boundary layer interaction.
1. At locations upstream of shock wave, the high pressure/ velocity intermittent nature results from shock excursions.
2. Near the shock location, there is a sharp increase of pressure fluctuations. This is likely to be due to shear layer fluctuations but it is also promoted by upstream-traveling pressure waves emanated at the reattachment point.
3. The separation zone I, just downstream of the shock wave, exhibits significant interaction between shock induced separation and trailing edge separation. Shock induced unsteadiness frequency, in the range of 1-2 kHz, is quite localized (figures 8e, 8f, 9), and superposed to a still strong 350 Hz fluctuations. High frequencies, over the order of 10 kHz, also become dominant, maybe because of smaller flow scales. In other words, flow is region I becomes more complex from a spectral point of view.
4. Beyond the trailing edge of the bump, separation zone II, the influence of the shock induced separation unsteadiness is fully dominated by higher frequency flow scales. However this region is
terminated by a regain of influence of the shock oscillation frequency. This is probably due to reattachment point fluctuations, triggered by strong shear layer dynamics. The pressure waves created in this region travel upstream and are likely to form a very efficient feedback loop on the shock oscillation system.
5. Conclusions
Unsteady features of a transonic shock wave turbulent boundary layer interaction over a wall-mounted bump were explored. A conceptual mechanism for self-sustained shock oscillations was proposed based on the evidence of the separation bubble dynamics. The main conclusions of the work are the following:
1. Wall pressure signals and Schlieren images showed the highly intermittent nature near the shock wave location; this is connected to the shock excursion phenomena.
2. The shock oscillation frequency of 325 Hz was measured at the shock wave foot, and this was also found from analysis of wall pressure signals. The shock unsteadiness, in this particular case, shows a relatively high frequency and low amplitudes of shock wave motion.
3. The reattachment region is highly unsteady, and is correlated to shock oscillations, from a spectral point of view. It is hypothesized
that unsteady pressure waves are
generated at the reattachment location and travel upstream to cause shock wave unsteadiness.
4. The proposed conceptual model might suggest that flow control strategies could be directed on the reattachment region and on the upstream traveling pressure waves.
Acknowledgments
The work presented in this paper was carried out within the framework of the EU-FP6 “UFAST” Research Programme and was financially supported by EC (EC FP6 AST-CT-2005-012226 UFAST). The authors would also like to thank Prof. P. Doerffer for his constant technical support and advice.
References
1. Fage A., Sargent R.F. (1947). Shock wave and boundary layer phenomena near a flat surface. Proc. Roy. Soc., A, 190, No 1020, 1-20.
2. Ackeret J, Feldmann F., Root N. (1947). Investigation of compression shocks and
-0.5 0 0.5 1 1.5 2 2.5
Intermittent region Shock wave region
Separation region II Separation region I
boundary layers in gases moving at high speed. NACA TN 1113 (translation of 1943 note) 3. Green J.E. (1970). Interaction between shock
waves and boundary layers. Progress in Aerospace Sciences, 11, 235-340.
4. Delery J.M. (1985). Shock wave/turbulent boundary layer interaction and control. Prog. Aerospace Sci., 22, 209-280.
5. Dolling D.S. (2001). Fifty years of shock-wave/boundary layer interaction research: what next? AIAA J., 39(6), 1517-1531.
6. Lee B.H.K. (2001). Self-sustained shock oscillations on airfoils at transonic speeds. Progress in Aerospace Sciences, 37(2), 147-196.
7. Smits A.J., Dussauge J.P. (2005) Turbulent
shear layers in supersonic flow. 2nd Edition.
8. Andreopoulos Y. Agui JH, Briassulis G (2000). Shock Waves-Turbulence Interactions. Annual Review of Fluid Mechanics, 32, 309-345. 9. Andreopoulos J., Much K.C. (1987). Some new
aspects of the shock-wave boundary layer interaction in compression ramp corner. J. Fluid Mech., 180, 405-428.
10. Smits A.J. and Muck K.C. (1987). Experimental study of three shock wave /boundary layer interactions. J. Fluid Mech., 182, 291-314. 11. Ünalmis OH, Dolling DS (1998). Experimental
study of causes of unsteadiness of shock induced turbulent separation. AIAA J., 36, 371-378.
12. Ganapathisubramani B., Clemens N.T., Dolling D.S. (2006). Large scale motions in a supersonic turbulent boundary layer. J. Fluid Mech., 556, 271-282.
13. Ganapathisubramani B., Clemens N.T., Dolling D.S. (2007). Effects of upstream boundary layer
on the unsteadiness of shock-induced
separation. J. Fluid Mech., 585, 369-394. 14. Erengil M.E., Dolling DS (1991a). Unsteady
wave structure near separation in a Mach 5 compression ramp interaction. AIAA J., 29(5), 728-735.
15. Dussauge J.P., Dupont P., Debieve, J.F. (2006). Unsteadiness in shock wave boundary layer interactions with separation. Aerospace Science and Technology, 10, 85-91.
16. Touber E., Sandham N. (2009). Large-eddy simulation of low-frequency unsteadiness in a turbulent shock-induced separation bubble. Theoretical and Computational Fluid Dynamics,
23(2), 79-107.
17. Piponniau, S., Dussauge, J.P., Debieve, J.F. and Dupont, P. (2009). A simple model for
low-frequency unsteadiness in shock-induced
separation. J. Fluid Mech., 629, 87-108.
18. Wu M, Martin M.P. (2008). Analysis of shock motion in shock wave turbulent boundary layer using direct numerical simulation data. J. Fluid Mech., 594, 71-83.
19. Pearcey H.H., Osborne J., Haines A.B. (1968). The interaction between local effects at the
shock and rear separation — a source of
significant scale effects in wind-tunnel tests on aerofoils and wings. AGARD CP-35, Transonic aerodynamics, Paris, France: 11.1–23.
20. Delery J.M. (1983). Experimental investigation of turbulence properties in transonic shock/ boundary-layer interactions. AIAA J., 21(2), 180-185.
21. Coe C.F. (1961). Steady and fluctuating pressures at transonic speeds on two space-vehicle payload shapes. NASA TM-X503. 22. Bogar T.J., Sajben M., Kroutil J.C. (1983).
Characteristic frequencies of transonic diffuser flow oscillations. AIAA J., 21(9), 1232-1240. 23. Bron O. (2003). Numerical and experimental
study of the shock-boundary layer interaction in transonic unsteady flow. PhD. thesis, Royal Institute of Technology, Sweden.
24. Raghunathan S., McAdam R.J.W. (1983). Free stream turbulence and transonic flow over a
bump model. AIAA J., 21(3), 467-469.
25. Barakos G., Huang J.C., Benard E.,
Raghunathan S., Yapalparvi R. (2008).
Investigation of transonic flow over a bump: base flow and control. AIAA paper 2008-357. 26. Delery J.M., Marvin J.G. (1986). Shock-Wave
Boundary Layer Interactions. North Atlantic
Treaty Organization: Advisory Group for
Aerospace Research and Development,
AGARDograph, No. 280.
27. Liu X., Squire L.C. (1987). An investigation of shock/boundary layer interactions on curved surfaces at transonic speeds. J. Fluid Mech.,
187, 467–486.
28. Huang J.C., Gault R.I., Benard E., Raghunathan S. (2008). Effect of humidity on transonic flow. J. Aircraft, 45(6), 2092-2099.
29. Dolling D.S., Or C.T. (1985). Unsteadiness of the shock wave structure in attached and separated compression ramp flows. Exp Fluids,
3(1), 24-32.
30. Chung K.M. (2004). Unsteadiness of transonic convex flows. Exp. Fluids, 37, 917-922.
31. Lagaqnelli A.L., Martellucci A., Shaw L.L. (1983). Wall pressure fluctuations in attached
boundary-layer flow. AIAA J., 21(4), 495-502.
32. Ferrand P., Atassi H.M., Aubert S. (1996). Amplification des instationnarites generees par des perturbations amont ou aval. AGARD CP