HAL Id: hal-00330348
https://hal.archives-ouvertes.fr/hal-00330348
Submitted on 14 Oct 2008
HAL is a multi-disciplinary open access
archive for the deposit and dissemination of
sci-entific research documents, whether they are
pub-lished or not. The documents may come from
teaching and research institutions in France or
abroad, or from public or private research centers.
L’archive ouverte pluridisciplinaire HAL, est
destinée au dépôt et à la diffusion de documents
scientifiques de niveau recherche, publiés ou non,
émanant des établissements d’enseignement et de
recherche français ou étrangers, des laboratoires
publics ou privés.
South Pacific Ocean - evidence for long-term
accumulation of organic matter in nitrogen-depleted
waters
Patrick Raimbault, N. Garcia, F. Cerutti
To cite this version:
Patrick Raimbault, N. Garcia, F. Cerutti. Distribution of inorganic and organic nutrients in the South
Pacific Ocean - evidence for long-term accumulation of organic matter in nitrogen-depleted waters.
Biogeosciences, European Geosciences Union, 2008, 5 (2), pp.281-298. �hal-00330348�
Distribution of inorganic and organic nutrients in the South Pacific
Ocean – evidence for long-term accumulation of organic matter in
nitrogen-depleted waters
P. Raimbault, N. Garcia, and F. Cerutti
Laboratoire de Microbiologie, G´eochimie et Ecologie Marine (UMR 6117 CNRS), Centre d’Oc´eanologie de Marseille, Universit´e de la M´editerran´ee, Campus de Luminy, 13288 Marseille, France
Received: 23 July 2007 – Published in Biogeosciences Discuss.: 30 August 2007 Revised: 6 December 2007 – Accepted: 25 January 2008 – Published: 3 March 2008
Abstract. During the BIOSOPE cruise the RV Atalante was dedicated to study the biogeochemical properties in the South Pacific between the Marquesas Islands (141◦W–8◦S) and the Chilean upwelling (73◦W–34◦S). Over the 8000 km covered by the cruise, several different trophic situations were encountered, in particular strong oligotrophic condi-tions in the South Pacific Gyre (SPG, between 123◦W and
101◦W). In this isolated region, nitrate was undetectable
between the surface and 160–180 m and only trace quan-tities (<20 nmoles l−1) of regenerated nitrogen (nitrite and ammonium) were detected, even in the subsurface maxi-mum. Integrated nitrate over the photic layer, which reached 165 m, was close to zero. Despite this severe nitrogen-depletion, phosphate was always present in significant con-centrations (≈0.1 µmoles l−1), while silicic acid was main-tained at low but classical oceanic levels (≈1 µmoles l−1). In contrast, the Marquesas region (MAR) to the west and Chilean upwelling (UPW) to the east were characterized by high nutrient concentrations, one hundred to one thou-sand fold higher than in the SPG. The distribution of surface chlorophyll reflected the nitrate gradient, the lowest concen-trations (0.023 nmoles l−1) being measured at the centre of
the SPG, where integrated value throughout the photic layer was very low (≈ 10 mg m−2). However, due to the relatively
high concentrations of chlorophyll-a encountered in the DCM (0.2 µg l−1), chlorophyll-a concentrations throughout the photic layer were less variable than nitrate concentrations (by a factor 2 to 5). In contrast to chlorophyll-a, integrated particulate organic matter (POM) remained more or less con-stant along the study area (500 mmoles m−2, 60 mmoles m−2 and 3.5 mmoles m−2 for particulate organic carbon, partic-ulate organic nitrogen and particpartic-ulate organic phosphorus, Correspondence to: P. Raimbault
respectively), with the exception of the upwelling, where values were two fold higher. The residence time of partic-ulate carbon in the surface water was only 4–5 days in the upwelling, but up to 30 days in the SPG, where light iso-topic δ15N signal noted in the suspended POM suggests that N2-fixation provides a dominant supply of nitrogen to
phyto-plankton. The most striking feature was the large accumula-tion of dissolved organic matter (DOM) in the SPG compared to the surrounding waters, in particular dissolved organic car-bon (DOC) where concentrations were at levels rarely mea-sured in oceanic waters (>100 µmoles l−1). Due to this large pool of DOM in the SPG photic layer, integrated values fol-lowed a converse geographical pattern to that of inorganic nutrients with a large accumulation in the centre of the SPG. Whereas suspended particulate matter in the mixed layer had a C/N ratio largely conforming to the Redfield stochiometry (C/N≈6.6), marked deviations were observed in this excess DOM (C/N≈16 to 23). The marked geographical trend sug-gests that a net in situ source exists, mainly due to biologi-cal processes. Thus, in spite of strong nitrate-depletion lead-ing to low chlorophyll biomass, the closed ecosystem of the SPG can accumulate large amounts of C-rich dissolved or-ganic matter. The implications of this finding are examined, the conclusion being that, due to weak lateral advection, the biologically produced dissolved organic carbon can be accu-mulated and stored in the photic layer for very long periods. In spite of the lack of seasonal vertical mixing, a significant part of new production (up to 34%), which was mainly sup-ported by dinitrogen fixation, can be exsup-ported to deep wa-ters by turbulent diffusion in terms of DOC. The diffusive rate estimated in the SPG (134 µmolesC m−2d−1), was quite equivalent to the particles flux measured by sediments traps.
1 Introduction
The warm oligotrophic regions of the open ocean are sub-ject to smaller seasonal temperature variations than temper-ate wtemper-aters, and are permanently underlain by a strong ther-mocline. Therefore they are regarded as the least variable and the least productive surface waters of the sea. However, as they represent 60% of the global oceanic area, the subtrop-ical open-ocean ecosystems are the largest coherent biomes of our planet and the biogeochemical processes they sup-port have global consequences (Karl, 2002). A comprehen-sive evaluation of both inorganic and organic nutrient pools is important in order to understand the production and fate of organic matter in these large oceanic areas. Rates of in-organic nutrient assimilation reported for oligotrophic wa-ters are subject to large errors (McCarthy, 1980) as conven-tional nutrient analysis are unable to measure the extremely low concentrations that exist over the vast areas of the open ocean. Over the last 15 years, international programs have advanced our understanding of these vast marine ecosystems; however the South Pacific remains one of the least studied areas of the Ocean (Daneri and Quinones, 2001). This re-gion has been described as the most oligotrophic zone in the world’s oceans (Dandonneau et al., 2006) having the lowest surface chlorophyll concentrations, observed using satellite imagery (Claustre and Maritorena, 2003) and confirmed by exhibiting the clearest oceanic waters of the world (Morel et al., 2007).
The BIOSOPE (BIOgeochemistry and Optics South Pa-cific Experiment) cruise provided the first spatially extensive experiment in the South East Pacific. The 8000 km tran-sect, stretching from the Marquesas Islands to the Chilean coast and crossing the centre of the SPG, is an ideal area for studying organic and inorganic nutrients along an extreme trophic gradient. The main objective of this work is to de-scribe inorganic and organic distributions by comparing the different environmental conditions covered by the BIOSOPE cruise. Since ambient concentrations are often below the de-tection limit of conventional analytical procedures (Brzezin-ski, 1985; Garside 1985; Sahlsten, 1987; Raimbault et al., 1999) the more sensitive methods of Garside (1982), Raim-bault et al. (1990) and Holmes et al. (1999) have to be em-ployed in order to detect the trace nutrients. In this paper we describe spatial and vertical distributions of inorganic and or-ganic nutrients in the South Pacific in particular in the olig-otrophic SPG. Pools of carbon, nitrogen and phosphorus es-sential for production in the upper layer are analyzed pro-ducing the first broad data base for this unexplored oceanic region.
2 Materials and methods
Data was collected during the BIOSOPE cruise carried out on board the R/V Atalante between October-November
2004 in the southeast Pacific Ocean along a transect be-tween the Marquesas archipelago and the Chilean coasts (from 146.36◦W–15.24◦S to and 72.49◦W–34.7◦S, Fig. 1).
Twenty four short-term (8 h) stations were studied during transit. In addition, six experimental sites were specifically investigated with long fixed stations (over 2–5 days), rep-resenting sites of different trophic regimes: MAR = Mar-quesas archipelago (141.3◦W; 8.4◦S); HLNC=High Nutri-ent Low Chlorophyll area east of the Marquesas islands (136.8◦W; 9◦S); GYR = centre of the South Pacific gyre 114◦W, 26◦S); EGY=eastern border of the gyre (91.4◦W, 31.8◦S), UPW and UPX situated in the area of Chilean up-welling (73◦W–34◦S and 72.4◦W–34.5◦S). Sampling sites in the gyre were selected using ocean colour images, and ex-hibited the lowest surface chlorophyll concentrations found in the world’s oceans. High vertical resolution environmental data were collected between 0 and 500 m using a conductiv-ity temperature-depth-oxygen profiler (CTDO, Seabird 911 plus) with a rosette supporting 12-l Niskin bottles equipped with silicon rubber closures.
2.1 Inorganic nutrients
Nutrient samples for nitrate, nitrite, phosphate and silicic acid determination, were collected into 20 ml polyethylene flasks and 250 ml polycarbonate bottles at each station. Sam-ples in the 20 ml polyethylene flasks were immediately poi-soned with mercuric chloride (10 µg ml−1), according to Kirkwood (1992), and stored for subsequent laboratory anal-ysis. Ambient nitrate, nitrite and phosphate concentrations were measured immediately by pumping the 250 ml sam-ple through a Technicon AutoAnalyzer®. Nitrate and ni-trite concentrations in the nanomolar range (lower detec-tion limit=3 nmoles l−1) were obtained using the sensitive method of Raimbault et al. (1990). Nitrate at submicromolar levels (detection limit 0.05 µmoles l−1) and phosphate
(de-tection limit 0.02 µmoles l−1) were measured according to
the method of Armstrong et al. (1967). Ammonium concen-trations (40 ml collected into 50 ml Schott glass flasks) were measured using the sensitive method of Holmes et al. (1999) having a detection limit of 5 nmoles l−1.
Silicic acid concentrations as well as duplicate nitrate and phosphate concentrations were determined in the laboratory (Tr´eguer and LeCorre, 1975) on the poisoned samples four months after sampling. To ensure the reproducibility of nu-trient measurements between analyses, in-house standards were used, which were regularly compared to the commer-cially available products (OSIL). Precision was also tested, through participation in the European inter-calibration exer-cise QUASIMEME (http://www.quasimeme.org).
2.2 Phytoplanktonic biomass
250 ml of seawater was filtered through 25 mm Whatmann GF/F filters (nominal pore size around 0.7 µm) immediately
Fig. 1. Map showing the location of the BIOSOPE cruise from Marquises Island to Chile superimposed on a SeaWiFS surface Chl-a
composite. Locations of CTD casts are indicated by dark spots and long time experimental stations by large circles. (MAR=141.3◦W; 8.4◦S; HLN=136.8◦W; 9◦S; GYR = 114◦W, 26◦S); EGYR=eastern border of the gyre (91.4◦W, 31.8◦S; UPW=73◦W–34◦S and UPX=72.4◦W– 34.5◦S).
Table 1. Values for reagent blanks and blank filters (not including reagent blank) obtained during the analysis of dissolved and particulate
organic matter using wet oxidation or high temperature combustion.
Wet oxidation High temperaturecombustion
C N P C N
µmoles.l−1 µmoles
Reagent blank 5.9±0.3 0.2±0.08 0.03±0.01
DIW 4.2±0.6 <D.L. <D.L.
µmoles/filter µmoles/filter
Blank filter Teflon (47 mm) 2.2±0.85 0.05±0.07 0.008±0.005
Blank filter GF/F (25 mm) 0.63±0.18 0.03±0.02 0.003±0.003 0.9±0.3 0.13±0.05
after sampling, and placed in glass tubes containing 5 ml of pure methanol as described by Raimbault et al. (2004). Following 20–30 min of extraction, fluorescence of the ex-tract was determined on a Turner Fluorometer 110 equipped with the Welschmeyer kit to avoid chlorophyll-b interfer-ence (Welschmeyer, 1994). As the monochromatic fluo-rescence method cannot separate divinyl chlorophyll from a, results are given in terms of total
chlorophyll-a concentrchlorophyll-ation (Tchl-chlorophyll-a), i.e. the sum of chlorophyll-chlorophyll-a chlorophyll-and
divinyl chlorophyll-a. The blank “methanol + filter” was close to zero giving a very low detection limit of around 0.01 µg l−1. Calibrations were made using a pure Sigma chlorophyll-a standard.
2.3 Organic nutrients
Samples for particulate organic carbon (POC), particulate organic nitrogen (PON) and particulate organic
phospho-rus (POP) were filtered onto a 0.2 µm Teflon membrane. The hydrophobic Teflon membranes were washed with 1ml ethanol just before filtration and then rinsed with milliQ wa-ter. Between 580 to 1200 ml of sample was filtered, de-pendant on the quantity of particulate matter in the sam-ple. Following filtration, filters were washed with 100 µl of H2SO4 (0.5 N) to remove any inorganic carbon. The
fil-ters were then stored in 25 ml Schott glass bottles for sub-sequent laboratory analysis. Blank filters were prepared for each set of samples by washing the filter with 1 ml ethanol and rinsing with 600 ml of <0.2 µm seawater. Determina-tion of POC, PON and POP was carried out simultaneously on the same sample using the wet-oxidation procedure ac-cording to Raimbault et al. (1999a). Filter blanks are given in Table 1. Values were slightly higher than those pub-lished by Raimbault et al. (1999a) but remain three to ten fold lower than the samples. Samples for particulate car-bon (PC) and particulate nitrogen (PN) were filtered onto
Whatman GF/F filters and values were obtained using dual isotopic 13C/15N experiments (see Raimbault and Garcia, 2007). The filters were not acidified and PC and PN mea-surements were obtained using high combustion (900◦C) on a CN Integra mass spectrometer. Samples for total organic matter determination were collected directly from the Niskin bottles into 50 ml Glass Schott bottles. Samples were im-mediately acidified with 100 µl H2SO40.5 N and stored for
analytical determination in the laboratory. Prior to oxidation, samples were bubbled with a high purity oxygen/nitrogen gas stream for 15 min. Persulfate wet-oxidation was used to di-gest the organic matter in these unfiltered samples, accord-ing to Raimbault et al. (1999b). The calibration was made according to the range of the marine content observed. To-tal organic nitrogen and toTo-tal organic phosphorus was calcu-lated as total nitrogen and phosphorus minus dissolved in-organic nitrogen (nitrate+nitrite+ammonium) or phosphate measured in the same samples. Dissolved organic carbon (DOC), dissolved organic nitrogen (DON) and dissolved or-ganic phosphorus (DOP) were calculated from these total organic fractions by subtracting values of POC, PON and POP obtained from the >0.2 µm fractions (see above). The analytical accuracy was close to 5, 0.5 and 0.05 µmole l−1 for DOC, DON and DOP, respectively. Deep Sargasso Sea reference water was used to verify the analytical calibra-tion (45 µmolesC l−1±0.5 SE, Hansell Laboratory, Bermuda
Biological Station for Research). All reagents and sample blanks were prepared using fresh Millipore Milli-Q plus® water. Mean blank values are presented in Table 1.
2.4 Natural abundance of particulate 15N measurements (δ15N)
Water samples were drawn into 10 l polyethylene bottles and the contents filtered immediately online, onto pre-combusted Whatman, GF/F filters which were placed into glass tubes and dried at 60◦C. Some large samples (1000–1500 l) were also collected using an in situ pump and a fraction of the glass fiber filter, corresponding to 10–15 l of seawater, was treated as above. In the laboratory, each filter was rolled into a pellet and fed into a mass-spectrometer (CN-Integra tracer-mass) to analyse the stable isotopic composition of the particulates (δ15N). An organic standard (glycine) was used to calibrate the PN measurements and to track the consistency of the Du-mas combustion. The δ15N of this standard was 4.88±0.39‰ (n=24) for nitrogen levels ranging from 20 to 140 µg. In addition, two NIST-certified organic15N reference materi-als (IAEA 310 A δ15N=47‰; IAEA 310 B, δ15N=245‰) were used to insure the accuracy of the isotopic measure-ments. The values for these analysis were 47.3±0.27‰ and 243±0.46‰ for AIEA310 an AIEA 310b, respectively. An-alytical precision determined with these reference materials was 0.03‰. The standard reference was atmospheric N2gas
(15N/14N=0.003663: δ15N=0‰).
Surface light levels and the thickness of the euphotic layer were measured around local noon using a spectroradiometer (LI.1800U.W, LI-COR instrument; Morel et al., 2007). The depth of the euphotic zone (Ze) is defined as the depth where the downward photosynthetical available radiation (PAR) ir-radiance is reduced to 1% of its surface value. For CTD casts performed early in the morning, Ze was computed using in situ TChl-a concentration profiles (see Ras et al., 2007) according to the model developed by Morel and Mari-torena (2001).
Data shown throughout this paper are limited to the 0– 300 m water column.
3 Results
3.1 Hydrological background
The general distribution of temperature and salinity are pre-sented and described in Claustre et al. (2008) and Ras et al. (2007). Briefly, surface temperature generally de-creased from the Marquesas site (27.8◦C) to the Chilean coast (18◦C). Surface temperatures were greater than 25◦C up to 125◦W and greater than 20◦C up to 100◦W. The 15◦C isotherm remained below 250 m until 100◦W rapidly becom-ing shallower thereafter and reachbecom-ing the surface along the Chilean coast. Salinity patterns (Fig. 2) generally followed those of temperature, decreasing from west (37.75) to east (34.5); but a maximum (>36.5) and minimum (<34.25) were noted around 130◦W and 90◦W, respectively. These specific
water masses are referred to as the South Pacific Tropical Waters (SPTW) and Eastern South Pacific Intermediate Wa-ters (ESPIW). The waWa-ters surrounding the Marquesas Islands (8◦–141◦W) were influenced by the South Equatorial current and constituted the southern boundary of High Nutrient Low Chlorophyll (HNLC) waters of the equatorial upwelling re-gion (Andri´e et al., 1993). Salinity ranged from 35.5–35.7 and surface temperatures reached 27.9◦C. The Peru-Chile current, delimited by an isohaline of 34.3 was associated with fresher waters, especially between 78◦W and 75◦W (salinity around 34.1).
3.2 Inorganic nutrient distribution
The distribution of major inorganic nutrients (nitrate, phos-phate and silicate) is shown in Fig. 2. In contrast to temper-ature, the nutrient isolines sunk deeper from west to east up until 110◦W. Thus, the concentrations of deep and surface
nutrients tended to be symmetrically distributed around the center of the investigated area, with lowest concentrations found in the central region (110◦W). The Marquesas region (moving westward to 135◦W), located at the southern limit of the equatorial pacific, was characterized by rich superficial waters with nitrate concentrations greater than 1 µmoles l−1. The 2 µmoles l−1isoline, indicated the start of the nitracline
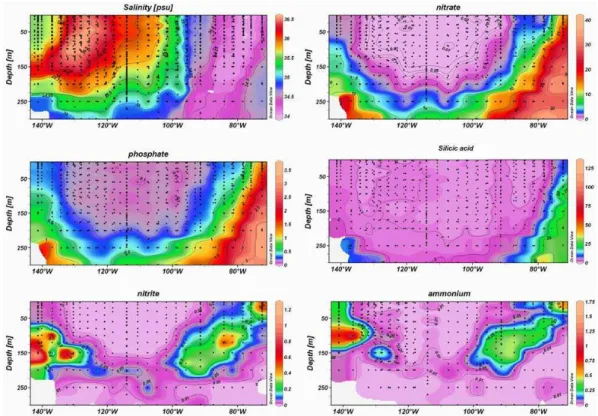
Fig. 2. Longitudinal section of salinity, nitrate, phosphate, silicic acid, nitrite and ammonium along the BIOSOPE Transect. Units for
nutrients are µmoles l−1. (Ocean Data View software (ODV), version 3.1, Reiner Schlitzer, http://odv.awi.de).
at 55 m. Phosphate was also present in significant concen-trations ranging between 0.3 and 0.5 µmoles l−1. To the east of the Marquesas island (135◦W to 130◦W), nitrate was still detectable in the surface but there was a significant varia-tion in the nitrate level with depth, with concentravaria-tions de-creasing from 1 to 0.05 µmoles l−1between the surface and
100 m. Phosphate concentrations in the surface were close to 0.2 µmoles l−1. Here, the nitracline was deeper, reach-ing 60–70 m. The centre of investigated area (South Pacific Gyre=SPG; 125◦W to 100◦W) was characterized by very nutrient-depleted water. Surface nitrate concentrations were always lower than 0.010 µmoles l−1and often undetectable (<0.003 µmoles l−1) in the upper 100 m layer, or the up-per 160 m layer between 120◦W and 110◦W. Moving east-ward from 108◦W, the depth at which nitrate concentrations reached 0.01 µmoles l−1reduced, getting close to the surface at 96◦W. This defines the eastern limit of the SPG. As in the case of nitrate, surface concentrations of phosphate were minimal in the SPG (≈0.1µmoles l−1). However, despite complete nitrate-depletion, surface waters were phosphate-replete over the whole transect. Further west, surface nutri-ent concnutri-entrations increased rapidly reaching maximum val-ues in the Chilean upwelling region. The 5 µmoles l−1 ni-trate isoline outcropped at the surface at 76◦W. This defines the western limit of the upwelling. Silicic acid distribution showed the same general pattern as that of nitrate, although
surface concentrations along the transect were less variable, ranging from 1 to 2 µmoles l−1, and up to 10 µmoles l−1in the upwelling. Concentrations were lowest in the SPG, but always close to 1 µmoles l−1. Thus, like phosphate, com-plete silicic acid-depletion was never observed.
Regenerated forms of nitrogen, such as nitrite and ammo-nium (Fig. 2), showed particular distribution patterns char-acterized by the presence of subsurface maxima located at each extremity of the transect. Nitrite was generally un-detectable or present in very low concentrations at the sur-face (<0.05 µmoles l−1), except in the upwelling region where superficial concentrations reached 0.1 µmoles l−1(up to 0.5 µmoles l−1). A well-marked maximum was lo-cated at 120 m in the western area, with concentrations reaching 0.5 µmoles l−1. This subsurface maximum dis-appeared in the SPG (between 120◦W and 105◦W) and only some traces of nitrite (<0.05 µmoles l−1) were
de-tected below the euphotic zone (200 m), associated with the 0.5 µmoles l−1nitrate isoline. A second maximum was
ob-served around 150 m, from 100◦W. However, in contrast to the western maximum, nitrite concentrations rarely reached 0.5 µmoles l−1 and remained close to 0.25 µmoles l−1, ex-cept in surface upwelling waters. Whatever the depth of the nitracline (depth where nitrate ranged between 0.01 and 0.05 µmole l−1), the primary nitrite maximum was about 10 to 20 m deeper than the top of the nitracline.
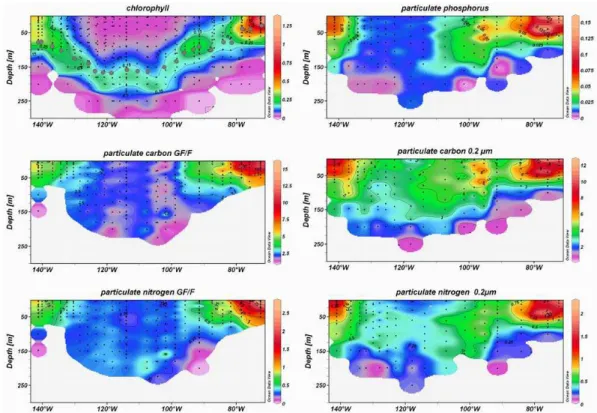
Fig. 3. Vertical sections of total chlorophyll-a (Chlorophyll in µg l−1), particulate phosphorus, >0.2 µm particulate organic carbon and particulate nitrogen and >GF/F particulate carbon and particulate nigrogen (units are in µmoles l−1). Dark spots on chlorophyll section indicate the 1% light penetration depth. (Ocean Data View software (ODV), version 3.1, Reiner Schlitzer, http://odv.awi.de).
Ammonium concentrations followed the same general trend. Highest concentrations (up to 0.5 µmoles l−1) being
located in the subsurface in the Marquesas zone, although the maximum concentration was shallower than the nitrite maxi-mum (100 m instead of 150 m). High surface concentrations (>0.3 µmoles l−1) were also measured in this region. The SPG was characterized by undetectable ammonium concen-trations through most of the superficial layer. A very weak and narrow maximum, with trace concentrations of ammo-nium (0.010 µmoles l−1), was detected around 180 m, more or less associated with the narrow nitrite maximum. The western ammonium maximum was also located just above the nitrite maximum. Concentrations ranged from 0.25 to 0.3 µmoles l−1. The eastern boundary of the SPG was also
characterized by a deep ammonium maximum (80–100 m), with lower concentrations than those observed in the western region (<0.25 µmoles l−1). The upwelling area was defined by surface concentrations >0.25 µmoles l−1. Concentrations of both regenerated nitrogen forms followed similar trends to those of the macronutrients, with “hot spots” to the west and east of the investigated transect. The SPG was entirely N-depleted, indicating low nitrogen regeneration activity or a tight coupling between regeneration and phytoplankton and bacteria uptake.
3.3 Biomass distribution
Vertical distributions of biomass are shown in Fig. 3 as total chlorophyll-a (TChl-a), particulate organic carbon (POC), particulate organic nitrogen (PON) and particulate organic phosphorus (POP). In situ chlorophyll-a, in accordance with ocean colour imagery, showed considerable variations across the South Pacific. TChl-a distribution and concentration are roughly equivalent to those found by Ras et al. (2007) who used the HPLC procedure. The extremities of the transect ex-hibited the highest biomass, located in the surface, while very low chlorophyll concentrations were measured at the cen-ter of the SPG. The lowest concentration (0.023µg l−1) was found in the surface at 114◦W. This value is close to the low-est measured at this site (0.017 µg l−1) by Ras et al. (2007). In contrast, in the waters off the Marquesas Islands, surface Tchl-a were ten folds higher (0.3 µg l−1) and higher than
values previously observed in the subequatorial area at other times of the year (Signorini at al., 1999). In the Chilean up-welling, surface Tchl-a was much higher (up to 3 µg l−1). The SPG was also characterized by a deep chlorophyll maxi-mum (DCM) at 160 and 180 m between 120◦W and 100◦W. The depth of the DCM decreased progressively eastward and westward, reaching the surface at the Chilean upwelling, but restricted to 50 m in the Marquesas area. While the DCM was generally found just above the 1% light penetration depth in
CTD 88 114°W - 26°S 0 50 100 150 200 250 300 D e p th ( m ) 0.2 µm GF/F CTD 102 114°W - 26°S 0 50 100 150 200 250 300 D e p th ( m ) 0.2 µm GF/F
Fig. 4. Vertical profiles of chlorophyll-a (Tchl-a) made with GF/F
filters and 0.2 µm Teflon membranes.
the Marquesas area and east of 110◦W, the entire DCM was
well below the limit of the photic zone in the SPG. Within this DCM, chlorophyll concentrations were confined to a nar-row range (0.15 to 0.20 µg l−1) whatever the depth; and no significant relationship was found between the depth of the DMC and chlorophyll concentration.
Previous work has indicated that GF/F filters are not ef-ficient in collecting all the chlorophyll particles, especially in very oligotrophic waters (Dickson and Wheeler, 1993). This investigation, carried out in one of the most oligotrophic areas of the world, enabled us to test the efficiency of the GF/F filters. Two comparison profiles carried out at the most oligotrophic site (114◦W and 26◦S) clearly demon-strated that pre-combusted GF/F filters were as efficient as the 0.2 µm Teflon membranes (Fig. 4) in determining chloro-phyll concentrations, even in these very poor oceanic waters dominated by small picophytoplankton (Grob et al., 2007). This observation contradicts Dickson and Wheeler’s results and confirms those of Chavez et al. (1995) that GF/F filters are adequate for collecting TChl-a in the open oligotrophic ocean.
Biomass in terms of particulate organic carbon, particu-late nitrogen and particuparticu-late phosphorus collected on 0.2 µm Teflon membranes (Fig. 3) showed very different patterns to those of chlorophyll. The Marquesas waters and upwelling areas were again the richest regions with superficial con-centrations of POC, PON and POP higher than 6, 1 and 0.05 µmoles l−1, respectively. The SPG revealed very low values throughout the water column (POC <4 µmoles l−1,
PON <0.5 µmoles l−1, POP <0.02 µmoles l−1) with no
pro-nounced subsurface maximum as observed for chlorophyll. The eastern area of the SPG (between 110◦W and 90◦W) was richer than the western area, with POC, PON and POP higher than 5, 0.5 and 0.025 µmoles l−1, respectively. Al-though surface concentrations were higher near the Marque-sas Islands and in the upwelling region than in the SPG, the differences were less than twofold, compared with the ten and thousand fold differences found in surface TChl-a
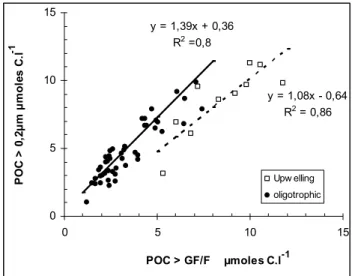
R2 =0,8 y = 1,08x - 0,64 R2 = 0,86 0 5 10 0 5 10 15 POC > GF/F µmoles C.l-1 P O C > 0 ,2 µ m µ m o le s C .l -1 Upw elling oligotrophic
Fig. 5. Comparison between particulate organic carbon measured
on 0.2 µm Teflon membranes by a wet-oxidation method (POC in
µmoles l−1) and particulate carbon on GF/F filters measured using
High temperature combustion (PC in µmoles l−1). Linear relation-ships are obtained using model II regression.
and nitrate concentrations, respectively. Depth distributions of POC, PON and POP were uniform over the photic zone, lacked pronounced subsurface maxima, but showed a charac-teristic decrease to the bottom of the euphotic zone. Particu-late carbon and particuParticu-late nitrogen collected on GF/F filters described the same geographical pattern (Fig. 3). Maximum biomass was found in surface upwelling waters and in the Marquesas vicinity while a homogeneous vertical distribu-tion was observed in the SPG.
The estimates of POM in the >0.2 µm size fraction (col-lected on Teflon filters) and in the >0.7 µm size fraction (ap-proximate GF/F filter pore size) were compared by calculat-ing the geometric mean model II regression, which take into account the measurement errors in both variables. Results obtained from upwelling waters appeared significantly dif-ferent from other waters (Fig. 5) and were treated separately. On average, >0.2 µm POC and PON were 1.38, 1.24 times higher than the corresponding 0.7 µm estimates (Table 2), in-dicating that a large proportion of POC/PON particles were
<0.7 µm and therefore the GF/F filters were shown to be
un-derestimating the values. In some cases, this underestima-tion reached 50%, i.e. in the SPG. In the case of N-replete water from the upwelling, the linear regression slope was not significantly different from 1, indicating that there was no significant biomass lower than 0.7 µm.
When all the data were pooled the relationship between POC versus PON and POC versus POP were close to the Redfield ratio for the >0.2 µm fraction and for the >0.7 µm GF/F filter fraction (Table 2). However, intercepts of the regression equations for the 0.2 µm teflon and GF/F filter comparisons showed that particles in the <0.7 µm filtrate
Table 2. Comparative study of retention efficiency of 0.2 µm Teflon membrane and GF/F Whatman ® filters (approximate 0.7 µm pore
size) for collection of particulate carbon (POC and PC), particulate nitrogen (PON), particulate phosphorus (POP) and chlorophyll (Tchl-a). Coefficient regression and coefficient correlation are obtained from model II regression.
All BIOSOPE data, except upwelling (141◦–82◦W) upwelling (81◦W–74◦W)
r2 n r2 n
POC0.2 µm=1.38 PC0.7 µm+0.36 0.80 52 POC0.2 µm=1.08 PC0.7 µm−0.6 0.85 10
PON0.2 µm=1.24 PON0.7 µm+0.04 0.75 52 PON0.2 µm=1.08 PON0.7 µm−0.36 0.98 10
POC0.2 µm=6.19 PON0.2 µm+0.94 0.66 133 POC0.2 µm=5.9 PON0.2µm+0.10 0.90 27
POC0.2 µm=103 POP0.2 µm+1.5 0.629 133 POC0.2 µm=74 POP0.2µm+0.66 0.85 27
POC0.2 µm=15.3 Tchl-a+1.6 0.40 93 POC0.2 µm=4.9 Tchl-a+3.8 0.39 18
PON0.2 µm=2.6 Tchl-a+0.1 0.60 92 PON0.2 µm=0.9 Tchl-a+0.58 0.36 18
POP0.2µm=0.14 Tchl-a−0.00 0.48 92 POP0.2µm=0.07 Tchl-a+0.038 0.2 18
PC0.7 µm=6.4 PON0.7 µm+0.17 0.87 207 PC0.7 µm=6.3 PON0.7 µm−1.74 0.88 29
PC0.7 µm=17.0 Tchl-a+0.71 0.31 207 PC0.7 µm=7.9 Tchl-a+2.85 0.72 29
PON0.7 µm=2.66 Tchl-a+0.084 0.44 207 PON0.7 µm=1.25 Tchl-a+0.73 0.75 29
Tchl-a0.2µm=0.98 Tchl-a0.7 µm+0.001 0.99 23 (a) 0 10 20 30 40 50 60 70 70 90 110 130 150 LONGITUDE °W T U R N O V E R d a y PN PC (b) 0 2 4 6 8 10 12 70 90 110 130 150 LONGITUDE °W T U R N O V E R d a y PN PC
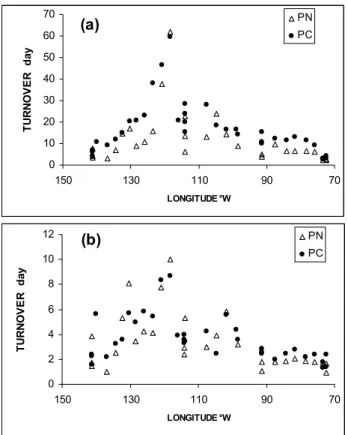
Fig. 6. Longitudinal evolution of turnover time (day) of particulate
carbon (PC) and particulate nitrogen (PN) collected on GF/F filters, estimated as the PC/versus photosynthesis and PN /nitrogen uptake rates ratios. (a) total material collected on GF/F filters. (b) particles containing chlorophyll estimated from Tchl-a Vs PC and TChl-a vs PN relationship (see Table 2).
have a C/N ratio slightly higher than the Redfield value (0.36/0.04=9). Consequently, the particulate matter in the
(a) -10 -5 0 5 10 15 20 25 0 200 400 600 800 1000 POC:TChla δ 15 N UPW EGYR GYR HLNC MAR (b) -10 -5 0 5 10 15 20 25 0 50 100 150 PON:TChla δ 15N UPW EGYR GYR HLNC MAR
Fig. 7. Relationship between δ15N PON (‰) with the ratio of POC:TChl (a) and PON:Tchl (b). There is no significant relation-ship between δ15N PON and the ratios, except for the east Gyre area (EGY) where δ15N PON = 0.016 POC:TChl + 6.5 with r2=0.73 and
δ15N PON=0.11 PON: Tchl + 6.1 with r2= 0.76.
<GF/F filtrate was essentially carbon rich with no
chloro-phyll particles. Using photosynthesis rates and nitrogen uptake (Raimbault and Garcia, 2007), we can calculate the residence time of PC and PN collected on GF/F filters in the photic zone (Fig. 6a) as proposed by Copin-Mont´egut and Copin-Mont´egut (1978). Average residence times of less than 10 days were found in the Marquesas Island waters and around 4–5 days in the upwelling, while values increased to more than 30 days in the SPG. It should be noted that carbon turnover times were 10 to 15% higher than those of nitrogen. Using POM vs TChl-a relationships (Table 2), the turnover time of photosynthetic particles, containing chlorophyll, can be estimated (Fig. 6b). In this case, residence times were close to 1 day in the upwelling, 2 to 3 days in the Marquesas sector and ranged from 4 to 6 days in the SPG.
The distribution of the natural 15N isotope (δ15N) can provide useful information regarding the origin of this or-ganic matter. The abundance of this stable isotope of nitro-gen (15N) has been widely employed for N cycle studies in
(b) 50 100 150 200 250 D E P T H (m ) MAR EGYR UPW (a) 50 100 150 200 250 D EPT H ( m ) HLNC GYR
Fig. 8. Vertical profiles of 15N natural abundance (δ15N) in suspended particulate matter within the euphotic zone obtained at 5 sites in the South East Pacific. (MAR=141.3◦W; 8.4◦S; HLNC=136.8◦W; 9◦S; GYR=114◦W, 26◦S); EGY=eastern bor-der of the gyre (91.4◦W, 31.8◦S; UPW=73◦W–34◦S).
the oceans (e.g. Wada and Hattori, 1991), as differences in the natural abundance15N:14N ratio (0.3663%) between or-ganic matter pools can be used to constrain the source ma-terials from which they were derived, but only in absence of trophic bias. It is well known that inclusion of particulate matter derived from higher trophic levels than phytoplank-ton, i.e. zooplankphytoplank-ton, would add PON enriched in15N (Mi-nagawa and Wada, 1984) and not chlorophyll to the particu-late biomass. Thus, as proposed by Waser et al. (2000) and Mahaffey et al. (2004), this trophic bias appears important if a positive relationship between the ratio of POC:Chlorophyll or PON:chlorophyll and δ15N is observed. Figures 7a and 7b revealed that there was no such relationship in the re-gions investigated, except for samples from east Gyre (EGY). Consequently, suspended PON in the latest region was as-sumed to reflect some influence of trophic transfer and can not be presented as the composition of phytoplankton. For the other regions, the range of δ15N in the suspended partic-ulate matter collected on GF/F filters varied greatly in the su-perficial layer but seemed to display coherent patterns with the trophic gradient (Fig. 8). The western area of the tran-sect (MAR and HNLC sites) showed typical values of 5–6‰ for marine phytoplankton found in oceanic regions that are not strongly affected by upwelling or derived N-inputs (Al-tabet and McCarthy, 1986). This value was close to those of δ15N-NO3(6.5‰) reported in the central Pacific (Liu and
Kaplan, 1989). Large negative values were found in deep wa-ters around (140◦W) associated with high nitrite and
ammo-nium concentrations (Fig. 2). This could be due to biological utilization of regenerated nitrogen generally characterized by negative isotope fractionation (Hoch et al., 1992), since am-monium excreted by zooplankton is depleted in15N (Check-ley and Miller, 1989). The Central South Pacific Gyre was characterized by low δ15N, close to 2‰, which is the signa-ture of enhanced dinitrogen fixation (Minagawa and Wada, 1984; Dore et al., 2002). The highest δ15N values (up to
Fig. 9. Vertical section of dissolved organic carbon (DOC),
dis-solved organic nitrogen (DON) and disdis-solved organic phosphorus (DOP). Units are µmoles l−1(Ocean Data View software (ODV), version 3.1, Reiner Schlitzer, http://odv.awi.de).
15‰) were found in the upwelling area. These values over-lap those generally observed in oceanic waters, indicating the use of a nitrogen source enriched in15N. In fact, it is well known that δ15N in the nitrate pool increases as concentra-tions decrease, because of the rapid utilization of the light isotope14N, which is preferentially assimilated during pho-tosynthesis. Consumption of nitrate during the early stages of the upwelling, when diatoms grow actively, will be ac-companied by a significant isotopic fractionation leading to a large increase in δ15N (up to 30‰), when residual nitrate reaches 10 to 20% of the initial concentration (Montoya and Mc Carthy, 1995). Phytoplankton using this residual15 N-enriched nitrate for growth, as occurred in offshore upwelling water sampled during this study, could exhibit a heavier ni-trogen signature. Another explanation could be the biologi-cal use of enriched15N-nitrate coming from the denitrifica-tion layer, as δ15N in the nitrate pool can reach 20‰ during this process (Cline and Kaplan, 1975).
3.4 Distribution of dissolved organic nutrients
The vertical profiles of dissolved organic carbon (DOC), dissolved organic nitrogen (DON) and dissolved organic phosphorus (POD) are shown in Fig. 9. The main fea-ture was the high DOC concentration (>100 µmoles.l−1)
exhibiting a patchy maximum in the superficial layer (0– 150 m) in the SPG (between 125◦W and 100◦W). This DOC concentration was slightly higher than those measured in the surface waters of the upwelling (100 µmoles.l−1). The lowest surface concentrations (<80 µmoles l−1) were found in the Marquesas area. Classical low DOC values (<60 µmoles l−1) were measured at depths below 70 m in the Marquesas and upwelling regions, and only below 250– 300 m in the central region. The DOC concentrations in deeper waters (>500 m) presented no significant variations (47±5 µmoles l−1) and were consistent with values found
in various oceanic regions (Hansell and Carlson, 1998). The lowest value (42.7 µmoles l−1) was measured at 3000 m (114◦W–26◦S). DON concentrations were uniformly dis-tributed in the photic layer and no subsurface maximum was observed. The general pattern of DON showed no significant geographical variation, with concentrations ranging from 5.5 to 6 µmoles l−1throughout the 0–150 m water column, with the exception of the upwelling where concentrations reached 9 µmoles N l−1near the surface. Classical low residual con-centrations (<3 µmoles l−1) were measured below 250 m. The lowest value (2.7–3 µmoles l−1) was measured below 1200 m. DOP exhibited a more variable distribution with two marked maxima at the eastern edge of the SPG and in the upwelling (>0.2 µmoles l−1). Elsewhere, superficial
val-ues ranged between 0.10 and 0.15 µmoles l−1. The isoline
0.1 µmoles l−1was generally located around 20 m with the exception of the upwelling region where it reached 100 m. DOP decreased rapidly below 250 m becoming abruptly, un-detectable. Contrary to carbon and nitrogen, phosphorus is more quickly liberated from dead material (Menzel and Ry-ther, 1964; Clark et al., 1999). As a consequence, in the open ocean, the proportion of detrital P in the phosphorus pool is low (Faul et al., 2005), and no DOP was detected in the deep waters. Due to total inorganic nitrogen depletion DON accounted for almost 100% of the nitrogen in the surface wa-ter of the SPG, while DOP accounted for 20 to 50% of total phosphorus.
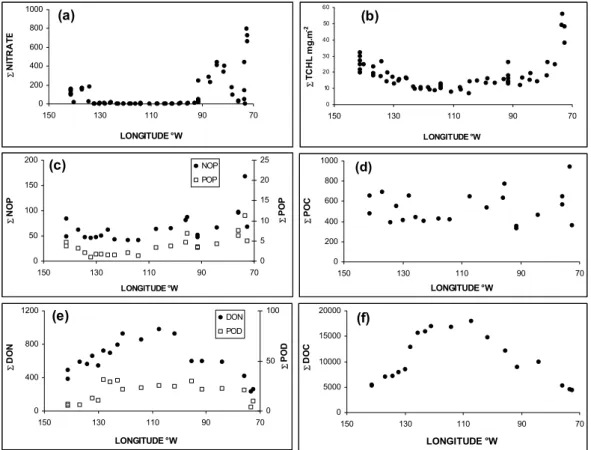
Another view of the geographical distribution of the ma-jor biogeochemical parameters can be demonstrated using the pattern of integrated values over the euphotic zone (Ze). The distribution of integrated nitrate (Fig. 10) confirms the main characteristic of the SPG, i.e. complete depletion of inorganic nitrogen. Integration over Ze was close to zero between 130 and 100◦W. Integrated chlorophyll followed the same geographical trend, with very low values in the SPG, where Ze integration was lower than 10 mg m−2. It should be noted that a large proportion of chlorophyll (up to 50%) was located below the 1% light penetration depth,
with the exception of the upwelling and Marquesas regions. Consequently, in the SPG, integrated Tchl-a over 1.5 Ze was twofold higher than content over Ze. In contrast to nitrate and chlorophyll, integrated particulate organic matter (in terms of POC, PON and POP) did not show a clear geographical gradient. Integrated values over Ze, remained more or less constant along the transect, except in the upwelling system, where values significantly increased. The ranges were 400– 500, 50–75 and 2–4 mmoles m−2for POC, PON and POP, re-spectively. In the upwelling, content increased significantly reaching 900, 180 and 10 mmoles m−2for POC, PON and POP, respectively.
In contrast, integrated dissolved organic carbon (6DOC), dissolved organic nitrogen, (6DON) and dissolved organic phosphate (6DOP), exhibited lowest values in the upwelling and Marquesas regions (5000, 500 and 15 mmoles m−2, for
6DOC, 6DON and 6DOP over the photic zone,
respec-tively). The highest values were measured in the centre of the gyre between 115 and 105◦W, where 6DOC, 6DON
and 6DOP reached 17 000, 900 and 30 mmoles m−2, respec-tively. Over the photic layer, the integrated inorganic and organic dissolved nutrient data exhibited a clearly opposing trend in the South Pacific
4 Discussion
The BIOSOPE transect crossed the central region of the South Pacific, while extreme stations were influenced ei-ther by the Marquesas Islands or Chilean upwelling. As ini-tially expected and confirmed by satellite imagery, the Cen-tral South Pacific Gyre is a very oligotrophic area (Claustre and Maritorena, 2003), characterized by a strong depletion in inorganic nitrogen and very low phytoplanktonic biomass. Since the development of sensitive analytical procedures, it has been shown that nitrate concentrations of subtropical sur-face waters over much of the world’s oceans, including the subtropical gyres, is often at sub-micromolar concentrations (3 to <50 nmoles l−1). Using a chemiluminescent method, Garside (1985) and Eppley et al. (1990) previously found ni-trate concentrations <10 nM in the Sargasso Sea and in the subtropical Pacific. These concentrations, which would be depleted in a few hours by the ambient assemblages of phy-toplankton, were low but not zero. For these authors, these residual concentrations were kept greater than zero due to some physical process such as atmospheric inputs and night-time convection. We could assume that all of these processes occur at very low rates in the South Pacific Gyre (SPG) lead-ing to a permanent and complete nitrate depletion (nitrate content over the photic layer was close to 0 µmoles m−2). More, top-down wind-driven mixing of the water column sel-dom deepens the mixed layer below 100 m, and measurable increases of nitrate concentration in surface waters were un-likely over the year in the SPG, as the nitracline was below 160 m.
0 200 400 600 70 90 110 130 150 LONGITUDE °W Σ N IT R A T E 0 10 20 30 40 70 90 110 130 150 LONGITUDE °W Σ T C H L m g .m (d) 0 200 400 600 800 1000 70 90 110 130 150 LONGITUDE °W Σ PO C (f) 0 5000 10000 15000 20000 70 90 110 130 150 LONGITUDE °W Σ D O C (c) 0 50 100 150 200 70 90 110 130 150 LONGITUDE °W Σ N O P 0 5 10 15 20 25 Σ PO P NOP POP (e) 0 400 800 1200 70 90 110 130 150 LONGITUDE °W Σ D O N 0 50 100 Σ PO D DON POD
Fig. 10. Geographical distribution of nitrate (6nitrate), total chlorophyll-a (6TCHL), dissolved organic carbon (6DOC), dissolved organic
nitrogen (6DON), dissolved organic phosphorus (6DOP), particulate organic carbon (6POC), particulate organic nitrogen (6PON) and particulate organic phosphorus (6POP) integrated over the photic zone (Ze=1% surface light).
Similarly, the very low concentrations of nitrite and am-monium and the lack of a significant subsurface maximum, generally found in all stratified systems, were unexpected. It has been hypothesized that subsurface ammonium max-ima are produced by local imbalances between ammonium regeneration and uptake, caused by active regeneration at the base of the photic zone where ammonium uptake by the phytoplankton is inhibited by low light intensities. In the present case, ammonium concentrations below the detection limit could be due to the lack of regeneration activity, or to a tight coupling between regeneration and ammonium uptake and ammonium oxidation (=nitrification). Brandhorst (1958) and Wada and Hattori (1971) suggested that nitrite origi-nates from bacterial oxidation of ammonia. Vaccaro and Ry-ther (1960) first proposed that the appearance of nitrite near the nitracline would be caused by the reduction of nitrate by phytoplankton. Reasoning from laboratory experiments (Raimbault, 1986), argued that increases in nitrite concen-trations are expected when phytoplankton starved of nitro-gen, are exposed to increased concentrations of nitrate and decreased temperature and irradiances, such as those occur-ring at the base of the photic layer. The primary nitrite maxi-mum generally occurs in a light limited regime where nitrate
is abundant and can define precisely the deep layer of the euphotic zone in which light becomes a limiting factor on primary production (Voituriez and Herbland, 1977). Thus, the primary nitrite maximum widely distributed in the ocean (Vaccaro and Ryther, 1960; Olson, 1981) has often been con-sidered as an indicator of new production through phyto-plankton excretion, or bacterial oxidation of organic matter, as well as a signature of the depth at which light limitation occurs (Ward et al., 1989). In a recent review, Lomas and Lipschultz (2006) concluded for the predominance of excre-tion from phytoplankton growing on nitrate, while bacterial nitrification likely playing only a supporting role. In return, the very low concentration of nitrite as observed at the base of the photic layer in the SPG, could reveal a very low diffu-sion of nitrate, as well as the lack of significant new produc-tion (nitrate uptake by phytoplankton) both in the DCM and in the nitracline.
In spite of the marked depletion in inorganic nitrogen lead-ing to undetectable concentrations throughout the 0–160 m water column, phosphate concentrations, while being lower than those found near to the Marquesas Islands and Chilean coast, remained >0.1 µmoles l−1 in the SPG. The signifi-cant amounts of phosphate in the superficial nitrate-depleted
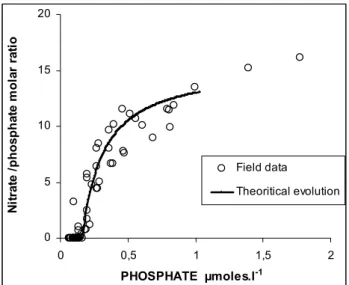
0 5 10 15 20 0 0,5 1 1,5 2 PHOSPHATE µmoles.l-1 N it ra te / p h o s p h a te m o la r ra ti o Field data Theoritical evolution
Fig. 11. Nitrate/phosphate ratio versus phosphate concentration in
the SPG; Open circles=field data. The curve fit the theoretical re-lationship obtained from phosphate and nitrate utilization by phy-toplankton, according to the Redfield ratio (15.5), of deep nutrients coming from below the photic zone with a nitrate:phosphate ratio
≈12–13.
layer of this tropical region confirmed previous observations made at 150◦W and 16◦S (Raimbault et al., 1999c). The reason for this excess phosphate and/ or the deficit in nitrate (around 2 µmoles l−1when applying the N/P Redfield ratio) is not clear. But it reflects the general feature of nitrate and phosphate distribution in the world ocean, where nutrient-depleted waters usually contain a small residue of phosphate (Tyrell, 1999). This has led to the biological concept that dissolved inorganic nitrogen (mainly nitrate) is the most lim-iting nutrient and that nitrogen dynamics are important for controlling phytoplankton productivity. However, the geo-chemists point of view would suggest that phosphate could be the ultimate limiting factor in aquatic systems, because of the nitrogen-fixers, which can use the available atmospheric dinitrogen. This scheme has been experimentally demon-strated in lakes, but not in the ocean (Smith, 1983). In return, according to this hypothesis, the residual phosphate found in the South east Pacific could demonstrate very low fixation of nitrogen, although available inorganic phosphorus offers favorable conditions for nitrogen-fixers. In fact low δ15N in POM confirms that nitrogen fixation is an important process in the SPG, but the rates are too low to drive phosphate deple-tion (Raimbault and Garcia, 2007), at least during the season investigated here. It should be noted that nitrate/phosphate ratios were less than the Redfield’s constant of 16 (Redfield et al., 1963) down to 400–500 m, indicating that the deep reservoir of nutrients was also nitrogen deficient. The east-ern Pacific Ocean near the Chilean coast is one of the ma-jor areas of denitrification in the world oceans (Codispoti et al., 1976). Deutsch et al. (2001) argue that denitrification
inside the oxygen minimum zone of the Peru-Chilean up-welling generates nitrogen-deficient waters which carry sur-plus phosphorus. Due to the isolation of the SPG, nutrient input into the euphotic zone appears to be mainly through diffusive process, which in this case could bring in nitrate and phosphate with a low N/P ratio (around 12–13). This ob-servation suggests that the biological utilization of deep nu-trients by phytoplankton with a typical N/P requirement of 15.5 would decrease the N/P ratios to very low values. Our field data closely fit such a theoretical removal of nutrients (Fig. 11), suggesting that phytoplankton consumption of N-deficient nutrient pools would be the probable cause of such a phosphate residual value (≈0.1 µmoles l−1) in the photic layer.
The nitrate/silicic acid ratio (NO3/Si) generally ranged
be-tween 1 and 4 over the whole transect except in the SPG, where nitrate depletion gave a ratio close to 0. A high NO3/Si
ratio (>5 and up to 8) was observed in the low salinity tongue located at 95◦W. In comparison to the Redfield ratio and to the phytoplankton requirement (Fleming, 1940), these val-ues indicate a deficit in silicic acid relative to nitrate (when detectable) in the 0–300 m superficial layer, especially in the euphotic zone. A strong deficit in silicic acid was noticeable in the western area near the upwelling zone. According to the elemental composition of diatoms, characterized by the N/Si ratio of 1 (Brzezinski, 1985), it is expected that diatoms will take up nutrients from surrounding waters with a similar ratio. Thus, values of NO3/Si ratio higher than 1 may imply
silicate-limitation.
Changes in the values and shapes of the chlorophyll pro-files from west to east clearly show the expected differences in productivity driven by nutrient availability. The hyper oligotrophic centre of the SPG make up the clearest water of the worlds ocean (Morel et al., 2007) and is characterized by extremely low surface Tchl-a concentrations (<0.03 µg l−1). In this region, primary production was strongly nutrient lim-ited considering the absence of terrestrial inputs (Jickells et al., 2005) and the depth of the nitracline (around 160–180 m). Nevertheless, the decrease in chlorophyll content between the upwelling and SPG was much lower (about four-fold) than the decrease in nitrate content (hundred to thousand fold). A chlorophyll maximum, permanently associated with the nitracline, was always detectable with values never lower than 0.20 µg l−1, at least ten-fold greater than measured in the upper layer. When the data was pooled no correlation was found between the magnitude of the DCM and nutrient con-centration. Vertical distribution of POM was nearly always homogeneous without a subsurface maximum layer. With exception of the upwelling waters, the chlorophyll maximum was never associated with an increase of biomass in terms of carbon, nitrogen or phosphorus. Moreover, while sur-face concentrations reflected the oligotrophic conditions with lowest values in the SPG (by a factor 2), the integrated values over the photic zone did not reveal such marked trophic gra-dients. In fact, the photic layer of the SPG contains slightly
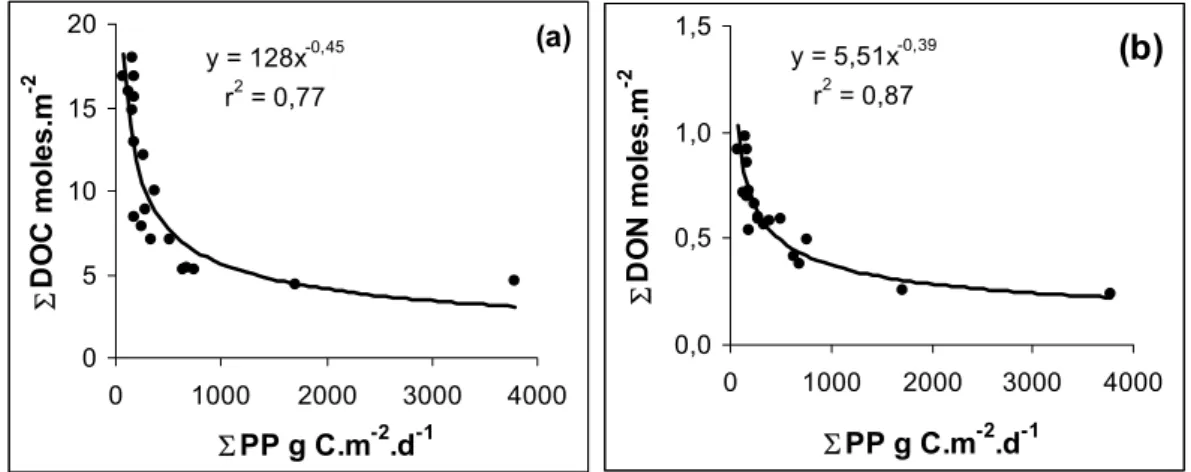
y = 128x r2 = 0,77 0 5 10 15 0 1000 2000 3000 4000 ΣPP g C.m-2 .d-1 Σ D O C m o le s .m -2
(b)
y = 5,51x r2 = 0,87 0,0 0,5 1,0 0 1000 2000 3000 4000 ΣPP g C.m-2 .d-1 Σ D O N m o le s .m -2Fig. 12. Contents of dissolved organic carbon ((a): 6DOC) and dissolved organic nitrogen ((b): 6DON) over the photic layer versus
integrated primary production (6PP).
less POM than the upwelling, but as much as the Marquesas areas. However, all of these oceanic regions were character-ized by very different turnover times for particulate matter, as well as by different nitrogen sources as indicated by the nat-ural abundance of δx5N. The SPG was characterized by par-ticulate matter having very long residence times (20 days). However, values found in the upwelling and the Marquesas region (5 to 10 days) were close to those noted in the Central north Pacific (Laws et al., 1987) and in the equatorial Pacific (Eppley et al., 1992). The low δ5N of PON (2‰) suggests a greater role of N2fixation in supporting production in the
SPG, as typically observed in subtropical oceans (Minagawa and Wada, 1986), whereas a higher ratio (5–6‰) indicated a greater role of nitrate in the surrounding regions. Because
δ5N remained very low throughout the photic layer in the SPG, it is clear that (1) vertical mixing does not penetrate the nitracline, and (2) primary production in the superficial layer would be essentially supported by nitrogen regeneration and by N2-fixation (Raimbault and Garcia, 2007), both processes
lower δx5N values.
With the exception of the upwelling, POC and PON col-lected on 0.2 µm membranes were higher than those retained on GF/F filters, confirming that the use of GF/F filters can greatly underestimate the concentration of particulate mat-ter, especially in oceanic oligotrophic waters where the un-derestimation can be up to 50% (Altabet, 1990; Libby and Wheeler, 1997; Raimbault et al., 2000; Fernandez and Raim-bault, 2007). However, the GF/F filters were proven to be efficient in collecting chlorophyll, so we can postulate that the organic matter in the <0.7 µm GF/F filtrate was essen-tially made up of carbon- rich particles (POC/PON>6.6), but without chlorophyll.
The final unexpected result was the large dissolved or-ganic matter (DOM) accumulation in the surface waters of the vast central region of the SPG. DON and DOP concen-trations were similar to those generally observed in oceanic
waters of the Pacific Ocean (Karl et al., 1993; Raimbault et al., 1999) in spite of very low concentrations of inorganic nutrients. In contrast, our range of DOC found in the SPG (>100 µmoles l−1) overlapped concentrations generally
ob-served in surface oceanic waters and were about 10 to 20% higher than maximal values reported for the North Pacific Gyre (Church et al., 2002). Nevertheless, levels greater than 100 µmoles l−1(up to 140 µmoles l−1) have been previously reported in the North Atlantic (Kepkay and Wells, 1992), al-though in this case, high DOC concentrations were associ-ated with very high chlorophyll concentrations (>10 µg l−1). The marked geographical gradient suggests a net in situ source exists, mainly attributed to biological processes since this DOC accumulation was close to the surface layer where elevated primary production was observed (Raimbault and Garcia, 2007). This excess, much higher than the total par-ticulate organic content, was greatest at the western edge of the SPG, associated with a high turnover rate of POM. The C:N ratio of the particles varied little along the transect, ranging from 5 to 7. In contrast, the global relationship be-tween DOC and DON was significantly higher (DOC=10.14 DON+0.31; r2=0.35; n=250). Excluding old recalcitrant DOM (43 µmoles.l−1 DOC, and 3 µmoles l−1 DON), the C/N ratio of the “freshly formed DOM” (excess DOM in sur-face water relative to deep water) was around 16–23, which is close to the range (20–23) found in the North Pacific by K¨ahler and Koeve (2001) and Karl and Tien (1997). In short, DOM with a C: N ratio far greater than Redfield’s value (low-N DOM or C-rich DOM) was accumulated in the surface wa-ter with a magnitude that increased exponentially with levels of oligotrophy as noted here by the rates of primary produc-tion (Fig. 12).
It has been assumed that the bulk of DOC (as well as DON and DOP) has its fundamental origin in surface ocean wa-ters via such processes as phytoplankton excretion, lysis or solubility of living and detrital POM, and sloppy feeding
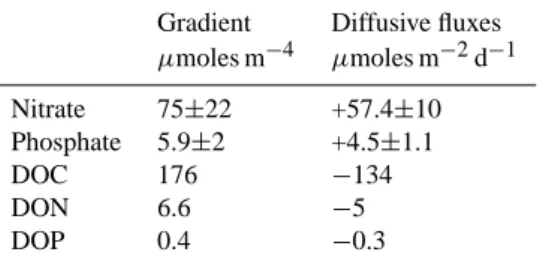
Table 3. Comparison of gradient and turbulent diffusion of
nu-trients through the thermocline, calculated from vertical diffusion coefficients (Kz=0.76±0.81 m2d−1) and gradients of organic (dis-solved organic carbon=DOC, dis(dis-solved organic nitrogen=DON and dissolved organic phosphorus=DOP) or inorganic nutrients (nitrate, phosphate) in the SPG (122◦W–101◦W). Upward fluxes are con-sidered as positive and downward fluxes as negative.
Gradient Diffusive fluxes
µmoles m−4 µmoles m−2d−1 Nitrate 75±22 +57.4±10 Phosphate 5.9±2 +4.5±1.1 DOC 176 −134 DON 6.6 −5 DOP 0.4 −0.3
at various trophic levels. Therefore this DOC concentra-tion is the result of a large array of producconcentra-tion, consump-tion and transformaconsump-tion processes due to biological activity (Williams, 1975). Phytoplankton are the major producers (Biersmith and Benner, 1998) releasing 5–10% of the total photosynthetic carbon production under rapid growth condi-tions, and considerably more under nutrient limited growth, because carbon fixation may exceed incorporation into cell material (Carlson, 2002). DOC production is also influ-enced by the phytoplankton community composition (Bid-danda and Benner, 1997) and is greatly enhanced by graz-ing of protists and copepods (Strom et al., 1997). Biologi-cal release of DOC and DON during field experiments has been reported for different types of marine waters (Karl et al., 1998; Bronk and Glibert, 1993; Bronk and Glibert, 1994; Bronk et al., 1994; Raimbault et al., 1999b; Fernandez and Raimbault, 2007). In a tightly coupled system with a rapid turnover, a fraction of this DOC is labile and will fuel het-erotrophic and photo-hethet-erotrophic production. But, over longer time scales, biological production and accumulation of DOC and DON seem to be evident in oceanic regions (Avril, 2002; Libby and Wheeler, 1997), processes which would be favoured by nutrient depletion (K¨ahler and Ko-eve, 2001). In seasonal studies of the dynamics of inor-ganic and orinor-ganic nitrogen, Buttler et al. (1979), Maita and Yanada (1990) and Libby and Wheeler (1997) found an in-verse relationship between nitrate concentration and DON in the English channel, the sub arctic Pacific water, and in the Equatorial Pacific, respectively. Zweifel et al. (1993) showed that the addition of nutrients to samples from a nutrient-depleted system promoted DOC breakdown, which also im-plies that the lack of nutrients favours DOC preservation. Cauwet et al. (2002) reported that during nutrient deficiency, bacteria are unable to utilize a carbon-rich organic substrate like carbohydrates. Therefore as suggested by Thingstad et al. (1997) and Tanaka and Rassoulzadegan (2002), this surface accumulated DOC could indicate long term
mal-functioning of the microbial loop; this could be related to bacteria-phytoplankton competition for inorganic nutrients that reduce DOC remineralization in nutrient-depleted water. According to Eppley and Peterson (1979), annual new pro-duction must balance the organic particle flux from the eu-photic zone to the deep waters. Thus, particulate export in the sea is traditionally considered to vary with new pro-duction, increasing with the input of nitrate from deep wa-ters that penetrates through the nitracline. Under ecologi-cal conditions where large amounts of DOM are produced in response to inorganic nutrient limitation, such as those described in this study, the traditional particulate matter bi-ological pump may be completed with the export of dis-solved matter (Copin-Mont´egut and Avril, 1993; Carlson et al., 1994; Toggweiller, 1989). Several studies in oceanic en-vironments have shown DOC accumulation over the produc-tive period in the upper water column where it is homog-enized. This DOC, accumulates from summer to autumn, then disappears from the surface layer during destratification and winter mixing (Copin-Montegut and Avril, 1993; Carl-son et al., 1994). Except some Ekman wind-driven circula-tion which can lead to lateral transport of significant part of DOM (Roussenov et al., 2006; Mahaffey et al., 2004), hor-izontal advection can be neglected in the centre of the SPG that can be considered as at rest. Intense seasonal convec-tive mixing is excluded enabling the SPG to maintain high DOC concentrations and act as a large and a long-term reser-voir of biological carbon. Another route for DOC transfer is via the diffusive mode, which could persist in this permanent stratified water. Assuming that nutrient flux (inorganic or in-organic) in or out of the mixed layer is linearly correlated to the gradient (δnutrient/δz, units=µmolm−4) from the bottom
of the mixed layer by a vertical diffusion coefficient (Kz; units=m2d−1), we can calculate the diffusive vertical fluxes
(Fnutrients; units µmolm−2d−1) using the following equation:
Fnutrient=Kz δNutrient/δz.
Kz is the diffusion coefficient obtained from the
follow-ing equation: Kz=0.24 ε/N2, where ε (units, m−2s−3) is the turbulent kinetic energy dissipation and N (units, s−1) is
the buoyancy (Br¨unt-V¨ais¨al¨a) frequency (Oakey, 1982). Val-ues for ε as well as for Kz are rarely experimentally avail-able, especially in oceanic waters. However, assuming the only nitrate source for phytoplankton growth comes from deep water via turbulent diffusion, we can propose that the biological nitrate uptake is equal to this diffusive flux, as suggested by King and Devol (1979). Using integrated ni-trate uptake rates measured in the SPG (60 µmoles m−2d−1;
Raimbault and Garcia, 2007) and nitrate gradients from the top of the thermocline (75.4±22 µmoles m−4), the Kz value is estimated (0.76±0.81 m2d−1=0.09±0.1 cm2s−1). This value agrees with previous results obtained from oceanic wa-ters (Eppely et al., 1979; King and Devol; 1979; Lewis et al., 1986) ranging from 0.06 to 0.75 cm2s−1. The diffu-sive fluxes of inorganic and organic dissolved nutrients in the SPG calculated using this Kz value, are presented in
These DOC and DON fluxes were equivalent to the particle flux measured simultaneously, using drifting sediment traps placed just below the photic zone (12–96 µmoles C m−2d−1; 2.8–14 µmoles N m−2d−1, J. C. Miquel, personal commu-nication). When considering the mean primary production in the SPG (0.15 g m−2d−1; Raimbault and Garcia, 2007), this calculated downward DOC flux represents a low pro-portion of the total primary production (≈2%), but a large fraction (34%) of the new production as calculated from inte-grated nitrate uptake (60×6.6=396 µmoles C m−2d−1). As-suming these values are constant throughout the year, we can deduce an annual diffusive export of 0.44 gC m−2y−1, a lower value than that obtained by Avril (2002) for the Mediterranean sea during the oligotrophic stratified pe-riod (1 g C m−2y−1). Global DOC export (vertical
mix-ing+turbulent mixing) is estimated to be 1.7 GT/year (Six and Maier-Reimer, 1996), a value consistent with the oceanic “missing” CO2 sink quantified to be about 1.8 GT C.y−1
(Siegenthaler and Sarmiento, 1993). According to Avril (2002) about 10% (170∗106T/y−1) of this global DOC port could be due to diffusion processes. The diffusive ex-port of the entire South Pacific gyre, representing 1.1% of the global oceanic surface (4.106km2), is estimated to be about 2.5 106T C and could represent about 1.5% of the global DOC diffusive flux. Assuming DOC release rates are 4 to 10% of gross production, levels generally reported in the literature (Mingelbier et al., 1994) and a 2% loss by diffusion (see above), the excess DOC in the centre of the SPG (10 000 mmoles C m−2=120 g C m−2) would
corre-spond to an accumulation over a period of 41 to 124 years. Therefore our present calculation suggests a significant role of the SPG in the global biogeochemical budget of carbon, for (1) long-term storage in surface waters and (2) significant export to deep water.
5 Conclusions
As expected from satellite imagery, the South Pacific Gyre (SPG) transected by the BIOSOPE cruise, is a very olig-otrophic area characterized by a strong depletion of inor-ganic nitrogen and very low phytoplanktonic biomass. The distribution of hydrological parameters and inorganic nutri-ents clearly showed that the organic parameters (particulate or dissolved) varied much less than might be expected from nutrient distributions. The most important feature observed was the large accumulation of dissolved organic matter, re-flecting the specific functioning of the productivity system and the biological CO2pump. The SPG can store and
pre-serve a large quantity of low-N organic material in the photic layer. The surface waters of the SPG, once described as a “monotonous and unchanging oceanic desert” (Claustre and Maritorena, 2003), could be home to a dynamic ecosystem
field constant appears to be strongly influenced by carbon dynamics and was not linearly coupled with that of nitrogen. Moreover, assuming that there is no real steady-state for car-bon cycling, a large quantity of atmospheric carcar-bon, fixed by photosynthesis, can ultimately be accumulated over long periods in the surface layer and not immediately exported. Consequently understanding both the DOC production rates and the chemical composition of this accumulated pool is es-sential before accurate biogeochemical and metabolic mod-els can be formulated for this ultra-oligotrophic system of the South Pacific Gyre.
Acknowledgements. This is a contribution of the BIOSOPE project of the LEFE-CYBER program, funded by the Centre National de la recherche Scientifique (CNRS), the Institut des Sciences de l’Univers (INSU), the Centre National d’Etudes Spatiales (CNES), The European Space Agency (ESA), the National Aeronautics and Space Administration (NASA) and the natural Sciences and Engineering Research Council of Canada (NSERC). This work is fund in part by the French Research and Education Council. The Biosope cruise program was managed by H. Claustre and A. Sciandra. We thank the crew of the R/V Atalante for outstanding shipboard support operations. Data concerning Euphotic Layer Depths was kindly provided by H. Claustre and J. Ras. D. Taillez and C. Bournot are thanked for their efficient help in CTD rosette management and data processing, as is J. C. Miquel for providing particulate samples from an in situ pump. The authors gratefully thank the two anonymous referees who helped to make substantial improvements in the manuscript and T. Bentley for her linguistic and scientific advice.
Edited by: S. Pantoja
References
Altabet, M.: Organic C, N and stable isotopic composition of partic-ulate matter collected on glass-fibre and aluminium oxide filters, Limnol. Oceanogr., 35, 902–909, 1990.
Altabet, M. A. and McCarthy, J. J.: Vertical patterns in15N natural abundance in PON from the surface waters of warm-core rings, J. Mar. Res., 44, 203–225, 1986.
Andri´e, C., Bouloubassi, I., Cornu, H., Fichez, R., Pierre, C., and Rougerie, F.: Chemical tracer studies in coral reef interstitial wa-ters (French Polynesia), Implications for endo-upwelling circu-lation, in: Proceedings of the 7th Coral Reef International Sym-posium, edited by: Richmond, R. H., Univ of Guam press, 1165– 1173, 1993.
Armstrong, F. A. J., Stearns, C. R., and Strickland, J. D. H. : The measurement of upwelling and subsequent biological processes by means of the Technicon AutoAnalyzer and associated equip-ment, Deep-Sea Res., 14(3), 381–389, 1967.
Avril, B.: DOC dynamics in the northwestern Mediterranean Sea (DYFAMED Site), Deep-Sea Res., 49, 2163–2182, 2002. Biddanda, D. and Benner, R.: Carbon, nitrogen and carbohydrate