HAL Id: insu-01176058
https://hal-insu.archives-ouvertes.fr/insu-01176058
Submitted on 5 Aug 2020
HAL is a multi-disciplinary open access
archive for the deposit and dissemination of
sci-entific research documents, whether they are
pub-lished or not. The documents may come from
teaching and research institutions in France or
abroad, or from public or private research centers.
L’archive ouverte pluridisciplinaire HAL, est
destinée au dépôt et à la diffusion de documents
scientifiques de niveau recherche, publiés ou non,
émanant des établissements d’enseignement et de
recherche français ou étrangers, des laboratoires
publics ou privés.
Water formation in the upper atmosphere of the early
Earth
Benjamin Fleury, Nathalie Carrasco, Emmanuel Marcq, Ludovic Vettier, Anni
Määttänen
To cite this version:
Benjamin Fleury, Nathalie Carrasco, Emmanuel Marcq, Ludovic Vettier, Anni Määttänen. Water
formation in the upper atmosphere of the early Earth. The Astrophysical journal letters, Bristol :
IOP Publishing, 2015, 807 (2), pp.L29. �10.1088/2041-8205/807/2/L29�. �insu-01176058�
WATER FORMATION IN THE UPPER ATMOSPHERE OF THE EARLY EARTH
Benjamin Fleury1, Nathalie Carrasco1,2, Emmanuel Marcq1, Ludovic Vettier1, and Anni Määttänen1 1
Université Versailles St-Quentin; Sorbonne Universités, UPMC Univ. Paris 06; CNRS/INSU, LATMOS-IPSL, 11 Boulevard d’Alembert, F-78280 Guyancourt, France;benjamin.fl[email protected]
2
Institut Universitaire de France, 103 Bd St-Michel, F-75005 Paris, France Received 2014 December 30; accepted 2015 June 17; published 2015 July 10
ABSTRACT
The water concentration and distribution in the early Earthʼs atmosphere are important parameters that contribute to the chemistry and the radiative budget of the atmosphere. If the atmosphere above the troposphere is generally considered as dry, photochemistry is known to be responsible for the production of numerous minor species. Here we used an experimental setup to study the production of water in conditions simulating the chemistry above the troposphere of the early Earth with an atmospheric composition based on three major molecules: N2, CO2, and H2.
The formation of gaseous products was monitored using infrared spectroscopy. Water was found as the major product, with approximately 10% of the gas products detected. This important water formation is discussed in the context of the early Earth.
Key words: astrochemistry– Earth – planets and satellites: atmospheres
1. INTRODUCTION
Determining the environment of the Earth before the apparition of the life is of prime interest to determine criteria of habitability. The atmospheric water content is one of the elements that determines the environment of a planetary body. As explained in Wordsworth & Pierrehumbert(2013), vertical water distribution in terrestrial planet atmospheres is usually considered as dominated by transport phenomena from the surface up to the atmosphere where water can be photolyzed by solar UV. This transport involves a hydrogen escape and oxidation of the crust. It is, however, supposed to be limited by a cold trapping of water in the troposphere. Indeed, if the conditions of pressure and temperature are compatible, the colder upper region of the troposphere involves a condensation of water. This process traps water in the troposphere, and the atmospheric layers above are considered as dry.
The aim of this study is to experimentallyinvestigate whether atmospheric photochemistry at high altitudes could be a source of water in layers where CO2is photodissociated
(stratosphere/mesosphere) and ionized (thermosphere). We consider an early atmosphere dominated by N2 and CO2
(Marty et al. 2013), with H2 as a compliment according to
Kasting (1993) and Kuramoto et al. (2013). To address this question, we use an experimental setup called PAMPRE to study and quantify the production of water in conditions simulating the photoactive atmospheric layers of the early Earth and discuss the impact on the primitive Earth.
2. EXPERIMENTAL SETUP AND ANALYTICAL PROTOCOLS
2.1. PAMPRE Experiment
The PAMPRE experimental setup has been described in detail previously(Szopa et al.2006; Alcouffe et al.2010). It is a radio-frequency capacitively coupled plasma (RF CCP) at a low pressure. In this experiment, a discharge is generated between a polarized electrode and a cylindrical grid grounded electrode confining the plasma. Before each experiment, the reactor is heated and pumped down to 2.10−6mbar. A gaseous flow is injected continuously and pumped through a rotary vane
vacuum pump. Three gas bottles are used to generate the reactive mixture: one with a high-purity of N2(99,999%), one
containing a N2–H2mixture with 5% of H2, and one with CO2
(99,995%). The generator RF power is set to 30 W and the total gasflow rate to 55 sccm resulting in a 0.9 mbar pressure in the reactor. The initial hydrogen mixing ratio is kept constant at 4% for all experiments. This concentration is chosen in agreement with recent modeling of H2mixing ratio giving an
upper limit about 1% for the Archean atmosphere (Kuramoto et al.2013). The gas flow is adjusted from an experiment to another to introduce carbon dioxide at various mixing ratios ranging from 1% to 10%. Compositions of the different gaseous mixtures studied here are given in Table1.
First, a series of experiments is done at room temperature to monitor the CO2 consumption in the plasma by in situ mass
spectrometry. Second, in order to detect and identify gaseous species produced in low quantity, a new series of experiments is realized using cold trapping of these species on the plasma box. We used a continuous injection of liquid nitrogen (LN2)
inside the stainless-steel block supporting the grounded electrode. The plasma box is cooled by thermal conduction. The temperature is fixed at 173 K to prevent N2, H2and CO2
condensation. Products are accumulated during four hours of plasma duration. After plasma is turned off, the reactor is pumped to eliminate reactive species. The reactor is isolated and the plasma box is warmed up to room temperature to release the trapped gases. Then the gaseous phase is analyzed in situ by infrared spectroscopy.
2.2. Direct In Situ Mass Spectrometry on the Gaseous Phase In situ measurements of the gaseous phase are achieved with a Pfeiffer QME 200 quadrupole mass spectrometer. Gases are transferred to the spectrometer through a capillary tube that is long enough to keep the pressure below 10−5mbar in the spectrometer when the pressure inside the reactor is 0.9 mbar. Neutral species are ionized by electron impact at 70 eV in the ionization chamber. The resolution of the spectrometer is 100 at m/z 100 and it covers the 1–100 u mass range. Most abundant gases and only neutral stable compounds can be detected with this technique. Carbon dioxide consumption is The Astrophysical Journal Letters, 807:L29 (5pp), 2015 July 10 doi:10.1088/2041-8205/807/2/L29 © 2015. The American Astronomical Society. All rights reserved.
monitored using a time tracking of CO2+ (m/z 44) at a time
resolution of 0.5 s.
2.3. In Situ Infrared Spectroscopy on the Gaseous Phase After In Situ Cold Trapping
Gaseous species trapped during experiments are analyzed with a Thermo Scientific Nicolet 6700 Fourier Transform Infrared(FTIR) spectrometer. The infrared beam is emitted by the FTIR and passes through the reactor via two KBr windows. Then the beam is collected by a Mercury Cadmium Telluride detector cooled by liquid nitrogen. In results presented below, IR spectra are recorded in the 650–4500 cm−1 range with a resolution of 1 cm−1after a co-addition of 500 scans.
3. RESULTS AND DISCUSSIONS 3.1. CO2Consumption
The evolution of the CO2 mixing ratio when the plasma is
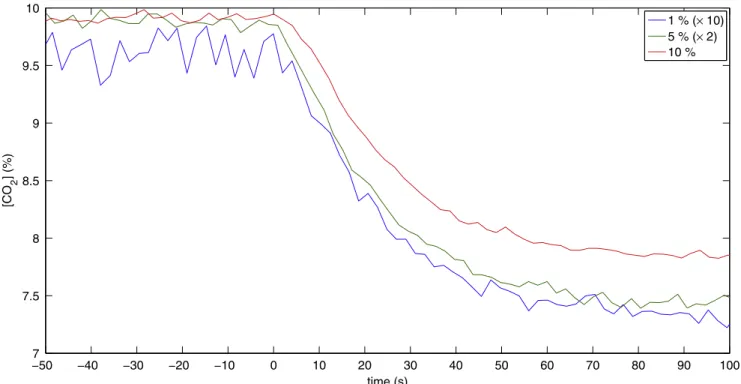
switched on is studied by in situ mass spectrometry. Figure 1 shows this evolution for three different mixing ratios: 1%, 5%, and 10%. The initial concentration of CO2is known, and it is
possible to calibrate the m/z 44 signal intensity in order to obtain the evolution of the in situ CO2 concentration. The
concentration obtained has been multiplied for 1% and 5% of CO2 by a factor 10 and a factor 2, respectively. The CO2
mixing ratio decreases when the plasma is switched on and reaches a steady-state after a transient regime.
We defined the CO2consumption efficiency e that can be
deduced from Figure1 with Equation(1):
[
]
[
]
[
]
e CO CO CO . (1) 2 0 2 ss 2 0 =-Here[CO ]2 0 and [CO ]2 ss represent the initial and steady-state
percentages of CO2, respectively. Results are presented in
Table2. The CO2consumption efficiency has the same order of
magnitude for the three initial amounts of CO2 studied. We
observed a small decrease of this efficiency for 10% of CO2
comparatively to 1% and 5% with a decrease of e from 24% to 20%.
3.2. Water Formation and Quantification
Panel(a) of Figure2presents the evolution of the pressure in the reactor during the increase of the plasma box temperature. We observe an increase of the pressure correlated to the increase of the temperature, which corresponds to the sublimation of the trapped species. The identification of the species released is performed using in situ infrared spectro-scopy. Panel (b) of Figure 2 presents two infrared spectra recorded at 173 K before the release of the species and at 294 K when the trapped species are released.
We observe an important increase of the water signature in the 1300–2000 and in the 3400–4000 cm−1ranges.
Water formation can be explained by the production of oxygen radical O(1D) by dissociation of CO2in the plasma:
e e
CO2+ -CO+O( D)1 + -. (R1) O(1D) can be also produced by the dissociative recombination of CO2+(Skrzypkowski et al.1998; Geppert & Larsson2008):
e e
CO2 + -CO2++2 - (R2)
e
CO2++ -CO+O( D).1 (R3)
Then O(1D) can react with H2to from OH radical:
H2+O( D)1 OH+H. (R4)
Finally OH induces the formation of H2O by the following
reactions:
H2+OH H O2 +H (R5)
2OHH O2 +O. (R6)
This is in agreement with the modeling of the electron energy distribution functions(EEDF) in our plasma discharge. Indeed, the calculated EEDF realized in pure nitrogen presents a maximum at 2 eV and a relatively populated tail for electron energy above 4 eV (Alves et al. 2012). Thus, the plasma produces electrons with enough energy to produce the above Reactions(R1).
Since H2O has absorption bands without overlap of other
species, it is possible to estimate its concentration using the Beer–Lambert law where the absorbance A(λ) at a given wavelength is defined by
A( )l =e l( )´ ´l [ ],C (2) whereò(λ) is the absorption cross-section of the molecule at a given wavelength, l is the path length of the beam through the gas cell, and[C] is the concentration of absorbing molecules in the reactor: C A l [ ] ( ) ( ) . (3) l e l = ´
To calculate the concentration of H2O, we used the absorption
cross-section from the HITRAN 2008 database (Rothman et al.2009). In order to overcome the difference of resolution between the database and laboratory data, we calculate the concentration on the area of the bands. For H2O, integration is
performed both in the 1300–1600 and in the 3400–4000 cm−1 ranges. Knowing the volume of the reactor, we calculate the number of molecules of water NH O2 trapped over four hours.
Knowing the gas flow of CO2injected in the reactor and the
consumption efficiency of CO2 for each CO2initial amounts,
we determine the number of CO2molecules consumed in a four
hour duration of the plasma. The consistent values of NH O2
obtained for the two ranges are averaged and reported in Table 2 for each CO2 initial amount, such as the number of
CO2molecules consumed, NCO2.
We observe an important water net production despite a competitive destruction by plasma bombardment resulting from a stationary equilibrium between loss and production pathways in the reactive medium. Table2shows an increase, by a factor of two of the number of water molecules produced in the Table 1
Composition of the Studied Gaseous Mixture
Mixture [N2]0(%) [CO2]0(%) [H2]0(%)
1 95 1 4
2 91 5 4
3 86 10 4
plasma when the CO2 initial amount increases from 1% to
10%. This is in good agreement with the increase of the number of CO2molecules consumed in the plasma, which is
multiplied by a factor of three. There is a direct correlation between the quantity of CO2 consumed and the quantity of
water produced in agreement with the water formation pathways.
We have first experimentally evidenced that such a water formation could take place in the early Earth’s stratosphere from neutral photochemistry and in the ionosphere where O (1
D) would issue of the dissociative recombination of CO2+.
This is compatible with solar flux on the early Earth’s atmosphere where a high photon flux in VUV is presumed (Claire et al. 2012). H2O is expected to be competitively
dissociated by VUV photons, but the efficiency of the production process could ensure a significant stationary water concentration in the atmosphere of the early Earth.
4. IMPACT FOR THE EARLY EARTH 4.1. Water Content in the Early Earth’s Atmosphere We have experimentally highlighted a source of water located in higher atmospheric layers of the early Earth where CO2 is photodissociated. We provide here a first order
estimation of the water concentration in the atmosphere
considering this new mechanism. The pressure level of present day Earth’s stratopause is chosen as a benchmark for the calculation.
Water concentration is driven by the competition between the production rate(ProdH O2 ) and the destruction rate (LossH O2 ),
ProdH O2 =LossH O2 . (4) Above the stratopause, we roughly assess that the production of H2O is limited by the CO2 photodissociation rate, which
provides the reactive oxygen atoms. Nowadays, JCO2 is about
10−10s−1. A model study has shown that during the Archean,
JCO2 was equal to twice the actual value with a constant value
from the stratopause to the atmospheric layers above (Claire et al.2012). At the stratopause, following the study of Kasting
(1993), the partial pressure of CO2 is about 0.1 mbar,
corresponding to a concentration of 1015molecules cm−3. We can deduce the production rate of H2O at the stratopause:
[
]
J
ProdH O2 = CO2´ CO .2 (5) The resulting production rate of H2O is about
105molecules cm−3s−1.
The destruction of H2O is equal to the product between the
water concentration and the photochemical rate constant, which is the inverse of the lifetime of water(tH O2 ):
(
)
[
]
LossH O2 = H O2 ´ 1 tH O2 . (6) The water concentration is deduced by combining Equa-tions(4)–(6):
[
H O2]
=ProdH O2 ´tH O2 . (7) For a water lifetime of about one day (J. F. Kasting 2015, private communication), a concentration of 1010molecules cm−3 is obtained, corresponding to a partial Figure 1. Evolution of CO2mixing ratio in the gaseous reactive medium with the plasma duration. Origin of time is set as the moment when the plasma is turned on.CO2mixing ratio has been multiplied by a factor 10 and a factor 2 for an initial amount of 1% and 5%, respectively.
Table 2
Evolution of the CO2Consumption Efficiency e, the Number of the CO2
Molecules Consumed NCO2, and the Mean of H2O Molecules Formed in Four
Hours of Plasma Duration NH O2 , as a Function of the Initial CO2Amount
[CO ]2 0(%) e(%) NCO2(Molecules) Mean NH O2 (Molecules)
1 24± 2 (3 ± 1) × 1024 (2.1 ± 0.1) × 1020 5 24± 0.6 (4 ± 1) × 1024 (3.1 ± 0.1) × 1020
pressure of water∼10−6mbar. This rough calculation informs us on the efficiency of the process with a water value as important at the stratopause(∼50 km) as the ones predicted at the tropopause (∼10 km) in Kasting (1993) without this source.
4.2. Formation of High Altitude Clouds
In a CO2-rich atmosphere the average temperature at the
stratopause level is expected to be close to the planetary skin temperature, around 200 K (Kasting 1988), or even below. These low temperature and pressure conditions should result in the solid condensation of any produced water vapor, were the temperature to fall below ∼170 K. This would lead to the formation of high altitude water ice clouds, analogous to the present day polar mesospheric clouds (PMC; DeLand et al. 2006; Pérot et al. 2010; Määttänen et al.2013) whose formation is known to be favored by local production from the methane oxidation (Thomas et al. 1989) or analogous to the present day Polar Stratospheric Clouds (PSC; Lowe & MacKenzie 2008) if the water production takes place at relatively low altitudes.
These clouds are usually optically thin, but could never-theless alter Earthʼs radiation budget in both visible (raising the albedo) and thermal IR radiation (through backscattering of thermal IR radiation), making predictions of their exact influence on the early Earthʼs climate hard to assess without proper microphysical and radiative modeling, which is beyond the scope of this paper.
These clouds can influence the atmospheric chemistry of the early Earth. Indeed, they are known to play an important role in planetary atmospheres. In the Martian atmosphere, water ice clouds have been found to directly influence the ozone concentration; in the absence of clouds, OH radicals titrate ozone, whereas heterogeneous chemistry of those radicals on water ice clouds enable ozone transient productions (Lefevre
et al.2008). Similarly in the present Earth’s atmosphere, PSC are involved in the stratospheric O3 destruction (Lowe &
MacKenzie2008).
4.3. Effect on the Water Atmospheric Profile
The local extra greenhouse effect of this produced water vapor at stratopause level is almost certainly negligible due to the very low thermal IR opacity of the atmosphere at such low pressures. However, if some water could reach the denser and optically thicker layers at the tropopause level (whether by direct mixing, or sedimentation and sublimation of the aforementioned PMC), possible radiative impacts could be (1) a local cooling of the stratosphere since the extra water vapor is a very effective thermal IR radiator—that is, assuming that a positive temperature anomaly would exist in the first place in an already CO2-rich atmosphere; and (2) a slight
increase of the greenhouse (∼0.1 K assuming a vertically uniform H2O mixing ratio above the tropopause), effectively
moving the tropopause slightly upwards(on the order of a few tens of meters).
If water production above the stratosphere has a negligible effect on climate, it still impacts the whole atmosphere through chemistry and transport processes. This has been learned with the case of Titan, the largest satellite of Saturn. This object is being observed by the Cassini–Huygens mission that has highlighted the importance of ionospheric chemistry for the production of organic aerosols, impacting the entire atmosphere (Waite et al.2007). For the early Earth, the presence of water at high altitudes can sensibly modify the concentration of all the other trace species, as H2O is known to be a very reactive
species at these altitudes. For example, H2O can be a source of
NH radicals through its reaction with N(2D), produced by photodissociation of N2 at these altitudes (Dobrijevic
et al. 2014). Consequences on ammonia NH3 concentration
Figure 2. Evolution of the pressure in the reactor during the warm up of the plasma box (on the left) and the evolution of the infrared signature of the gaseous phase in the reactor with an important release of water(on the right).
in the upper atmosphere of the early Earth can therefore be expected.
5. CONCLUSION
This work presents afirst experimental study of the reactivity of the early Earth’s atmosphere. We used an internal cold trap to analyze the composition of the gaseous phase with a focus on the production of water vapor.
Water is the main product detected in situ by infrared spectroscopy. The evolution of the quantity of water produced as a function of the initial amount of CO2has been studied. The
quantity of water produced increases by a factor of two when the initial amount of CO2increases from 1% to 10%.
The important production of water is explained by the production of O(1D) radicals by both neutral and ionic pathways. This production highlighted experimentally breaches our knowledge of the Earthʼs primitive atmosphere where the atmosphere above the troposphere was generally considered as dry, with a sole tropospheric source.
This important production of H2O would involve a
modification of the water mixing ratio profile with an increase of the water content above the troposphere. Chemistry in these upper atmospheric layers has therefore to be revisited. The increase of the water content in the stratosphere and meso-sphere could notably result in the formation of high altitude clouds similar to actual PSC and PMC, whose major impact would be the development of heterogeneous processes and chemistry. Further modeling studies are required to conclude on the overall chemical and climate resulting impact of such a water source above the troposphere.
B. F. acknowledges the Île-de-France region(DIM ACAV) for his thesis funding. The authors also wish to thank J. F. Kasting for his precise comments during the review process that led to significant improvements to this paper.
REFERENCES
Alcouffe, G., Cavarroc, M., Cernogora, G., et al. 2010,PSST,19, 015008
Alves, L. L., Marques, L., Pintassilgo, C. D., et al. 2012,PSST,21, 045008
Claire, M. W., Sheets, J., Cohen, M., et al. 2012,ApJ,757, 95
DeLand, M. T., Shettle, E. P., Thomas, G. E., & Olivero, J. J. 2006,JASTP,
68, 9
Dobrijevic, M., Hébrard, E., Loison, J. C., & Hickson, K. M. 2014,Icar,
228, 324
Geppert, W. D., & Larsson, M. 2008,MolPh,106, 2199
Kasting, J. 1993,Sci,259, 920
Kasting, J. F. 1988,Icar,74, 472
Kuramoto, K., Umemoto, T., & Ishiwatari, M. 2013,E&PSL,375, 312
Lefevre, F., Bertaux, J.-L., Clancy, R. T., et al. 2008,Natur,454, 971
Lowe, D., & MacKenzie, A. R. 2008,JASTP,70, 13
Määttänen, A., Pérot, K., Montmessin, F., & Hauchecorne, A. 2013, in Comparative Climatology of Terrestrial Planets, ed. S. J. Mackwell et al. (Tucson, AZ: Univ. Arizona Press),393
Marty, B., Zimmermann, L., Pujol, M., Burgess, R., & Philippot, P. 2013,Sci,
342, 101
Pérot, K., Hauchcorne, A., Montmessin, F., et al. 2010, ACP,10, 2723
Rothman, L. S., Gordon, I. E., Barbe, A., et al. 2009,JQSRT,110, 533
Skrzypkowski, M. P., Gougousi, T., Johnsen, R., & Golde, M. F. 1998,JChPh,
108, 8400
Szopa, C., Cernogora, G., Boufendi, L., Correia, J. J., & Coll, P. 2006,P&SS,
54, 394
Thomas, G. E., Olivero, J. J., Jensen, E. J., Schroeder, W., & Toon, O. B. 1989, Natur,338, 490
Waite, J. H., Young, D. T., Cravens, T. E., et al. 2007,Sci,316, 870