HAL Id: insu-01733635
https://hal-insu.archives-ouvertes.fr/insu-01733635
Submitted on 14 Mar 2018
HAL is a multi-disciplinary open access
archive for the deposit and dissemination of
sci-entific research documents, whether they are
pub-lished or not. The documents may come from
teaching and research institutions in France or
abroad, or from public or private research centers.
L’archive ouverte pluridisciplinaire HAL, est
destinée au dépôt et à la diffusion de documents
scientifiques de niveau recherche, publiés ou non,
émanant des établissements d’enseignement et de
recherche français ou étrangers, des laboratoires
publics ou privés.
Effect of fluid viscosity and saturation on the ultrasonic
velocities in a Fontainebleau sandstone
Azar Khalatbari, Dung Vo-Thanh, Jean-Paul Poirier
To cite this version:
Azar Khalatbari, Dung Vo-Thanh, Jean-Paul Poirier. Effect of fluid viscosity and saturation on the
ul-trasonic velocities in a Fontainebleau sandstone. Geophysical Research Letters, American Geophysical
Union, 1991, 18 (5), pp.885-888. �10.1029/91GL01067�. �insu-01733635�
GEOPHYSICAL RESEARCH LETTERS, VOL. 18, NO. 5, PAGES 885-888, MAY 1991
EFFECT OF FLUID VISCOS!TY AND SATURATION ON THE ULTRASO•C VELOCITIES ]N A FONTAINEBLEAU SANDSTONE
Azar Khalatbari, Dung Vo-Thanh and Jean-Paul Pokier
D•partement des G•omat•riaux, Institut de Physique du Globe de Paris, France Ab
t._jJ_rg_•. Simultaneous measurements of the P- and S- wave velocities at 1MHz frequency as a function of
temperature
from - 80øC to 80øC have
been
made
in a
Fontainebleau sandstone saturated with glycerol. We
investigated 8 saturation degrees, from fully saturated to almost dry state. Generally, the velocity decreases with increasing temperature; it is large between = - 40øC and =
40øC. The velocity dispersion is attributed to viscous shear relaxation. The model of O'Connell and Budiansky modified by introducing the saturation parameter and a Gaussian distribution of crack aspect ratios is used to interpret the data, A trial and error method is used to estimate the model parameters. The model satisfactorily accounts for the data at high saturation.
Introduction
The laboratory measurements of the P- and S-wave velocities in rocks are important as tools for obtaining detailed
information about the subsurface from seismic data. In order
to give a lithological and petrophysical interpretation of
seismic data, it is interesting to explore the control factors and to understand the physical laws which govern the variation of elastic parameters.
Waves propagating through a rock sample are sensitive
to numerous factors; among them, the fluid viscosity plays a
dominant role on the attenuation and velocity in glycerol saturated Barre granite at 0.5 MHz frequency (Nur and Simmons, 1969) and in sandstones in the KI-Iz frequency range (Tittmann et al., 1984; Vo-Thanh, 1990 and 1991). In this paper, we investigate the influence of fluid viscosity and
saturation state on the P- and S-ultrasonic wave velocities in a
Fontainebleau sandstone saturated with g!ycerol. The change
of viscosity is made by varying the temperature from- 80øC
to 80øC.
It is generally accepted that the dominant mechanism
responsible for seismic-wave attenuation and velocity
dispersion is local fluid flow (squirt flow at low frequency and viscous shear relaxation at high frequency). The viscous shear relaxation mechanism proposed by O'Connell and Budiansky (1977) is used to interpret our results. By introducing the saturation parameter and using a Gaussian distribution of crack aspect ratios, we numerically calculated the bulk and shear modulus of saturated rocks. We used a trial and error method (Tarantola, 1987) to estimate the crack density e, the central aspect ratio c• o of cracks and the standard deviation c• of the Gaussian distribution of crack aspect ratios
Experimental Method
The measurements were performed using a classical pulse uansmission technique. Figure ! shows the experimental set- .up comprising the sample, two aluminum buffers and two
mentical 1 MHz PZT shear-transducers. The best coupling
was obtained by glueing the aluminum buffers to the sample
Copyright 1991 by the American Geophysical Union.
Paper number 91GL01067 0094-8534 / 91 / 91GL-01067 $03.00 thermocouple 4::' S - transdu ., ! cm SAMPLE A1 - buffer
Fig.! Experimental set-up for ultrasonic velocity
measurements.
with a thin layer of Armstrong A 271 glue, and to the
transducer, with a thin layer of Getelec 12008 silver epoxy
resin.
The input signal was delivered by a Panametrics 5052 PR pulse generator. The transit times of the S-wave and of the S converted to. P-wave were directly measured on the screen of
the
Tektronic
2445
A oscilloscope
by two cursors.
Thus,
V!?
and Vs can simultaneous be determined in identicat experimental conditions using a pair of S-transducers only.
One cylindrical sample of a Fontainebleau sandstone (40 mm in diameter and 35 mm in length) was used in this study.
It is a very pure (>99% quartz) clay-free sandstone
composed of well-rounded quartz grains, about 0.25 mm in diameter, cemented by silica. Its open porosity, measured by water saturation under vacuum, was about 5%. Its permeability, measured using an air permeameter, was less
than lmD. An epoxy resin replica of the pore space was observed'in Scanning Electron Microscopy (Figure 2) revealing the highly interconnected nature of the pore space.
Fig. 2 Scanning electron micrograph of the epoxy pore cast of a Fontainebleau sandstone. Porosity is in the form of flat intergranular cracks and pores at the triple junctions.
The sample was first oven-dried for at least 48h at 70øC, cooled to room temperature and placed in a container under dynamic vacuum (0.01 torr) for 5h. The container was then filled with distilled glycerol (Pro!abo, ref. 24 388.320) and kept in the oven at 70øC for 12h, allowing air bubbles to escape; it was then cooled to room temperature, completely filled with glycero!, closed shut and heated again to 70øC for
12h to build up some pressure (about 40 bar). The sample
was then cooled down, jacketed with teflon tape and transferred to the measurement apparatus. After the velocity measurements at full saturation, the unjacketed sample was
placed in the oven at 70øC for several days, reducing the
saturation state, until the required saturation level was
obtained. Knowing the porosity, the glycerol saturation S
was calculated from the saturated and dry weights. The
velocities were measured again. The process was repeated 8
886 Khalatbari et al.- Ultrasonic velocities in saturated Fontainebleau sandstone.
times, progressively bringing the sample from fully saturated
to almost dry state.
The experiments were performed by increasing the temperature from - 80øC to 80øC at a given glycerol saturation S. G1ycero1 evaporation is negligible, less than 1%, during the experiment. The viscosity of glycero! strongly varies with
temperature,
from = 109
poise
at - 80øC
to = !0 -1 poise
at
100øC (Figure 3, data from Weast, !967). Each measurement was taken when thermal equilibrium has been obtained in the vessel, containing the sample placed inside a thermally
isolated cylindrical metallic tubing. Temperatures were measured using two copper-constantan thermocouples glued to the aluminum buffers, near the sample surface (Figure 1).
log •/(Poise) 1c ß 8- ß ß 4 e. 2L- '. e e e O' ß
-2 -. I
-90 -50 -10! ,.3
• , I .... •
0 70 110 T*CFig. 3 Temperature dependence of glycerol viscosity (data from Weast, 1967).
The temperature gradient between the two ends of the sample was less than IøC. The low temperatures were obtained by running liquid nitrogen and the high temperatures by winding a resistance heater around the metallic tubing.
The length of the sample was measured to within 0.02 min. The signal was good at low temperature and at high saturation, it progressively degraded with increasing temperature and decreasing saturation. The transit time was measured on the screen of the scope with an accuracy better than 0.2 gs. it was corrected of the transit time in the
aluminum buffers. The wave velocities were then known to
within about 50m/s - 150m/s, depending on the temperature and saturation degree.
Experimental Results
Results
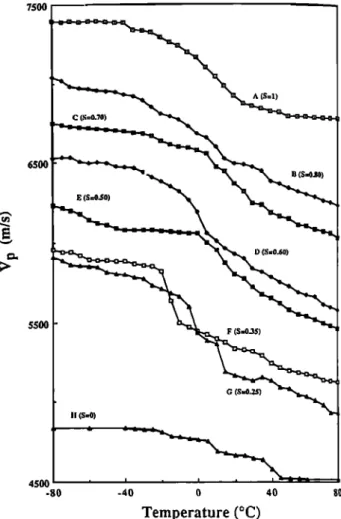
Curves A, B, C, D, E, F, G and H of Figures 4 (for V )
and
5 (for
Vs)
correspond
to saturation
degrees
S=!,
0.•,
0.7, 0.6, 0.5, 0.35, 0.25 and almost 0, respectively.
Generally,
we observe
that
the shapes
of Vp T f(T) and
Vs =
f(T) curves are almost the same for various saturation degrees. The velocities decrease as temperature increases. The decrease is not monotonous; it is small at low temperatures,
from - 80øC to = - 40øC, and at high temperatures, from =
40øC to 80øC; it is large between = - 40øC and = 40øC. The difference of the limiting velocities (between - 80øC and 80øC)
decreases as saturation decreases.
For "dry" sample, V v decreases from • 4800 m/s at -80øC
to = 4500 m/s at 80øC'(Figure 4H). In this experiment, the "dry" sample was obtained after drying the pore glycerol by heating. Small amount of glycerol undetectable by weighing may still remain in the sample, especially in cracks; this may
explain
the
relatively
large
variations
of Vp and
Vs (Figures
4H and 5H). In fact, the measurements m an another dry
sample of the same Fontainebleau sandstone (Khalatbari, 1989) show that Vp linearly decreases by about 50 m/s in the
same temperature range.
Discuss.io..n
Numerous loss mechanisms are proposed for saturated rocks. Among them, the solid-fluid inertial coupling (Biot,
7500 C (S=0.70) 65OO 55OO E (S=0J0) n D (S--0.60) F (S=0.35) !l G 4500 -80 -40 0 40 80 Temperature (øC)
Fig. 4 Compressional velocity measured as a function of temperature in Fontainebleau sandstone saturated with glycerol. Each curve corresponds to a given saturation S. The velocity origin is for the "dry" sample (curve H); the origin of
each adjacent curve is shifted by 200 m/s.
1956a, 1956b) and the local flow (squirt flow at low frequency and viscous shear relaxation at high frequency) principally developed by O'Connell and Budiansky, 1977,
are usually cited as two possible mechanisms.
The characteristic frequency fc of the solid-fluid inertial
coupling mechanism is given by
fc = ß (1)
2•cpf
where 11 and pf are the viscosity and density of pore fluid, • and ,r are the porosity and permeability of the rock sample (Bourbi6 et al., 1986). fc • 240 MHz in our Fontainebleau
sandstone
at 80øC
where
the glycero1
viscosity
q z 0.3
poise. It is obvious that fc > 240 MHz when T < 80øC.
According
to Blot
(1956a),
Vp and
Vs are
constant
when
the
glycero1 viscosity varies between - 80øC and 80øC beeuse the
wave
frequency
(1 MHz) is too small
in comparison
with
re.Therefore, Biot's solid-fluid inertial coupling cannot
account for our observations.
In the local flow model (O'Conne11 and Budiansky, 1977) the characteristic viscosity-frequencies rlO)l of the squirt flow and rio)2 of the viscous shear attenuation peaks are
approximately given as
Khalatbari et al.: Ultrasonic velocities in saturated Fontainebleau sandstone. 887
"I
:'t
...
p
(s•)
• I•r
I • I ! I1
•
i •
...
10; • (Hz-•oisc) Io; • (Hz-poisc)
c(•.o.•0)
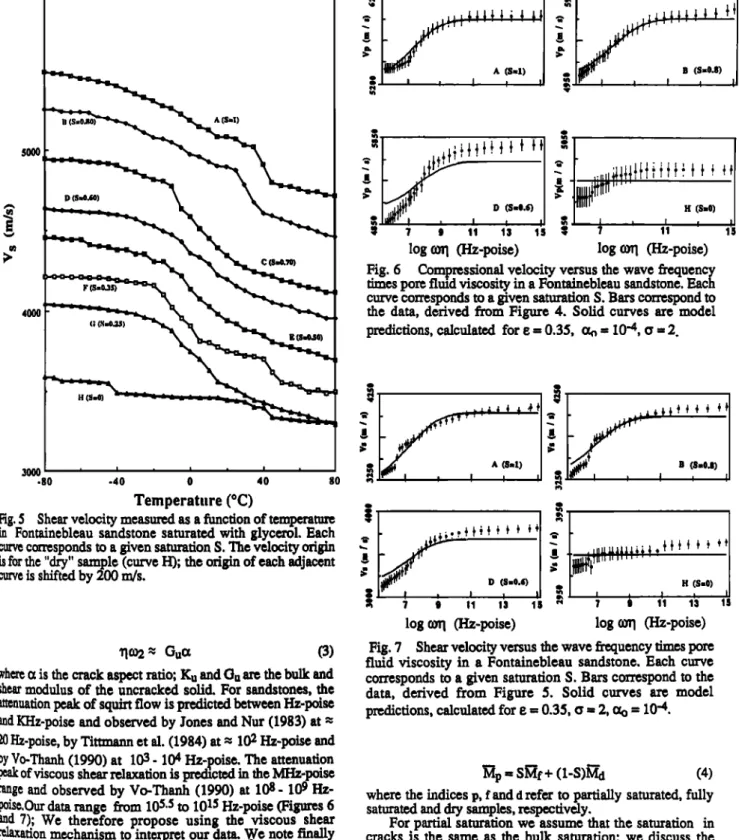
Fi;. 6 Comp•ssion•
Ycl•i• Ycrsus
•c waYc
•cqucncy
;(s.0• •cs pore fluid •scosi• in a Fon•cblcau s•dstonc. Eachc•c co•csponds to a •Ycn satedon S. B•s co•cspond to
4• •c dam, ticdYed •om Fi•c 4. Solid cu•cs •c model
"•)
pre•c•ons,
c•culat• for e = 0.3•, • = I0 •, o = 2.
II (•-0) ,]000 i ,, i , ß 80 -40 E (s•).so) , . , , ... • B (S,,,0.8)
o
40
•o •
•
....
!
.
-
. .
:
. ... . •
I H (S,.O)
•
? ,
11 13 1S r,
7 • 11 13 1S
Temperature (øC)Fig. $ Shear velocity measured as a function of temperature in Fontainebleau sandstone saturated with glycerol. Each curve corresponds to a given saturation S. The velocity origin is for the "dry" sample (curve H); the origin of each adjacent
curve is shifted by 200 m/s.
log a•] (Hz-poise) log a• (Hz-poise)
•!• '• Oucz (:3)
where a is the crack aspect ratio; Ku and Gu are the bulk and shear modulus of the uncracked solid. For sandstones, the
attenuation peak of squirt flow is predicted between Hz-poise and KHz-poise and observed by Jones and Nut (1983) at •
20
Hz-poise,
by Timann et al. (1984)
at z 102
Hz-poise
and
by
yo-Thanh
(1990)
at 103
- 104
Hz-poise.
The
attenuation
peak of viscous shear relaxation is predic• in the MHz-poise
range
and
observed
by Vo-Thanh
(1990)
at 10S
- 109
Hz-
poise,
Our
data
range
from 105.2
to 1015
Hz-poise
(Figures
6
and 7); We therefore propose using the viscous shear relaxation mechanism to'inte' rpret our data. We note finally
'that,
between
- 77øC
and
100•C
and
using
almost
the same
experimental method, Nur and Simmons (1969) observed a
large
dispersion
of Vp
and
Vs
near
tl • 0.5
poise
in Barre
granite
saturated
with glycerol.
They suggested
that the
viscous
shear
relaxation
mechanism
proposed
by Walsh
(1969)
is the
origin
of the
velocity
dispersion.
Viscoelastic Model
if a [raction
S of cracks
is saturated,
the
complex
elastic
?d.
uli Pip
in partially
saturated
rocks
can
be written
as
tuudiansky
and
O'Connell,
1976)
Fig. 7 Shear velocity versus the wave frequency times pore fluid viscosity in a Fontainebleau sandstone. Each curve corresponds to a given saturation S. Bars correspond to the data, derived from Figure 5. Solid curves are model
predictions,
calculated
for e = 0.35,
• = 2, ao = 10
'4.
= sif + (1-S)d
(4)
where the indices p, f and d refer to partially saturated, fully saturated and dry samples, respectively.
For partial saturation we assume that the saturation in
cracks is the same as the bulk saturation; we discuss the
validity of this assumption later.
As pointed out, the velocity dispersion observed in glyeerol saturated sandstone (Figures 4 and $) is attributed to
viscous shear relaxation. The contribution of squirt flow is
therefore ignored in the present paper.
The
bulk
Kp and
shear
GP.
moduli
in partially
saturated
rocks for viscous shear relaxation are given by
[P f 16(X'v2)
- = s+o-s) ...e]
888 Khalatbari et al.' Ultrasonic velocities in saturated Fontainebleau sandstone.
... C +(l-S) -• . ... 15(2- v') 45(2- v)
(6)
where e is the crack density of the sample; v, v' and C are functions of S, e, •1, o)2, Op, Gu, the angular wave frequency c0 and the Poisson's ratio of the uncracked solid Vu (O'Connell and Budiansky, 1977).
Discrete characteristic frequency would not be expected in rocks, owing to variability in crack shapes and widths and to
various interconnections between cracks. A logarithmic Gaussian distribution F(a) of crack aspect ratios may be
appropriate in many cases ( cf. Nowick and Berry, 1972)
1 (log c• - log ao)
F(c0
= c•-•
exp
... (7)
where ct o is the central aspect ratio of cracks and (• is the
standard deviation of the distribution of crack aspect ratios.
The real parts of the effective moduli in partially saturated
rocks can be written as
<Gp>
= fF() Gp(C•)
do•
(8)
-_ fFca)
Kp(e0
dc•
(9)
Interpretation of the Results
To estimate the three model parameters e, c• and c•o we used a trial and error method (Tarantola, 1987) in order to minimize the cost function D(S), defined as
(Vexp
- Veal)
2
D(S) = Z ... •
m
(Sexp)
2
(!o)
where Vexp and Vcal are the experimental and calculated velocities, respectively, and •exp is the experimental error. 8cxp increases with decreasing saturation and increasing te,nperature. The three-parameter space e ( 0 < e < 0.56), ao (
10
'6 < Oto
< 10
-1) and
c• ( 0 < c• < 3) was systematically
explored.
The crack density, the central aspect ratio of cracks and the
standard deviation of the distribution of crack aspect ratios found for the sample are œ • 0.35, ao • 10 '4 , • -- 2, respectively. These values minimize the D(S) functions. They ra'e consistent with the SEM observation of the replica (Figure
2). Flat intergranular cracks account for the narrow
distribution (• -- 2) and low crack aspect ratio (c•o = 10'4). Using these estimated parameters we recalculate Vp and Vs from Equations (8) and (9). Figures 6 and 7 show the comparison between data, derived from Figures 4 and 5, and calculations for Vp and Vs as a function of rlC0 at S = 1, S = 0.8, S = 0.6, and S = 0, respectively. The agreement is good
at high
saturation;
the
divergence
increases
with decreasing
sataration. This is because the global saturation in the rock
sample
is probably
not representative
of that
in cracks.
I•
fact, the reduction in saturation is performed by heating which favors the evaporation in large pores over that in cracks because of the capillary forces in cracks. The saturation in
cracks is then underestimated.
Ac..kn0wleclgments,. We gratefully acknowledge the invaluable help that Bernard Zinszner and the I. F. P. laboratory of Rock Physics gave us in the course of this
work. 1PG contribution N ø 1167. References
Blot, M. A., Theory of propagation of elastic waves in a fluid-saturated porous solid; i. Lower frequency range, • Acoust. Soc. Am. • 168-178, 1956a.
Blot, M.A., Theory of propagation of elastic waves in a fluid. saturated porous solid; II. Higher frequency range, J. AcoaSt. Soc, Am., • 179-191, 1956b.
Bourbi•, T., Coussy, O., and Zinszner, B., Acoustioue des
milieux poreux, 339pp., Technip, Paris, 1986.
Budiansky, B., and O'Connell, R.J., Elastic moduli of a cracked solid, Int. J. Solids Str•ctures. 12. 81-97, 1976.
Jones, T. D., and Nut, A., Velocity and attenuation in sandstone at elevated temperatures and pressures,
Geophys. Res, Lett ... 10, 140-143, 1983.
Khalatbari, A., Etude de rinfluence du fluide saturant sur la viresse des ondes ultrasonores dans les gres, PhD thesis, 149pp., Univ. of Paris 7, June 1989.
Nowick, A. S., and Berry, B. S.; Ane!..astic ..relaxation in crystalline solids, Academic Press, Inc., 1972.
Nut, A., and Simmons, G., The effect of viscosity of a fluid phase on velocity in low porosity rocks, Earth Planet. S½i, Lett. 7.99-108, 1969.
O'Connell, R. J., and Budiansky, B., Viscoelastic properties of fluid-saturated cracked solids, J. Geophys.
Res., • 57 !9-5736, 1977.
Tarantola, A., Inverse problem theory. Methods for data
fitting and model parameter estimation, 613 pp., Elsevier, Amsterdam, 1987.
Tittmann, B. R., Bulau, J. R., and Abel-Gawad, M., The role of viscous fluids in the attenuation and velocity of elastic waves in porous rocks, in Physi• and chemistry of porous media, edited by Johnson, D. L., and Sen, P.-N., pp. 131-143, Am. Inst. of Physics, 1984.
Vo-Thanh, D., Effects of fluid viscosity on shear-wave attenuation in saturated sandstones, Geophysics. • 712- 722, 1990.
Vo-Thanh, D., Effects of fluid viscosity on shear-wave attenuation in partially saturated sandstone, Geophysic•
in press.
Walsh, J. B., New analysis of attenuation in partially melted
rock, •, Geophys. Res,, • 4333-4337, 1969.
Weast, R.C., .Handbook of chemistry and physics. F-1 ! and F-35, The Chemical Rubber Co., 1967.
.
A. Khalatbari, D. Vo-Thanh and J.P. Pokier, Dtpartement des G6omattriaux, Institut de Physique du Globe, 4, place Jussieu, 75252 Paris Cedex 05 (France).
(Received December 13, 1990; revised March 11, 1991; accepted March 18, 199 !.)