HAL Id: hal-03093209
https://hal.archives-ouvertes.fr/hal-03093209
Submitted on 3 Jan 2021HAL is a multi-disciplinary open access
archive for the deposit and dissemination of sci-entific research documents, whether they are pub-lished or not. The documents may come from teaching and research institutions in France or abroad, or from public or private research centers.
L’archive ouverte pluridisciplinaire HAL, est destinée au dépôt et à la diffusion de documents scientifiques de niveau recherche, publiés ou non, émanant des établissements d’enseignement et de recherche français ou étrangers, des laboratoires publics ou privés.
Low hydrogen concentrations in Dharwar cratonic
lithosphere inferred from peridotites, Wajrakarur
kimberlites field: Implications for mantle viscosity and
carbonated silicate melt metasomatism
Jiten Pattnaik, Sylvie Demouchy, Sujoy Ghosh
To cite this version:
Jiten Pattnaik, Sylvie Demouchy, Sujoy Ghosh. Low hydrogen concentrations in Dharwar cratonic lithosphere inferred from peridotites, Wajrakarur kimberlites field: Implications for mantle viscosity and carbonated silicate melt metasomatism. Precambrian Research, Elsevier, 2021, 352, pp.105982. �10.1016/j.precamres.2020.105982�. �hal-03093209�
Low hydrogen concentrations in Dharwar cratonic lithosphere inferred
1from peridotites, Wajrakarur kimberlites field: Implications for mantle
2viscosity and carbonated silicate melt metasomatism
34
Jiten Pattnaik1, Sylvie Demouchy*2, Sujoy Ghosh1 5
6
1. Department of Geology and Geophysics, Indian Institute of Technology Kharagpur, Kharagpur-721302, West
7
Bengal, India.
8
2. Géosciences Montpellier, Université Montpellier & CNRS, 34095 Montpellier, France.
9 10 11
Accepted for publication in Precambrian Research
12
Cite as Pattnaik, J., Demouchy S., Ghosh, S.K., (2021) Hydrogen concentrations in mantle
13
xenoliths and minerals from Wajrakarur kimberlite field, Eastern Dharwar Craton, India.
14
Precambrian Research, 352, 105982. https://doi.org/10.1016/j.precamres.2020.105982
15 16 17 18 19 20 * corresponding author 21 Dr. Sylvie Demouchy 22 Geosciences Montpellier 23
Univ. Montpellier & CNRS 24 Place E. Bataillon 25 34 000 Montpellier 26 France 27 sylvie.demouchy@umontpellier.fr 28 29 30
Abstract
31
Hydrogen as an atomic impurity in mantle minerals is recurrently proposed as a key element impacting
32
significantly on many mantle properties and processes such as melting temperature and mechanical
33
strength. Nevertheless, interpretation based on the natural samples remains weak as we do not have yet
34
a robust world-wild database for hydrogen concentrations in mantle minerals and rocks. Here, we report
35
the first hydrogen concentrations in nominally anhydrous minerals from a rare selection of ultramafic
36
rocks and minerals embedded in Mesoproterozoic Wajrakarur kimberlites (Eastern Dharwar craton,
37
India). Based on key chemical elements, we demonstrate that olivine, pyroxenes and garnet from the
38
Dharwar craton are of mantle origin. We quantify the hydrogen concentrations using Fourier transform
39
infrared spectroscopy (FTIR) and mineral-specific FTIR calibrations. Calculated hydrogen
40
concentrations are, in average, 18 ppm wt H2O in olivine, 70 ppm wt H2O in orthopyroxene and 207 41
ppm wt H2O in clinopyroxene. Garnet has highly variable hydrogen concentration ranging from 0 to 42
258 ppm wt H2O, probably influenced by nano-scale inclusions. The average of clean garnet spectra 43
yields 14.5 ppm wt H2O. The reconstructed hydrogen bulk concentrations of Dharwar peridotites yields 44
40#$%&' ppm wt H
2O. This value is two to five times lower than the estimated hydrogen concentration in 45
the lithospheric mantle, and agree well with the lower range of hydrogen bulk concentration from the
46
current data base for the upper mantle minerals transported by kimberlites from other cratons (e.g., South
47
Africa, Siberia). The low hydrogen concentration in mantle minerals, together with petrological and
48
geochemical evidence of carbonated silicate melt metasomatism in Dharwar cratonic lithospheric
49
mantle, suggest that these xenoliths are possibly related to proto-kimberlite melts with low water activity
50
prior to being transported to the surface by the Mesoproterozoic Wajrakarur kimberlites. These
51
observations, valid to a depth of ~165-km, suggest that cratonic lithosphere beneath the Dharwar craton
52
may not be particularly indicative of an abnormal hydrogen-rich southern Indian lithosphere in the late
53
Archean and that hydroxylic weakening in olivine would induced a negligible effect on the mantle
54
viscosity of Indian subcontinent.
55 56
Keywords: Peridotite xenolith; Wajrakarur kimberlite; Eastern Dharwar craton; hydrogen; FTIR
1. Introduction
58
Hydrogen (H) can be embedded within the crystallographic lattice of nominally 59
anhydrous minerals (NAMs, such as olivine, pyroxenes, and garnet) as extrinsic points defects 60
(e.g., Beran and Zemman, 1969; Beran and Libowitzky, 2006). Hydrogen incorporation, even 61
at a low concentration level (expressed in part per million of water by weight in this study) is 62
known to enhance many physical and chemical properties of mantle minerals and rocks. For 63
example, a small amount of H can increase electrical conductivity (Karato, 1990; Yoshino et 64
al., 2006; Poe et al., 2010; Novella et al., 2017; Sun et al., 2019; Fei and Katsura, 2020) or 65
increase ionic diffusion of major elements in mantle minerals (e.g., Costa and Chakraborty 66
2008; Demouchy et al., 2007). Furthermore, the incorporation of H was also proposed to 67
weaken the strength of single crystal and polycrystalline olivine (e.g., Mackwell et al., 1985; 68
Hirth and Kohlstedt, 2003; Demouchy et al., 2012; Tielke et al., 2017). As a consequence, 69
distribution of H in the upper mantle minerals is repetitively proposed as a major parameter in 70
geodynamic models (e.g., Regenauer-Lieb and Kohl, 2003; Regenauer-Lieb et al., 2006; 71
Albarède, 2009; Peslier et al., 2010; Masuti et al., 2016). 72
Laboratory experiments have been crucial to understand the primary mechanisms of 73
incorporation of H in mantle silicates at point defects scale and also to quantify the ‘water 74
solubility’ in mantle minerals as a function of thermodynamic parameters (e.g., Bali et al., 2008; 75
Férot and Bolfan-Casanova, 2012; Gaetani et al., 2014; Keppler and Bolfan-Casanova, 2006; 76
Kohlstedt et al., 1996; Mierdel et al., 2007; Mierdel and Keppler, 2004; Padrón-Navarta and 77
Hermann, 2017). Although, it has long been known that almost all natural NAMs contain 78
variable amounts of H in their structures (Beran and Libowitzky, 2006; Litasov et al., 2007; 79
Skogby, 2006). Furthermore, the systematic characterization and quantification of H 80
concentrations in upper mantle minerals from mantle peridotites of different geological settings 81
have been explored in the last two decades (see Peslier, 2010; Demouchy and Bolfan-Casanova, 82
2016 for reviews). Mantle xenoliths and large phenocrysts hosted by kimberlites in cratonic 83
settings have received most of the attention regarding their H concentrations (e.g., Bell and 84
Rossman, 1992a; 1992b; Bell et al., 2004; Grant et al., 2007; Peslier et al., 2008, 2010, 2012; 85
Baptiste et al., 2012), with undeniable popularity for the Kaapvaal craton, South Africa. Several 86
studies are also available for the Siberia craton (Matsyuk et al., 1998; Matsuyk and Langer, 87
2004; Koch-Mueller et al., 2006; Schmädicke et al., 2013; Doucet et al., 2014; Taylor et al., 88
2016, Jean et al., 2016). The literature has reported astonishing NAMs inclusions in diamonds, 89
which also permit to further constrain the H concentration in the Earth’s upper mantle (e.g., 90
Kurosawa et al., 1997; Matsyuk and Langer, 2004; Novella et al., 2015; Taylor et al., 2016; 91
Jean et al., 2016). 92
To date, available literature data only reports four H concentrations in nominally anhydrous 93
mineral specimens from the Indian subcontinent: (1) one garnet from an unknown geological 94
setting in Maldener et al., 2003 (sample # RAJA, Prp42Alm54Sps2Grs2, 14 ppm wt H2O ); (2)
95
large gem-quality metamorphic diopsides from Jaipur (Rajasthan) recurrently used for diffusion 96
experiments (i.e., sample # CIT. 11221 in Skogby et al., 1990 ; Skogby and Rossman, 1989; 97
Carpenter Woods et al., 2000; Ferriss et al., 2016); (3) an augite from Kangan area, Andhra 98
Pradesh (i.e., sample # GRR 1660, Skogby et al., 1990), and (4) two metamorphic enstatites 99
(i.e., samples GRR1650a,b; Skogby et al., 1990). Nevertheless, none of these nominally 100
anhydrous mineral specimens have a confirmed mantle origin, thus no statement can be 101
proposed regarding the hydrogenation state and strength of the continental mantle lithosphere 102
of any part of Indian subcontinent. 103
Here, we report the first detailed measurements of H concentrations, major and key 104
minor and trace element concentrations in NAMs (olivine, orthopyroxene, clinopyroxene and 105
garnet) from spinel- and garnet-bearing peridotite xenoliths and olivine grains embedded in 106
kimberlites from the Wajrakarur kimberlite field in the Eastern Dharwar craton, India. 107
Moreover, we also report H contents in several fresh garnet and clinopyroxene single crystals 108
which were separated from Wajrakarur kimberlite-hosted peridotite xenoliths. Our main aim is 109
therefore to quantify the H content in mantle NAMs beneath the Eastern Dharwar craton. 110
111
2. Material and Methods
112
Previous studies by Ganguly and Bhattacharya (1987) and Nehru and Reddy (1989) 113
already described the petrography of peridotitic mantle xenoliths hosted by Proterozoic 114
Wajrakarur kimberlites from the Eastern Dharwar craton and calculated the equilibrium 115
pressures and temperatures of these samples. The more recent study by Pattnaik et al. (2020) 116
focused on trace element compositions of olivine, garnet, clinopyroxene, orthopyroxene, spinel 117
and ilmenite of a larger selection of ultramafic xenoliths from the same area. Here we mainly 118
focus on the quantification of H in NAMs from selected peridotite mantle xenoliths and mantle 119
minerals hosted in Group-II kimberlites (orangeites) from the Wajrakarur kimberlite field in 120
the Eastern Dharwar craton, India. Please note that Group-II kimberlites (orangeites) are 121
recently being classified as a variety of lamproite (Pearson et al., 2019). The geological context 122
of the Dharwar craton and Wajrakarur kimberlite field is briefly presented below. 123
The Archean Dharwar craton represents a classical granite-greenstone terrane which is 124
overlaid on a basement of tonalite-trondhjemite-granodiorite gneisses (Naqvi and Rogers, 125
1987). The Dharwar craton is bounded in the east by the Proterozoic Eastern Ghats Mobile Belt, 126
in the northeast by the Archean Bastar craton and in the northwest by the cretaceous-tertiary 127
Deccan traps. The Dharwar craton is divided into the Eastern Dharwar craton (EDC) and the 128
Western Dharwar craton (WDC) by the Chitradurga boundary fold, which is considered as a 129
distinct shear zone (Chadwick et al., 2000; Ramakrishnan and Vaidyanadhan, 2010). 130
The kimberlite pipes in the Dharwar craton are mainly confined to the Eastern part and 131
are distributed in three fields as illustrated in Figure 1: Wajrakarur kimberlite field (~80 × 70 132
km), situated in the southern part of the EDC, approximately at 400 km east of Goa and 200 km 133
north of Bangalore (Anantapur district, Andhra Pradesh); the Narayanpet kimberlite field in the 134
northern part of the EDC, and at last the Raichur kimberlite field located between the other 135
fields. In the Wajrakarur field, there are more than 30 individual pipes spread over four distinct 136
clusters: Wajrakarur-Lattavaram, Chigicherla, Kalyandurg and Timmasamudram (Nayak and 137
Kudari, 1999). Kimberlites from the Wajrakarur field are poorly diamondiferous, while the 138
other fields are diamond-free (Ravi et al., 2013). Ages based on 40Ar/39Ar and U–Pb isotope
139
systems on separate grains of phlogopite and crustal perovskite indicate that kimberlite 140
emplacement occurred around 1.1 Ga (Gopalan and Kumar, 2008; Osborne et al., 2011; 141
Chalapathi Rao et al., 2014; see also study on major and trace element compositions of 142
clinopyroxenes and garnets in Shaikh et al., 2020). 143
The magmatic intrusions in the Wajrakarur field are mostly kimberlites, while some are 144
lamproites or orangeites, and ultramafic lamprophyres (Smith et al., 2013). A detailed account 145
of the mode of occurrence and features of the individual pipes of Wajrakarur kimberlite field is 146
given by Neelkantam (2001), Ravi et al. (2009) and Fareeduddin and Mitchell (2012). The 147
magmatic rocks contain peridotites, eclogites and crustal xenoliths as well as megacrysts 148
(Ganguly and Bhattacharya, 1987; Nehru and Reddy, 1989; Karmalkar et al., 2009). In the 149
Kalyandurg cluster eclogites dominate the mantle xenolith population (95%). 150
151
2.1. Samples description
152
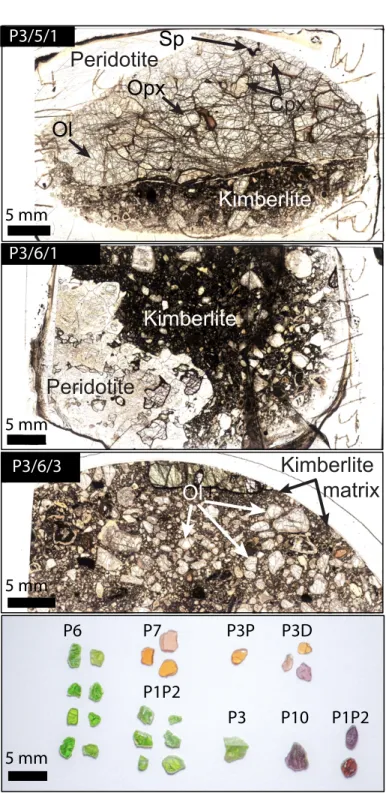
The studied samples are olivine (ol), orthopyroxene (opx), clinopyroxene (cpx) and 153
garnet (grt) from two fresh mantle xenoliths: one spinel (±garnet)-lherzolite (sample P3/5/1) 154
and one garnet-lherzolite (sample P3/6/1); and mantle olivines within a kimberlitic matrix 155
(sample P3/6/3), all from pipe 3 (Fig. 1). We also selected 10 garnets and 15 diopsides fresh 156
single grains, which were hand-separated from crushed xenoliths from different pipes of the 157
Wajrakarur kimberlite field (pipes 1, 3, 6, 7 and 10; Fig. 1). Unfortunately, satisfying grains of 158
olivines and orthopyroxenes could not be recovered from crushed peridotites. 159
All the samples are from the Wajrakarur-Lattavaram cluster (Fig. 1) and the samples 160
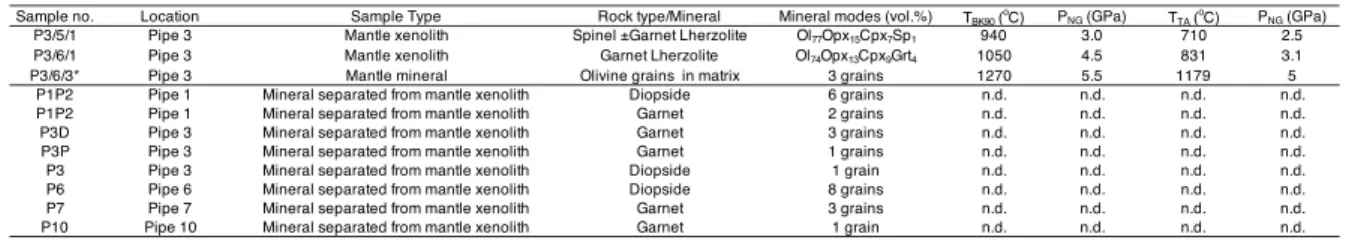
description is summarized in Table 1. The mineral modal compositions were calculated using 161
a free image processing software ImageJ v.152 for two lherzolites (samples P3/5/1 and P3/6/1) 162
and yield: Ol77Opx15Cpx7Sp1 (garnet<<0.5) for sample P3/5/1, and Ol74Opx13Cpx9Grt4 for
163
sample P3/6/1. Modal compositions of these two samples are reported in Table 1. Equilibrium 164
temperatures were calculated using the classical two-pyroxenes geothermometer by Brey and 165
Köhler (1990) for a hypothetical initial pressure of 4 GPa. It yields 3.0 GPa of pressure and a 166
temperature of 940 °C for sample P3/5/1; 4.5 GPa of pressure and a temperature of 1050 °C for 167
sample P3/6/1 and; 5.5 GPa of pressure and a temperature of 1270 °C for sample P3/6/3 (Table 168
1). Furthermore, following recommendations by Nimis and Grutter (2010), two-pyroxenes 169
thermometer by Taylor (1998) was also used to calculate the equilibration temperatures (TTA)
170
with an assumed initial pressure of 3 GPa for spinel peridotites and 5 GPa for garnet peridotites. 171
The estimated equilibration temperatures for theses peridotite give lower temperature ranging 172
from 710 to 1179 °C. Furthermore, garnet-orthopyroxene geobarometer based on aluminum 173
exchange was taken into consideration by Nickel and Green (1985) for calculating the 174
equilibration pressures with TTA values set as the initial temperatures, which yield a pressure
175
range of 2.5-5.0 GPa. 176
The peridotite xenoliths are coarse-grained, with olivine grain size between 2 and 7 mm, 177
orthopyroxene grain size up to 3 mm, clinopyroxenes have grain size between 2 and 7 mm, 178
garnets have grain size below 2 mm, and spinel below 1 mm, as illustrated in Fig. 2. The olivines 179
and orthopyroxenes do not show undulose extinction or specific features of plastic deformation. 180
Nevertheless, the rock sections are commonly fractured (Fig. 2), probably due to rapid ascent 181
toward the surface. The clinopyroxenes are of irregular shape and mainly intergranular and thus 182
are likely formed after the olivines and orthopyroxenes. Garnets have subhedral to anhedral 183
shape with no apparent chemical zoning and some garnets are embedded in clinopyroxene. 184
Spinels are intergranular with typical holly-leaf shape. 185
186
2.2. Electron probe micro-analyzer
187
The chemical compositions of the mantle-derived minerals were analyzed using a 188
Cameca SX-100 electron probe micro-analyzer (EPMA) wavelength dispersive spectroscopy 189
(WDS) at Department of Geology and Geophysics, Indian Institute of Technology (IIT) 190
Kharagpur (India). Analytical procedures were performed with a 15 kV accelerating voltage 191
and 20 nA probe current on regular 30-µm thin sections. The measuring peak and background 192
times were 20 s and 10 s, respectively. The oxides and silicates standards used for the EPMA 193
calibration were orthoclase (Si, K), rutile (Ti), chromite (Cr), corundum (Al), hematite (Fe), 194
rhodonite (Mn), periclase (Mg), diopside (Ca), jadeite (Na). The number of point analyses per 195
mineral grain range from 3 to 25 (further analytical details are given in Pattnaik et al., 2020). 196
Homogeneity was checked by comparing core to rim composition. Mg# was calculated as equal 197
to 100×Mg/(Mg+Fe) in atomic ratio, whereas Cr# in spinel was calculated as 100×Cr/(Cr+Al). 198
The typical EPMA results are reported in Table 2. 199
200
2.3. Laser ablation inductively coupled plasma mass spectrometer
201
Laser ablation inductively coupled plasma mass spectrometer (LA-ICP-MS) 202
measurements for minor and trace elements in olivine, clinopyroxene, and garnet were carried 203
out using a Thermo Fisher Scientific ICAP-Q quadrupole ICP-MS combined to a New Wave 204
193 ArF Excimer laser ablation system at Department of Geology and Geophysics, IIT 205
Kharagpur, India. The laser was used with an energy density of 5 J/cm2 at a frequency of 5 Hz
206
and using a spot size of 50 µm. The ICP-MS was perfected for maximum sensitivity for Li and 207
Th using the NIST 612 as a reference glass. The oxide production rate was monitored using 208
232Th16O and was below 1.0-1.2 %. The analyses were performed in time-resolved mode with
209
each analysis consisting of 35 seconds of background measurement with the laser turned off 210
followed by 45 seconds peak signal measurement while the laser was ablating the sample. 211
External standardization was obtained by the bracketing group of two measurements of NIST 212
612. The data quality was monitored by measuring the NIST 610 reference glass as unknown 213
interspersed with the measurements of the samples. The raw data were reduced using the 214
GLITTER® software, with SiO
2 as an internal standard from electron microprobe analyses for
215
olivine and pyroxenes, and CaO for garnet, and carefully inspected against heterogeneities in 216
the analyzed volume. Analyses were performed on a thin polished section for the rock slabs and 217
epoxy mounts for the mineral separates. Only unaltered and crack-free mineral grain areas were 218
analyzed. For each mineral, 1 to 6 analyses were performed within the grain cores. Here, we 219
only focused on minor and trace elements known to form major associated point defect with H 220
(e.g., Ti in olivine, e.g., Padrón-Navarta and Hermann, 2017), or coupled incorporation (Li, 221
e.g., Kent and Rossman, 2002) or to have similar incompatible behavior (e.g., according to 222
Dixon et al., 2002, between La and Ce) and common divalent ions not obtained accurately by 223
EPMA (Ni, Mn, Na, Ti). These concentrations are also reported in Table 2. 224
225
2.4 Fourier transform infrared spectroscopy
226
Hydrogen in mantle minerals was detected and quantified using transmission Fourier 227
transform infrared spectroscopy (FTIR) spectroscopy at the Laboratoire Charles Coulomb 228
(University of Montpellier, France). Rock thick sections (samples P3/5/1, P3/6/1 and P3/6/3) 229
and separated grain were hand-polished with diamond lapping films (grid size from 30 µm to 230
0.5 µm) down to a thickness ranging from 211 to 590 µm. The final thickness for each sample 231
is reported in Table 3. To preserve the microstructures, the crystals were not 232
crystallographically oriented, and thus only unpolarized infrared spectra were acquired using a 233
Bruker IFS66v spectrometer, equipped with a liquid nitrogen-cooled MCT detector (Mercatel 234
alloy, HgCdTe), a KBr/Ge beam splitter. The spectrometer was coupled to a Bruker 235
HYPERION microscope. Unpolarized IR measurements were performed following the 236
protocol of Demouchy et al. (2019): A square aperture (100 × 100 µm) was used, only optically 237
clean zones, free of cracks or inclusions, of the mineral grains were chosen for analyses, and 238
over 200 scans were accumulated at a resolution of 4 cm–1. Each spectrum was baseline
239
corrected (using OPUS software or subsequently, if needed, using the spline function in Igor 240
Pro), and the absorbance was normalized to 1 cm thickness to yield the absorption coefficient. 241
We used two different types of infrared calibrations to calculate H concentrations: (1) 242
the classic empirical frequency-dependent calibration of Paterson (1982) for unpolarized 243
infrared and (2) mineral-dependent calibrations (Bell et al., 1995, for pyroxenes and garnet; 244
Withers et al., 2012, for olivine). The frequency-dependent calibration of Paterson (1982) is 245 given as 246 𝐶)* = χ𝑖 150ζ 2 k(υ) 3780 − υ𝑑υ 247
Where the following mineral specific factors χi (Paterson, 1982) were used, and adjusted
248
as a function of the chemical composition in major element of the mineral i and thus its density 249
(see method of calculation in Demouchy and Bolfan-Casanova, 2016): χol = 2718 or
250
2726 ppm wt H2O for Fo92.2 or Fo93.3,respectively; χOpx = 2727 ppm wt H2O, χCpx = 2695 or
251
2714 ppm wt H2O, for P6 or P1P2, respectively and χgarnet= 2326 ppm wt H2O for an average
252
composition close to Prp76Alm12Sps1Grs11; z is the orientation factor and equals 1/3 for
253
unpolarized infrared analyses (here on non-crystallographically oriented grains, see Paterson, 254
1982 for details); and k(υ) the absorption coefficient is a function of the wavenumber υ. Typical 255
integration of the spectrum ranges from 3620–2900 cm–1 for olivine, 3700–3000 cm–1 for
concentration obtained by unpolarized infrared are multiplied by a factor three, it yields 258
satisfying estimate compare to the sum of concentrations obtained by polarized infrared for the 259
three crystallographic directions (see suppl. Fig. S1 in Férot and Bolfan-Casanova, 2012). This 260
calibration allows a detection limit of about 1 ppm wt H2O for a 1-mm-thick olivine sample
261
(Demouchy and Mackwell, 2003, 2006). The estimated error from the empirical calibration in 262
the resulting H concentration is around 30% (Paterson, 1982; Rauch, 2000), but lower for the 263
olivine calibration of Withers et al. (2012). Note that the maximum linear absorbance of the 264
non-normalized spectrum did not exceed 0.3, in agreement with the recommendations of 265
Withers et al. (2012) for unpolarized FTIR measurements of olivine. Also, if possible, at least 266
10 spectra of different orientation should be average to improve accuracy of the measurements 267
(Kovàcs et al., 2008). Here is was only possible for the PIP2 diopsides. The normalized 268
integrated area (absorption) are also reported for application to future IR mineral-dependent 269
calibrations or to previous calibrations (for olivine Bell et al., 2003, which overestimate H 270
content, see Withers et al., 2012 for discussion). 271
272
3. Results
273 274
3.1 Summary of major and minor elements
275 276
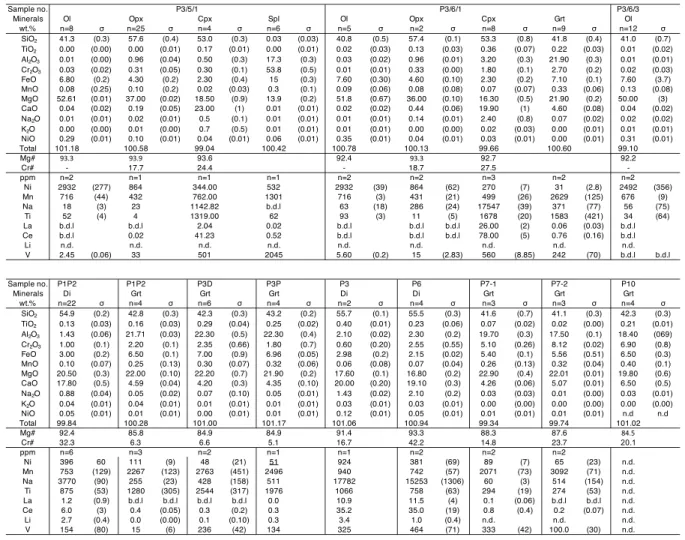
Major element compositions are reported in Table 2 for olivines, orthopyroxenes, 277
clinopyroxenes and Al-rich phases (garnet or spinel). They are used to infer mineral 278
petrogenetic origin and to further investigate potential variations in H as a function of major 279
element concentrations. Only a selection of minor and trace elements is reported here (Ni, Mn, 280
Na, Ti, La, Ce, Li, V) which are recurrently proposed as potentially associated point defects 281
with proton in olivine (e.g., Ti-clinohumite-like point defect, Padrón-Navarta et al., 2014; 282
Padrón-Navarta and Hermann, 2017) or orthopyroxenes (e.g., Al-H coupled substitution, 283
Mierdel et al., 2007) or having a chemical behavior similar to H. 284
285
Olivine 286
Olivines have relatively homogeneous composition with high Mg# ranging between 287
92.4 and 93.4. The compositions in FeO and CaO range from 6.8-7.6 wt.% and 0.02- 0.04 wt.%, 288
respectively. Contents in Ni range from 2932-2942 ppm. The Mg# data from this study and 289
other olivine samples from the Dharwar craton are inversely but weakly correlated with NiO 290
contents as illustrated in Figure 3a. The concentrations in Ti and V vary from 34-93 ppm and 291
2.4-5.6 ppm respectively. The Li concentration was too low to be determined in olivine (< 4 292 ppm). 293 294 Orthopyroxene 295
The concentration of orthopyroxene is quite homogeneous within grains with MgO and 296
FeO contents ranging from 36-37 wt.% and 4.3-4.6 wt.% respectively. The orthopyroxenes are 297
enstatite with Mg numbers ranging from 93.3 to 93.9, which is typical for mantle-derived 298
orthopyroxene (Dick and Bullen, 1984). The Cr# varies between 17.7 and 18.7, with Cr2O3
299
contents ranging from 0.31 to 0.33 wt.%. The contents in CaO and MnO range from 0.2 to 0.4 300
wt.% and 0.08 to 0.11 wt.%, respectively, while Al2O3 contents are very low in these
301
orthopyroxene samples (0.96 wt.%, Table 2). 302
303
Clinopyroxene 304
Clinopyroxenes are mostly Cr-diopsides with 1.0-2.6 wt.% Cr2O3,except for sample
305
P3/5/1 (spinel-bearing peridotite) and P3 grain, which have a very low Cr2O3 content (0.25
306
wt.% and 0.6 wt.%, respectively, see Table 2). The Mg# and Cr# vary from 91.35 to 93.55 and 307
24.4 to 32.3, respectively, whereas in case of P3 and P6 grains the Cr# is 16.71 and 42.20, 308
respectively. The MgO and FeO contents range from 16.3–20.5 wt.% and 2.15–3.0 wt.%, 309
respectively. The CaO, Al2O3, and Na2O contents vary from 17.79-23.6 wt.%, 0.52-3.2 wt.%,
310
and 0.5-2.4 wt.%, respectively. The TiO2 content and Mg# of clinopyroxenes from the studied
311
xenoliths show a weak negative correlation (Fig. 3b, R2=0.83) if the clinopyroxene grain from
312
P1P2 is excluded. Indeed, the latter sample is also at odds this the current database as shown in 313
Fig 3b. The CaO and Al2O3 contents of clinopyroxenes are also weakly correlated (R2=0.73) as
314
shown in Fig 3c, if clinopyroxene from sample P3/5/1 is discarded which has a CaO content 315
very low compare to the rest of the database. 316
317
Spinel 318
Spinels are present only in sample P3/5/1 and display Mg# of ~ 64.8, and Cr# of ~ 67.6 319
with MgO and Cr2O3 contents are 13.9 wt.% and 53.8 wt.%, respectively (Table 2). The Al2O3
320
and FeO contents are also homogeneous within the sample with 17.3 wt.%, and 14.9 wt.%, 321
respectively. The Mg# of olivine together with the high Cr2O3 contents still place these spinel
322
in the olivine-spinel mantle array (OSMA, Arai, 1994), although in the cratonic subgroup (e.g., 323
Tran and Nguyen, 2018). 324
325
Garnets 326
Garnets are homogeneous with no distinct compositional variation from the core to rim. 327
The Mg# and Cr# range from 84.6- 85.8 and 5.1- 7.5, respectively for the garnets group P1P2, 328
P3D and P3B. Compare to other garnets from this study, P7 garnets have high Cr# ranging from 329
14.8- 23.7. We have further separated P7 garnets individually (P7-1 and P7-2, see Table 2). 330
Using the classic negative correlation between Al2O3 and Cr2O3 contents as a petrogenetic
331
indicator, it confirms that our samples have mantle peridotite origin, as such relation is never 332
observed for mantle eclogites as illustrated in Fig 3d. The Al2O3 and CaO contents range from
333
17.5- 22.3 wt.% and 4.2 - 5.1 wt.%, respectively, which are also typical for the peridotitic 334
garnets (e.g., Ingrin and Skogby, 2000; Peslier, 2010). The Cr2O3 content lies in the range of
335
1.8 to 2.6 wt. % for lherzolitic garnets while in case of harzburgitic garnets, P7G1 and P7G2, it 336
varies from 5.1 to 8.1 wt.% and P10 is just between these latter values with a concentration of 337
6.9 wt.% Cr2O3. The content in Ti and Ni vary from 1280- 2544 ppm and 30-111 ppm,
338
respectively, while the Ti concentrations are low (<300 ppm) in P7 garnets. 339
340
3.2 Fourier transform infrared spectra
341
Over 182 analyses were performed by FTIR, unfortunately only a handful of spectra 342
could be used to providing accurate estimates of H distribution and concentration in mantle 343
nominally anhydrous minerals from Wajrakarur kimberlite field. Despite optical clearness, 344
many grains were altered, and contamination by hydrous minerals lamellae (e.g., serpentine and 345
amphibole) or along cleavages prevented accurate detection and quantification of H. The 346
unpolarized FTIR spectra of uncontaminated olivine, pyroxenes and garnet are shown in Figure 347
4. Examples of contamination by lamellae of hydrous minerals are shown in Figure 5, where 348
the strong absorption band at 3686 cm-1 corresponds to structural OH groups in serpentines
349
(Miller et al. 1987; Post and Borer 2000; Baptiste et al. 2012) and 3670 cm-1 OH groups in
350
amphibole (Skogby, 2006). 351
The spectra of olivine grains show distinct FTIR features: these olivine grains within 352
the kimberlitic matrix in sample P3/6/3 have typical mantle-derived spectra with absorption 353
bands at 3600, 3572, 3525 and 3227 cm-1 (Demouchy and Bolfan-Casanova, 2016).
354
The spectra of orthopyroxenes (P3/5/1) display OH bands located at 3602, 3548, 3517, 355
3409, 3313, and 3052 cm-1. While the bands at 3602, 3517, 3313, and 3052 cm-1 are typical of
hydrogen-rich mantle-derived orthopyroxenes, the band at 3542 cm-1 is not easily found in other
357
mantle-derived orthopyroxene, even when hydrogen content is low (Fig. 4c). 358
The spectra of Dharwar peridotitic clinopyroxenes display three major bands, again 359
typical of mantle-derived diopsides located at 3640, 3530 and 3444 cm-1 (Fig. 4b, Ingrin and
360
Skogby, 2000; Skogby, 2006; Peslier, 2010, Demouchy and Bolfan-Canova, 2016). 361
Garnets, despite excellent clarity and large grain size (> 2 mm), do not show typical 362
hydroxyl absorption bands. Only three samples (P1P2, P7, P3/6/1, Fig. 4c) show broad 363
absorption bands at 3630-3622 cm-1 and 3427cm-1. The first band positions match the typical
364
hydrogarnet substitution mechanism (e.g., 4 H+ occupying a Si vacancy, Geiger and Rossman,
365
2018; Mookherjee and Karato, 2010). However here the band at 3630-3620 cm-1 whichis
366
notably broad and do not display the usual well-defined Lorentzian shape for hydrogarnet 367
substitution. The absorption band around 3427 cm-1 could be linked to molecular water in
368
micro- to nano-inclusions (e.g., Rossman and Aines, 1991; Bell and Rossman, 1992b; Matsyuk 369
and Langer, 2004, Xia et al., 2005; Sheng et al., 2007). 370
Peridotites-derived garnets transported in alkali basalts are typically H-free, only 371
mantle-derived garnets hosted by kimberlite display absorption bands at 3571 and 3512 cm-1
372
often linked to Ti-rich composition(Bell and Rossman, 1992a, 1992b; Beran and Libowitzky, 373
2006 see their Fig. 8; Kurosawa et al., 1997). It is interesting to note that the absence of H in 374
peridotitic garnets equilibrated at depths greater than 80 km is unusual (Bell et al., 1995; 375
Withers et al. 1998; Peslier et al., 2012), while H-free or low H concentrations in garnet 376
inclusions in diamonds were reported in a number of studies (e.g., Novella et al., 2015; Taylor 377
et al., 2016). At last, the infrared features of the Dharwar peridotite garnets do not match either 378
the typical FTIR spectra of eclogitic garnets (see Fig. 7 in Beran and Libowitzky, 2006). 379
380
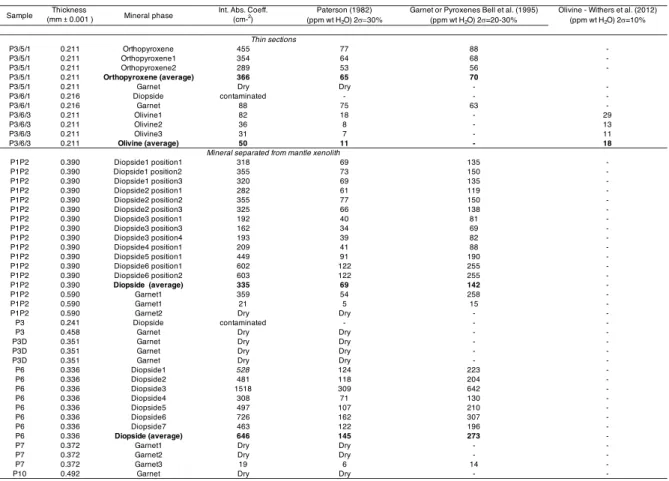
3.3 Hydrogen concentrations
Hydrogen concentrations, expressed in ppm by weight of H2O and quantified using
382
several calibrations are reported in Table 3. Following the calibration of Paterson (1982), the H 383
concentration ranges from 7-18 ppm wt H2O in olivine, 53-77 ppm wt H2O in opx, 41-309 ppm
384
wt H2O in cpx, and 0–75 ppm wt H2O in garnet (Table 3). Conversion to atomic ratio H/106 Si
385
(= ppm H/Si), which is commonly used in mineral physics community, is achieved by 386
multiplying the concentration in ppm wt H2O by a factor of 16.16 for olivine (for Fo92.5, see
387
calculation methodin Demouchy and Bolfan-Casanova (2016) for other mineral phases, cf. 388
their Table 1). As the calibration of Paterson (1982) underestimated the H concentrations (Bell 389
et al., 2003; Withers et al., 2012), we also give the concentrations using mineral-dependent 390
calibrations and it yields 11–29 ppm wt H2O in olivine, 56-88 ppm wt H2O in opx, 81-642 ppm
391
wt H2O in cpx, and 0–258 ppm wt H2O in garnet (see Table 3, details of calibrations are given
392
in section 2.4). Note that if abnormal spectra for garnet are excluded, it yields an average of 393
14.5 ppm wt H2O in garnet. Nevertheless, note that the IR bands for our garnets are not perfectly
394
matching the IR spectra of the two garnets used as standards in the calibration by Bell et al. 395
(1995). The same issues applied for the synthetic and very hydrous high pressure olivines used 396 by Withers et al. (2012). 397 398 4. Discussion 399 400
4.1. Incorporation of hydrogen in upper mantle minerals
401
Since hydrogen is embedded as atomic impurities in point defects within the structure 402
of NAMs, its incorporation is dependent of the intrinsic parameters (pressure, temperature, and 403
also oxygen fugacity) including chemical composition (e.g., Fe, Ti, Al), which leads to coupled 404
or associated point defects (e.g., Nakamura and Schmalzried, 1983; Mackwell and Kohlstedt, 405
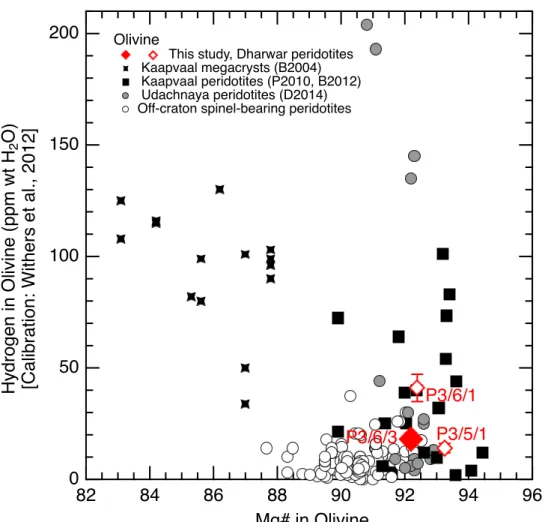
1990; Berry et al., 2005). Here, the effect of iron can be deciphered using Mg# of the mantle-406
derived olivines from the Dharwar craton and they are within the cratonic mantle database as 407
illustrated in Figure 6. Nevertheless, the H concentrations in olivine reported in this study agrees 408
with other Mg-rich and garnet-bearing peridotitic olivines from cratonic (>2.5 Ga) mantle 409
lithosphere (Fig. 6 and Demouchy and Bolfan-Casanova, 2016). It confirms that olivines from 410
spinel-bearing peridotite from off-cratonic settings have lower Mg# (90.4) than olivines 411
cratonic garnet-bearing peridotites (Figure 6, P3/5/1 olivine = Mg# 93.3 and P3/6/1 olivine = 412
Mg# 92.4), but indistinctly with low to high hydrogen concentrations. 413
Another notable mechanism incorporation mechanism of H in mantle olivine is the 414
association with Ti as a complex (coupled) point defect (PD): the occupancy of Mg vacancy by 415
Ti4+ is balanced by 2H+ incorporation in Si vacancy in olivine (abbreviated henceforth [Ti-H] PD
416
e.g., Berry et al., 2005; Walker et al., 2007; Padrón-Navarta et al., 2014; Padrón-Navarta and 417
Hermann, 2017; Tollan et al., 2018). This mechanism is characterized by a positive correlation 418
between the absorption of IR bands at 3575 and 3525 cm-1 and Ti concentration (at saturation)
419
as shown in Figure 7a. Furthermore, the low Ti and H concentrations of olivine from sample 420
P3/6/3 agrees very well with the current database for mantle-derived olivines as illustrated in 421
Fig. 7b. 422
In pyroxenes, at low pressure (<5 GPa) and based on experimentally hydrogenated 423
enstatite, Al3+ is commonly considered as a H incorporation enhancer (e.g., Rauch, 2000,
424
Mierdel et al., 2007; Stalder, 2004; Stalder et al., 2005; Stalder and Ludwig, 2007; Stalder et 425
al., 2015; Tenner et al., 2009; O’Leary et al., 2010; Férot and Bolfan-Casanova, 2012; Gaetani 426
et al., 2014; Novella et al., 2014). Here, we could not analyze the hydrogen concentration of 427
orthopyroxenes with different alumina content (only in P3/5/1, 0.96 Al2O3 wt.%) by FTIR, but
428
fresher clinopyroxenes were available and large enough to yield statistically relevant H 429
concentrations (Fig. 4b and Table 3). The different fields of eclogitic cpx, peridotitic cpx 430
transported in basalts, and kimberlites of mantle origin are easily identified by Al2O3 contents
of cpx (cf. dotted lines in Fig. 8), it supports the petrogenetic origin of peridotitic diopsides 432
from the Dharwar craton. 433
Hydrogen concentrations in garnet are very heterogeneous (0-258 ppm wt H2O) and
434
comparison of chemical composition among different garnets does not reveal significant 435
variation in Al2O3, CaO, or Ti concentrations potentially resulting from metasomatism and
436
explaining the abnormal FTIR spectra. At present, we cannot rule out the possibility of 437
hydroxyl-rich alteration or local contamination by nano-scale inclusions in P1P2 and P3/6/1 438
garnets (Bell and Rossman, 1992b; Beran and Libowitzky, 2006). 439
We must also mention the potential re-hydration by the volatiles-rich kimberlitic magma 440
during transport toward the surface:as shown experimentally by Baptiste et al. (2015), the co-441
existence of CO2 and H2O in kimberlitic magma lead to an effective decrease in water fugacity,
442
which does not promote hydrogen incorporation in olivine, or other NAMs. At the opposite, 443
transport within kimberlitic magma also does not seem to promote notable dehydration during 444
ascent, probably due to local point defect interactions and long-term hydrogen locking in 445
peculiar point defects (Thoraval and Demouchy, 2014; Thoraval et al., 2019). 446
447
4.2. Reconstructed hydrogen whole-rock concentrations
448 449
Despite the limited number of mantle minerals successfully analyzed in this study, we 450
can attempt to estimate, for the first time, the whole-rock (bulk) H concentration of the late 451
Archean Dharwar cratonic lithosphere (3.6-2.5 Ga; Jayananda et al., 2018). Using the estimated 452
mineral modes (a lherzolite with ol: 74%, opx, 14%, cpx 9%, grt 4%, from Table 1) and the 453
average hydrogen concentrations obtained from mineral-specific calibrations (Table 3, 18 ppm 454
wt H2O in olivine, 70 ppm wt H2O in opx, 207 ppm wt H2O in cpx and 14.5 ppm wt H2O in
455
garnet (based on clean spectra of P1P2-garnet 2 and P7 garnet 3, thus excluding the potentially 456
contaminated garnets), bulk H concentration yields 40 ppm wt H2O. Furthermore, we can use
457
experimentally determined partition coefficients of hydrogen for coexisting olivine, 458
orthopyroxene and clinopyroxene to cross-check if this estimate is indicating equilibrium 459
hydrogen concentration distribution. Here, we use the following published partition coefficients 460
from Demouchy et al. (2017): (1) partition coefficients of hydrogen between orthopyroxene 461
and olivine (Dopx/ol) = 5, (2) partition coefficients of hydrogen between clinopyroxene and
462
orthopyroxene (Dcpx/opx) = 2, and (3) partition coefficients of hydrogen between clinopyroxene
463
and olivine (Dcpx/ol) = 10, which were obtained at pressure and temperature ranges as close as
464
possible to the equilibrium conditions of our samples (3 GPa and 1100 °C) for a mantle-derived 465
composition and importantly for a basaltic melt-free system. Indeed, most of the experimental 466
studies have focused on basaltic melt-bearing systems, and a recent compilation can be found 467
in Demouchy et al. (2017, see their Table 3). Since, there is no experimental data for partition 468
coefficient of H between olivine and garnet (Dol/grt) in a basaltic melt-free system, we decided
469
to use an average value of Dol/grt=0.65, calculated using the results of experimental studies on
470
hydrous lherzolites (Dol/grt=0.6 from Gaetani and Grove, 1998; Dol/grt=0.7 recalculated from
471
Hirschmann et al., 2009). Temperature and pressure conditions of these experiments are fairly 472
close to those of our samples. These experimental values are also close to the previous estimates 473
of partition coefficient of H between olivine and garnet in MORB composition (e.g., Dol/grt=1,
474
Hirth and Kohlstedt, 1996). Using these partitioning coefficients, the same mineral mode (ol: 475
74%, opx, 14%, cpx 9%, grt 4%) and the hydrogen concentration in olivine as a reliable 476
concentration, it yields 41 ppm wt H2O, thus in agreement with the first estimate given above.
477
If opx or cpx is used as the initial concentration, it yields 32 or 48 ppm wt H2O, respectively.
478
These estimates permit to further constrain the bulk H concentration to 40#$%&' ppm wt H2O.
479
The bulk H concentration in the Dharwar cratonic lithosphere is four to five times lower 480
than the geochemical estimates of bulk H concentration in the upper mantle, e.g., 150 ppm wt 481
H2O (Michael, 1988; Saal et al., 2002; Marty, 2012), H concentration in peridotites from
482
lithospheric mantle (150-200 ppm wt H2O; Demouchy and Bolfan-Casanova, 2016). This bulk
483
hydrogen concentration is also well below saturation values of H concentration reported by 484
experimentation at lithospheric conditions, i.e. ~ 700 ppm wt H2O. (at 220 km of depth, see
485
Férot and Bolfan-Casanova, 2012). However, together with the equilibrium pressure estimates, 486
the resulting H concentrations in olivine from the Dharwar craton (Fig. 9) agree well with the 487
lower range of the current database for H-rich mantle olivines transported by the kimberlitic 488
magmas (e.g., South Africa and Udachnaya; Peslier et al., 2010; Baptiste et al., 2012; Doucet 489 et al., 2014). 490 491 4.3. Role of metasomatism 492 493
Metasomatism might be considered as a mantle process inducing enrichment or 494
depletion of H in the mantle NAMs (e.g., Bell and Rossman, 1992a; Ingrin and Skogby, 2000; 495
Peslier et al., 2012; Denis et al., 2015; Demouchy et al., 2015: Satsukawa et al., 2017). On the 496
contrary, undersaturated partial melting and melt extraction can only induce H extraction as H 497
is an incompatible element (e.g, Dixon et al., 2002). As mentioned above, the estimated bulk H 498
concentration of Dharwar peridotites is 40#$%&' ppm wt H2O is much lower than the current
499
estimates for the Earth’s upper mantle (e.g., 150 ppm wt H2O, Michael, 1988; Saal et al., 2002;
500
Marty, 2012; Demouchy and Bolfan-Casanova, 2016). Such low H concentrations could also 501
be linked to (1) melting-induced depletion, as the depleted peridotites from the Dharwar craton 502
probably represent a mantle residue after ~35-50 % melting, as suggested by Pattnaik et al. 503
(2020), or (2) melt-rock interactions as suggested in the irregular REEN patterns in peridotitic
504
clinopyoxenes from the Dharwar craton (Pattnaik et al., 2020) or as shown by a study on Japan 505
back arc system, e.g. Oki-Dogo locality (SW Japan, Satsukawa et al., 2017). These low H 506
concentrations, together with trace element enrichment in clinopyroxenes, are indeed the 507
accurate witness of significant melt-rock interactions (Pattnaik et al., 2020). They have a 508
different signature than results from cryptic metasomatism (e.g., Ichinomegata peridotites, 509
which preserved or enhanced the H concentrations in pyroxenes (Satsukawa et al., 2017). Here, 510
in Figure 8, the hydrogen and alumina compositions of clinopyroxenes from Dharwar 511
peridotites agree well with the relative decrease in H observed in clinopyroxenes from Okidogo 512
relative to Ichinomegata. Furthermore, based on REE concentrations of calculated hypothetical 513
melts composition in equilibrium with Dharwar garnet (Pattnaik et al., 2020) and following the 514
protocol of Aulbach et al. (2013), the results suggested that the metasomatic agent of the 515
Dharwar cratonic lithospheric mantle is likely to be small volumes of carbonated silicate melt 516
(Pattnaik et al., 2020), closely similar in composition to the natural kimberlite and lamproites 517
from the Dharwar craton (e.g., Chalapathi Rao et al., 2013). This conclusion is further supported 518
by the occurrence of kimberlite-carbonatite rocks in the Eastern Dharwar craton (Chatterjee et 519
al., 2008; Smith et al., 2013), notably at the Khaderpet pipe, which is located only 15 km east 520
of the Wajrakarur pipes. Thus, as recall above (section 4.1), if the metasomatic agent was CO2
-521
rich melt, it could have lowered the water fugacity in the system and could limit H incorporation 522
in the NAMs lattice (e.g., Dixon and Stolper, 1995; Baptiste et al., 2015). Nonetheless, to 523
strengthen this outcome, specific H partition coefficients between peridotitic minerals co-524
existing with the carbonated silicate melt would be necessary. To date, such experimental data 525
are not yet available and only experiments with variable water activity are reported in simplified 526
systems (e.g., Matveev et al., 2001, Wang et al., 2014, Gaetani et al., 2014, Tollan et al., 2018). 527
Thus, further studies at high pressures are required to understand the partitioning of H in these 528
complex petrological systems. 529
NAMs inclusions in diamonds prior to kimberlite emplacement are shielded from 530
interaction with passing fluids and melts, which define the variation of H concentration in the 531
upper mantle and transition zone at the time of diamond formation, (e.g., Novella et al., 2015). 532
Assuming that hydrogen diffusivity in diamond is indeed very slow (e.g., Popovici et al., 1995), 533
we can thus consider these specimens are reliable H concentration proxy for the pristine mantle, 534
that isolated NAMs from subsequent modification by discrete partial melting, melt-rock 535
interactions, metasomatism or aqueous fluids percolation occurring within subcontinental 536
mantle. A few studies reported H concentrations in inclusions in diamonds, using FTIR or 537
secondary ion mass spectrometry (Kurosawa, 1997, Matsyuk and Langer, 2004, Novella, et al., 538
2015; Taylor et al., 2016, Jean et al., 2016), with striking lower H concentrations in olivine (0-539
34 ppm wt H2O) when compared to co-existing olivines in cratonic peridotite xenoliths (Fig.
540
9). Nevertheless, rigorous comparisons remain challenging due to the paucity of accurate 541
determination of equilibrium temperatures and pressures for these rare NAMs inclusions in 542
diamonds. 543
544
4.4. Implication for the Dharwar Craton Viscosity
545 546
Incorporation of H in mantle minerals is recurrently proposed as a key parameter 547
affecting many physical and chemical properties of the upper mantle minerals and rocks (e.g., 548
Regenauer-Lieb and Kohl, 2003; Regenauer-Lieb et al., 2006; Albarède, 2009; Peslier et al. 549
2010; Demouchy and Bolfan-Casanova, 2016; Masuti et al., 2016). One particular property is 550
the viscosity of olivine-rich rocks, which constitute about 67 vol.% of the lithospheric upper 551
mantle (Demouchy and Bolfan-Casanova, 2016). It includes the lithosphere-asthenosphere 552
boundary where a significant decrease in viscosity (from 1024 to 1020 Pa.s, e.g., Garel et al.,
553
2014, 2020) is at the origin of partial mechanical decoupling, leading to the formation of a 554
horizontal boundary of tectonic plates. Several studies have proposed that this partial 555
mechanical decoupling between the lithosphere and asthenosphere is enhanced or even 556
triggered by H incorporation in olivine (Regenauer-Lieb and Kohl, 2003; Regenauer-Lieb et 557
al., 2006, Peslier et al., 2010; Faul et al., 2016; Masuti et al., 2016). Combined with numerical 558
modeling to test the longevity of South African cratonic root, it has been also proposed that a 559
drastic decrease in H concentration in olivine at the base of a cratonic root would generate a 560
‘hard shell’, which protects the cratonic root from erosion by underlying convective 561
asthenosphere (Peslier et al., 2010). Later on, this hypothesis was not confirmed by the results 562
from the Siberian craton (Doucet et al., 2014). Furthermore, the most recent studies on H in 563
olivine inclusions within diamond tend to confirm H depletion in cratonic root (Taylor et al., 564
2016; Jean et al., 2016) even if the depletion is not as drastic as reported previously (Kurosawa, 565
1997; Matsyuk and Langer, 2004; Novella et al., 2015). 566
Here, the mantle beneath the Dharwar craton is of particular interest to test this 567
hypothesis because the Indian subcontinent was attached to Gondwana and located close to 40 568
°S-80 °E, before it drifted (~20 cm year-1, e.g., Aitchinson et al., 2007) toward the Eurasian
569
plate during Cretaceous, until collision began at Eocene (55 Ma, Aitchinson et al., 2007). 570
Unfortunately, the results from rare Dharwar peridotitic olivines cannot permit to radically 571
confirm or infirm the hypothetic marked H-depletion in olivine at the base of the cratonic root, 572
since our mantle samples are not particularly from a deep upper mantle section (~5 GPa, i.e. < 573
150 km depth). Nevertheless, this is the first study which report the H concentrations in mantle 574
minerals from the Indian cratonic mantle lithosphere and the results are in good agreements 575
with the current data base for other mantle minerals and peridotites for similar depth. This 576
value permits to calculate for the first time the viscosity of the Dharwar craton as a function of 577
the hydrogen concentration. We can not use the most recent experimental study on hydroxyl 578
weakening for dislocation glide and climb flow laws, that is equations (16) and (17) in Tielke 579
et al., 2017, since these equations are not a function of the hydrogen concentration but use a 580
fixed hydrogen concentration (60 H/106Si, which equals 3.7 ppm wt H2O following the
calibration of Paterson, 1982). Nevertheless, we can use the dislocation creep flow laws given 582
by Hirth and Kohlstedt (2003, see their Table 1). We calculate the stress for a strain rate of 1 ´ 583
10-14 ms-1, a temperature of 1179 °C (P3/6/3, T
TA reported in Table 1), a confining pressure of
584
5 GPa (P3/6/3, PNG reported in Table 1), and the olivine hydrogen concentration of 11 ppm wt
585
H2O (Table 3, thus equals to 178 H/106Si, with the calibration of Paterson, 1982). The ratio
586
stress/strain rate gives the viscosity, which yields 5.3 ´ 1020 Pa s for an anhydrous olivine and
587
1.5 ´ 1020 Pa s for hydrous olivine. The weakening factor is only 3.5 at high equilibrium
588
temperature and pressure of these xenoliths. Note that for a millimetric grain size, and a volume 589
fraction of olivine > 60%, the strength of a peridotite is not expected to be strongly impacted 590
by secondary phases (e.g., Ji et al., 2001). Therefore, we conclude that the occurrence of 591
hydrogen in olivine is not inducing a major change in viscosity of the Indian craton for these 592
conditions (hydrogen concentrations, high temperature and 165 km of depth). 593
594
5. Conclusion
595
We quantified the H concentrations in the four main rock-forming nominally anhydrous 596
minerals from a rare selection of peridotite xenoliths and minerals embedded in Wajrakarur 597
kimberlites from the Eastern Dharwar craton, India. We have demonstrated that olivines, 598
orthopyroxenes, clinopyroxenes and garnets from the Dharwar craton are of mantle origin. The 599
Dharwar peridotites show a range of H concentrations from 11-29 ppm wt H2O in olivines,
600
from 56- 88 ppm wt H2O in opx, from 81-642 ppm wt H2O in cpx, and 14-15 ppm wt H2O. in
601
garnets (using mineral-dependent calibration and excluding abnormal spectra). The range of H 602
concentrations in nominally anhydrous minerals present in Dharwar peridotites agrees well with 603
the current database for mantle minerals transported by kimberlites in other Archean cratons 604
(e.g., South Africa, Siberia) and are not especially indicative of a H-rich mantle lithosphere 605
beneath the Dharwar craton in the late Archean. Finally, despite having a limited number of 606
studied mantle samples, we provide the first estimate of bulk H concentration in mantle 607
minerals from the Dharwar craton. Our results also permit to quantify the negligible impact of 608
hydrogen on the viscosity of the Indian cratonic mantle. 609
610
6. Acknowledgments
611
S.D. thanks IIT KGP and the Dept. of Geology and Geophysics for financially 612
supporting her visit in November 2019 and for their remarkable welcome. S.D. thanks D. 613
Maurin for management of the FTIR lab at IRRAMAN platform of University of Montpellier 614
(France). S. G. thanks both ISIRD from IIT Kharagpur and the SERB-DST (grant no. 615
ERC/2015/000558) for financial support. J.P. acknowledges MHRD, Govt. of India for 616
supporting his Ph.D. fellowship. EPMA and LA-ICP-MS analyses were performed at the Dept. 617
Geology and Geophysics (IIT Kharagpur, India) with the help of S. Sinha and S. Ranjan, 618
respectively. The authors thank K. Tiwari for his help for producing Fig. 2d and deeply thank 619
Prof. J. Ganguly for the donation of very rare rocks and minerals from Wajrakarur kimberlite 620
field, India. We are also grateful to Prof. V. Pease for editorial comments and handling, and 621
two anonymous reviewers for constructive reviews. 622
623
7. References
624
Aitchison, J.C., Ali, J.R., Davis, A.M., 2007. When and where did India and Asia collide? J. Geophys.
625
Res. 112, 87–19. doi:10.1029/2006JB004706
626
Albarède, F., 2009. Volatile accretion history of the terrestrial planets and dynamic implications. Nature
627
461, 1227–1233. doi:10.1038/nature08477
628
Arai, S., 1994. Characterization of spinel peridotites by olivine-spinel compositional relationships:
629
review and interpretations. Chem. Geol. 113, 191-204.
630
Aulbach, S., Griffin, W.L., Pearson, N.J., O'Reilly, S.Y., 2013. Nature and timing of metasomatism in
631
the stratified mantle lithosphere beneath the central Slave craton (Canada). Chem. Geol., 352,
632
pp.153-169.
633
Bali, E., Bolfan-Casanova, N., Koga, K., 2008. Pressure and temperature dependence of H solubility in
634
forsterite: an implication to water activity in the Earth interior. Earth Planet. Sci. Lett. 268, 354–
635
363.
Baptiste, V., Demouchy, S., Keshav, S., Parat, F., Bolfan-Casanova, N., Condamine, P., Cordier, P.,
637
2015. Decrease of hydrogen incorporation in forsterite from CO2-H2O-rich kimberlitic liquid. 638
Am. Min. 100, 1912–1920. doi:10.2138/am-2015-5200
639
Baptiste, V., Tommasi, A., Demouchy, S., 2012. Deformation, hydration and seismic properties of the
640
lithospheric mantle beneath the Kaapval craton. Lithos 149, 31–50.
641
Bell, D.R., Gregoire, M., Grove, T.L., Chatterjee, N., Carlson, R.W., Buseck, P.R., 2005. Silica and
642
volatile-element metasomatism of Archean mantle: a xenolith-scale example from the Kaapvaal
643
Craton. Contrib. Mineral. Petrol. 150(3), 251-267 doi:10.1007/s00410-005-0673-8
644
Bell, D.R., Ihinger, P.D., Rossman, G.R., 1995. Quantitative and analysis of trace OH in garnet and
645
pyroxenes. Am. Min. 80, 465–474.
646
Bell, D.R., and Rossman, G.R., 1992a. Water in Earth's mantle: The role of nominally anhydrous
647
minerals. Science 255, 1391–1397.
648
Bell, D.R., and Rossman, G.R., 1992b. The distribution of hydroxyl in garnets from the subcontinental
649
mantle of southern Africa. Contrib. Mineral. Petrol. 111, 161-178.
650
Bell, D.R., Rossman, G.R., Maldener, J., Endisch, D., Rauch, F., 2003. Hydroxide in olivine: a
651
quantitative determination of the absolute amount and calibration of the IR spectrum. J. Geophys.
652
Res. 108 (B2). doi.org/10.1029/2001JB000679
653
Bell, D.R., Rossman, G.R., Moore, R.O., 2004. Abundance and partitioning of OH in a high-pressure
654
magmatic system: Megacrysts from the Monastery kimberlite, South Africa. J. Petrol. 45, 1539–
655
1564.
656
Beran, A., and Libowitzky, E. 2006. Water in natural mantle minerals II: Olivine, garnet and accessory
657
minerals. in: Keppler, H., Smyth, J.R., Rosso, J.J. (Eds.), Water in nominally anhydrous minerals.
658
American Mineralogical Society Geochemical Society, Chantilly (Vir.), Reviews in Mineralogy
659
and Geochemistry 62, 169–191. doi:10.2138/rmg.2006.62.8
660
Beran, A., and Zemman, J., 1969. Üder OH-gruppen in Olivin. Öster. Akad. Wiss. 3, 73–74.
661
Berry, A., Hermann, J., O'Neill, H.S.C., Foran, G.J., 2005. Fringerprinting the water site in mantle
662
olivine. Geology 33, 869–872.
663
Brey, G.P., and Köhler, T., 1990. Geothermobarometery in four-phase lherzolith II. New
664
thermobarometrers, and practical assessment of existing thremobarometers. J. Petrol. 31, 1353–
665
1378.
666
Carpenter Woods, S., Mackwell, S.J., Dyar, D., 2000. Hydrogen in diopside: Diffusion profiles. Am.
667
Min. 85, 480–487.
668
Chadwick, B., Vasudev, V.N. and Hegde, G. V., 2000. The Dharwar craton, southern India, interpreted
669
as the result of Late Archean oblique convergence. Precam. Res. 99, 91-111.
670
Chalapathi Rao, N.V., Wu, F.Y., Mitchell, R.H., Li, Q.L., Lehmann, B., 2013. Mesoproterozoic U-Pb
671
ages, trace element and Sr-Nd isotopic composition of perovskite from kimberlites of the
672
Eastern Dharwar craton, southern India: Distinct mantle sources and a widespread 1.1 Ga
673
tectonomagmatic event. Chem. Geol. 353, 48–64. doi.org/10.1016/j.chemgeo.2012.04.023.
674
Chalapathi Rao, N.V., Kumar, A., Sahoo, S., Dongre, A.N., Talukdar, D., 2014. Petrology and
675
petrogenesis of Mesoproterozoic lamproites from the Ramadugu field, NW margin of the
676
Cuddapah basin, Eastern Dharwar craton, southern India. Lithos 196-197, 150–168.
677
doi:10.1016/j.lithos.2014.03.007
678
Chatterjee, B., Haggerty, S.E., Beard, A., Smith, C.B., Townend, R., 2008. Kimberlite-carbonatite
679
relationship revisited: Evidence from Khaderpet pipe, Andhra Pradesh, India. International
680
Kimberlite Conference, Abstract #9IKC-A- 00070.
681
Costa, F., and Chakraborty, S., 2008. The effect of water in Si and O diffusion rates in olivine and
682
implications for the transport properties and processes in the upper mantle. Phys. Earth Planet.
De Hoog, J.C.M., Hattori, K., Jung, H., 2014. Titanium- and water-rich metamorphic olivine in
high-685
pressure serpentinites from the Voltri Massif (Ligurian Alps, Italy): Evidence for deep subduction
686
of high-field strength and fluid-mobile elements. Contrib. Mineral. Petrol. 167, 990.
687
doi:10.1007/s00410-014-0990-x
688
Demouchy, S., and Bolfan-Casanova, N., 2016. Distribution and transport of hydrogen in the
689
lithospheric mantle: A review. Lithos 240-243, 402–425. doi:10.1016/j.lithos.2015.11.012.
690
Demouchy, S., Ishikawa, A., Tommasi, A., Alard, O., Keshav, S., 2015. Characterization of hydration
691
in the mantle lithosphere: Peridotite xenoliths from the Ontong Java Plateau as an example. Lithos
692
212-215, 189–201. doi:10.1016/j.lithos.2014.11.005.
693
Demouchy, S., and Mackwell, S.J., 2003. Water diffusion in synthetic iron-free forsterite. Phys. Chem.
694
Mineral. 30, 486–494.
695
Demouchy, S., and Mackwell, S.J., 2006. Mechanisms of hydrogen incorporation and diffusion in
iron-696
bearing olivine. Phys. Chem. Mineral. 33, 347–355.
697
Demouchy, S., Mackwell, S.J., Kohlstedt, D.L., 2007. Influence of hydrogen on Fe–Mg interdiffusion
698
in (Mg,Fe)O and implications for Earth’s lower mantle. Contrib. Mineral. Petrol. 154, 279–289.
699
Demouchy, S., Shcheka, S., Denis, C.M.M., Thoraval, C., 2017. Subsolidus hydrogen partitioning
700
between nominally anhydrous minerals in garnet-bearing peridotite. Am. Min. 102, 1822–1831.
701
doi:10.2138/am-2017-6089.
702
Demouchy, S., Tommasi, A., Barou, F., Mainprice, D., Cordier, P., 2012. Deformation of olivine in
703
torsion under hydrous conditions. Phys. Earth Planet. Int. 202-203, 57–70.
704
doi:10.1029/2008GL036611
705
Demouchy, S., Tommasi, A., Ionov, D., Higgie, K., Carlson, R.W., 2019. Microstructures, water
706
contents, and seismic properties of the mantle lithosphere beneath the northern limit of the Hangay
707
Dome, Mongolia. Geochem. Geophys. Geosys. 2018GC007931. doi:10.1029/2018GC007931
708
Denis, C.M.M., Alard, O., Demouchy, S., 2015. Water content and hydrogen behaviour during
709
metasomatism in the uppermost mantle beneath Ray Pic volcano (Massif Central, France). Lithos
710
236-237, 256–274. doi:10.1016/j.lithos.2015.08.013
711
Denis, C.M.M., Demouchy, S., Alard, O., 2018. Heterogeneous hydrogen distribution in orthopyroxene
712
from veined mantle peridotite (San Carlos, Arizona): Impact of melt-rock interactions. Lithos
713
302-303, 298–311. doi:10.1016/j.lithos.2018.01.007.
714
Denis, C.M.M., Demouchy, S., Shaw, C., 2013. Evidence of dehydration in peridotites from Eifel
715
Volcanic Field and estimates of magma ascent rates. J. Volc. Geoth. Res. 258, 85–99.
716
Dick, H.J., and Bullen, T., 1984. Chromian spinel as a petrogenetic indicator in abyssal and alpine-type
717
peridotites and spatially associated lavas. Contrib. Mineral. Petrol. 86(1), 54-76.
718
Dixon, J.E., Leist, L., Langmuir, C., Schilling, J.-G., 2002. Recycled dehydrated lithosphere observed
719
in plume-influenced mid-ocean ridge-basalt. Nature 420, 385–389.
720
Dixon, J.E., and Stolper, E.M., 1995. An experimental study of water and carbon dioxide solubilities in
721
mid-ocean ridge basaltic liquids. Part II: applications to degassing. J. Petrol. 36(6), 1633-1646.
722
Dongre, A.N., Jacob, D.E., Stern, R.A., 2015. Subduction-related origin of eclogite xenoliths from the
723
Wajrakarur kimberlite field, Eastern Dharwar craton, Southern India: Constraints from petrology
724
and geochemistry. Geochim. Cosmochim. Acta 166, 165–188. doi:10.1016/j.gca.2015.06.023
725
Doucet, L.S., Ionov, D.A., Golovin, A.V., Pokhilenko, N.P., 2012. Depth, degrees and tectonic settings
726
of mantle melting during craton formation inferences from major and trace element compositions
727
of spinel harzburgite xenoliths from the Udachnaya kimberlite, central Siberia. Earth Planet. Sci.
728
Lett 359-360, 206–218. doi:10.1016/j.epsl.2012.10.001
729
Doucet, L.S., Peslier, A.H., Ionov, D.A., Brandon, A.D., Golovin, A.V., Goncharov, A.G., Ashchepkov,
730
I.V., 2014. High water contents in the Siberian cratonic mantle linked to metasomatism: an FTIR