1
Digital Business Model Development and Validation for Real-Time
Monitoring Solution for Electrical Power Transformers
By
Nalaka Kahawatte
B.S. Mechatronics Engineering, California State University, Chico, 2008 M.S. Mechanical & Aerospace Engineering, University of California, Davis, 2012 Submitted to the Sloan School of Management and the Department of Civil & Environmental
Engineering in partial fulfillment of the requirements for the degrees of
Master of Business Administration And
Master of Science in Civil & Environmental Engineering
At the Massachusetts Institute of Technology
May 2020
© Nalaka Kahawatte, MMXX. All rights reserved.
The author hereby grants to MIT permission to reproduce and to distribute publicly paper and electronic copied of this thesis document in whole or in part in any medium now known or hereafter created.
Signature of Author……… Sloan School of Management and the Department of Civil and Environmental Engineering May 8, 2020 Certified By……….. Thomas Roemer Senior Lecturer in Operations Management Executive Director of the Leaders for Global Operations Program
Thesis Supervisor Certified By………..……… David Simchi-levi Professor of Civil & Environmental Engineering Thesis Supervisor Accepted By………. Maura Herson Assistant Dean, MBA Program, MIT Sloan School of Management Accepted By………. Colette L. Heald Professor of Civil and Environmental Engineering
2
PAGE INTENTIONALLY LEFT BLANK
3
Digital Business Model Development and Validation for Real-Time Monitoring Solution for
Electrical Power Transformers
By
Nalaka Kahawatte
Submitted to the
Sloan School of Management and the Department of Civil & Environmental Engineering on May 8, 2020 in partial fulfillment of the requirements for the degrees of
Master of Business Administration and Master of Science in Civil & Environmental Engineering
At the Massachusetts Institute of Technology Abstract:
Currently, the health of high-value power transformers is primarily evaluated by visual inspections, oil sample analysis conducted by a third-party lab, and measurements taken by a mechanic
physically present at the transformer. Furthermore, the maintenance philosophies followed by Transformer Asset Managers are primarily reactive and preventive. Therefore, understanding the current health using real-time data monitoring, trends, and predictive models presents a significant opportunity for Transformer Asset Managers. These insights can be utilized to optimize maintenance scheduling, order necessary parts ahead of time, reduce downtime, increase service availability of the grid, improve asset utilization, and reduce maintenance costs.
Maschinenfabrik Reinhausen(MR) has developed a Minimum Viable Product (MVP) for a
Transformer Asset Monitoring solution named TESSA® Fleet Monitoring and is currently field-testing TESSA® Fleet Monitoring with several utility partner companies.
One of the goals of this project was to develop a viable business model that would create tangible value to Transformer Asset Managers, enable MR to capture some of this value as profit, allow for growth of MR’s new Digital Venture in Automation (AV) business unit, and sustain profits and growth for an extended period. To achieve this goal, the project activities included deep dives into asset management philosophies, customer segmentation, understanding the jobs, pains, and gains for the customers, partnering strategies, competitor analysis, product differentiation, revenue models, and cost structures. The business models developed were validated with customer
interviews and further research. Another goal of the project was to survey the current data available on transformers that MR tap changers are installed on. A clustering algorithm was used to gain insights into common characteristics among transformers, end-users, and the types of transformers utilized by each of the end-users. Such a tool would allow MR to tailor maintenance services and trace any common failures among specific batches of components.
Thesis Supervisor: Thomas Roemer
Title: Senior Lecturer, Operations Management Thesis Supervisor: David Simchi-Levi
4
Acknowledgments
I am deeply indebted to all the following people who made the internship and this thesis possible. I would like to thank:
Maschinenfabrik Reinhausen (MR) for being an invaluable partner of the Leaders for Global
Operations (LGO) program and allowing the students to not only enhance their own experience and skills but also take pride in the value created for MR.
Dr. Uwe Kaltenborn for proposing the project, providing advice and guidance throughout the
internship, connecting me with the necessary resources, etc.
Thorsten Kruger, Dominik Neubauer, and colleagues at Digital Ventures in Automation (AV) for
warmly welcoming me to the MR/AV family, teaching me the German language, culture and history, and helping me widen my horizon with their compelling insights.
Professor Thomas Roemer for providing guidance and encouragement as an advisor, being a source
of inspiration, and instilling confidence to pursue excellence continuously.
Professor David Simchi-levi for sharing his valuable insights and providing advice and guidance
throughout the internship.
The Boeing Company for giving me the opportunity to come to the MIT LGO program, and to
contribute to building products that I dreamed about growing up.
LGO alumni at The Boeing Company (Laura Bogusch, Tom Sanderson, Adam Marshall, Brandon
Gorang, Guillermo Pámanes, Lucia Chung, David Hahs, etc.) and Brian Ritter for their advice and guidance since the day I decided to apply for the LGO program.
My mentors at The Boeing Company (Dr. Arun Ayyagari, Jane Matera, Chris Payne, Mumtaz Malik,
Andy Bayliss, etc.) for providing me with invaluable feedback and insights to help me learn and grow as an engineer and a leader.
LGO 2020 classmates for inspiring me in every way to get out of my comfort zone and strive to be
better every day.
My family, father Ananda, mother Kanthi, sisters Lakmali and Namali, brother Chathuranga, father-in-law Nihal, brother-in-law Neil, extended family, and my friends for their unwavering
support.
I would like to dedicate this thesis to
my incredible wife, Taniya, and our amazing
daughter, Ayla. Without their love and support, none of this would have been
5
Contents
1 Introduction ... 10
1.1 Maschinenfabrik Reinhausen (MR) ... 10
2 Background: ... 11
2.1 Electrical Power Distribution and The Transformer’s Role ... 11
2.2 MR’s current position in the Power Distribution Value Chain ... 17
2.3 Global Industry Trends ... 17
2.4 MR’s Existing Transformer Monitoring Infrastructure... 22
3 Problem Statements / Hypotheses ... 26
3.1 PART I - Hypothesis related to TESSA® Fleet Monitoring Business Model: ... 26
3.2 PART II - Hypothesis related to Transformer Data Clustering: ... 27
PART I - Transformer Online Monitoring ... 28
4 Literature Review – Transformer Online Monitoring ... 28
4.1 Asset Management ... 28
4.2 Data Selection & Collection ... 38
4.3 Business Model Frameworks ... 39
4.4 Customer Analysis and Segmentation ... 41
4.5 Value Delivery – Channels ... 46
4.6 Customer Relationships ... 47
4.7 Key Partnerships ... 49
4.8 Revenue Generation ... 52
4.9 Competitive Strategy ... 59
5. Business Model Development ... 65
5.1 Identifying the Target Market Segmentation ... 65
5.2 Value Proposition ... 87
5.3 Market Channels and Customer Relationships ... 88
5.4 Key Activities and Processes ... 89
5.5 Key Partnerships ... 91
5.6 Cost Structure ... 94
5.7 Revenue Generation ... 98
5.8 Profitability Predictions... 101
PART II - Transformer Data Clustering ... 111
6 Literature Review – Transformer Data Clustering ... 111
6.1 Data Pre-processing ... 111
6.2 Data Analysis ... 112
6
7.1 Data Collection and Preliminary Assessment ... 120
7.2 Data Pre-processing ... 120
7.3 Data Analysis ... 125
8 Thesis Summary, Conclusions, and Recommendations ... 130
8.1 Hypothesis Validation ... 130
8.2 Recommendations ... 131
8.3 General Organizational Observations and Recommendations ... 132
9 Recommended Future Work... 133
Bibliography ... 134
Appendix A List of Abbreviations: ... 138
Appendix B Cost Model ... 139
Appendix C Preliminary Transformer Data Visualization ... 140
7
List of Figures
Figure 2.1.1-1: System Overview ... 11
Figure 2.1.2-1: Power Transformer ... 12
Figure 2.1.2-2: Two Circuits linked by a common changing flux ... 12
Figure 2.1.2-3: Basic Functional Diagram of a Transformer... 13
Figure 2.1.2-4: Basic Principle of Load Tap Changer ... 13
Figure 2.1.2-5: MR's High-speed Resistance On-load Tap Changer (OLTC) ... 14
Figure 2.1.3-1: Typical Electrical Distribution Network ... 15
Figure 2.2-1: MR Products’ Position in Power Industry Value Chain ... 17
Figure 2.2-2: MR Services' Position in Power Industry Value Chain ... 17
Figure 2.3.1-2: Offshore Wind Power Project Pipeline ... 18
Figure 2.3.2-1: Global Transformer Market Outlook ... 20
Figure 2.3.2-2: Infrastructure Spending by Region (2017 and Forecasted for 2022) ... 20
Figure 2.3.3.-1: Global Market for Transformer Monitoring ... 21
Figure 2.3.3-2: Global Transformer Monitoring System Market Forecast, 2017 – 2027 ... 21
Figure 2.4.1-1: Locations of Various Substations Displayed on a Spatial Map ... 22
Figure 2.4.1-2: Substation Level Information ... 23
Figure 2.4.1-3: Transformer Level Information ... 23
Figure 2.4.1-4: Evaluating Transformer Health ... 24
Figure 2.4.2-1: TESSA® FLEETSCAN 2D ... 24
Figure 2.4.3-1: Opportunities to Integrate Multiple Data Sources ... 25
Figure 4.1-1: Institute of Asset Management Conceptual Asset Management Model ... 28
Figure 4.1.2-1: Component Failure Rate Over Time ... 31
Figure 4.1.2-2: Aging behavior of the main components of the MV substations ... 32
Figure 4.1.3-1: Effect of adequate and timely maintenance and repairs ... 33
Figure 4.1.4-1: Elements of Reliability Centered Maintenance ... 35
Figure 4.1.6-1: Sample Integrated Computerized Maintenance Management Tool ... 36
Figure 4.1.7-1: Performance Degradation Overtime ... 37
Figure 4.1.7-2: Extending Service Life By Decreasing Stress ... 37
Figure 4.3-1: Business Model Canvas... 39
Figure 4.4.1-1: Traditional Segmentations... 41
Figure 4.4.2-1: Technology Adoption Lifecycle ... 43
Figure 4.4.4-1: Customer Jobs, Pains and Gains ... 45
Figure 4.4.5-1: Build-Measure-Learn Feedback Loop ... 46
Figure 4.7.2-1: Differences between IaaS, PaaS, SaaS ... 52
Figure 4.8.2-1: Pricing Structure ... 58
Figure 4.9.2-1: Mapping the Competitive Terrain ... 61
Figure 4.9.2-2: An Integrated Framework of Competitor Analysis and Interfirm Rivalry ... 62
Figure 4.9.2-3: Framework for Competitive Analysis ... 62
Figure 4.9.4-1: Product Performance Improvement - Disruptive Innovation ... 64
Figure 5.1.3-1: Transformer Online Monitoring on TALC Curve ... 68
Figure 5.1.4.1-1: Difference between a Run-to-Failure and an Optimized Maintenance Policy ... 71
Figure 5.1.4.1-2: 40-year NPV Based on Variations in Discount Rate ... 72
Figure 5.1.4.1-3: Value Estimate from an Independent Consultant ... 73
Figure 5.1.5-1: Competitive Landscape ... 75
Figure 5.1.5-2: Competitor Categorization Based on Resource Equivalency ... 76
Figure 5.1.5-3: Potential Scenarios of Coalition Among Competitors ... 76
Figure 5.1.5.1-1: Tailoring Response based on Competition ... 79
Figure 5.1.5.2-1: Example Competitor Feature Analysis Framework ... 80
Figure 5.1.6-1: Target Market Segment Based on Demanded Performance ... 81
8
Figure 5.1.9-1: Customer Engagement Strategy ... 84
Figure 5.1.9-2: Online Survey ... 85
Figure 5.2-1: Example of A tool that tries to address everyone’s needs ... 88
Figure 5.3-1: Proposed Communication Structure ... 89
Figure 5.4.1-1: Building in Feedback Loops into Product Development ... 90
Figure 5.5.1-1: Local vs. Google Cloud Hosted Cost ... 92
Figure 5.5.2-1: Potential Method of Collaborating Transformer Manufacturers ... 94
Figure 5.6.1.5-1: Cost Predictions ... 96
Figure 5.6.1.5-1: Percentage of Total Cost of Labor and Software Engineering ... 97
Figure 5.6.1.5-2: Cost of Software Engineering Outsourcing ... 98
Figure 5.7.5-1: Revenue Estimations for the Period 2020-2024 ... 100
Figure 5.7.5-2: Percentage of Total Revenue... 101
Figure 5.8.2-1: Forecasted Annual Profit ... 102
Figure 5.8.2-1: Net Cash Flow ... 103
Figure 5.8.3-1: Sensitivity Analysis - Initial Selling Price ... 104
Figure 5.8.3-2: Sensitivity Analysis - Annual Price Increase ... 104
Figure 5.8.3-3: Sensitivity Analysis - Annual Customer Growth Rate ... 105
Figure5.8.3-4: Break-even Number of Customers and Transformers ... 106
Figure 5.8.4-1: Potential Pricing Points ... 106
Figure 6.2.1.1-1: Clustering ... 113
Figure 6.2.1.1-2: Anamoly Detection ... 113
Figure 6.2.2-1: Big-O Notation ... 117
Figure 7.2.4-1: Number of Unique Values in Each Field ... 124
Figure 7.3.4-1: Visualizing the Clusters and their attributes... 127
Figure 7.3.4-2: Intepreting the Visualization ... 128
Table 7.3.4.1-1: Examples of Unique Configurations with Minor Variations ... 129
List of Equations Equation 4.1.1-1: Overall System Unavailability ... 30
Equation 4.1.1-2: Transmission Transformer Unavailability ... 30
Equation 4.1.1-3: Annual Unavailable Duration of a Transformer Line ... 30
Equation 4.1.1-4: Annual Unavailable Duration of a Transformer ... 31
9
List of Tables
Table 2.1.4-1: Indicators of Transformer Health ... 16
Table 2.3.1-1: Global Power Generation ... 18
Table 2.3.1-2: Regions Impacted by El-Nino ... 19
Table 3.1-1: Set of Hypothesis and Proposed Evaluation Methods – Part I ... 26
Table 3.2-1: Set of Hypothesis and Proposed Evaluation Methods – Part II ... 27
Table 4.1.3-1: Advantages and Disadvantage of Various Maintenance Philosophies ... 34
Table 4.2-1: Factors Impacting the Quality of Data ... 38
Table 4.4.2-1: General Characteristics of TALC Categories ... 43
Table 4.7.1-1: Strengths and Weaknesses of Make, Buy, Ally ... 50
Table 4.8.1-1: Revenue Mechanisms ... 53
Table 4.9.3-1: Six Qualities of a compelling value proposition ... 63
Table 5.1.2-1: Customer Personas ... 66
Table 5.1.4-1: Types of Benefits from Transformer Asset Monitoring ... 69
Table 5.1.4.1-1: NPV Estimate for DTE Energy Rules of Thumb ... 70
Table 5.1.4.1-2: Comparison - Alliander and DTE ... 71
Table 5.2.2-3: Estimate of Annual Cost Savings Per Transformer ... 72
Table 5.1.4.1-4: Conservative, Most-likey and Optimistic Estimates for Annual Value ... 73
Table 5.1.9-1: Objectives of Each Stage of Customer Engagement ... 84
Table 5.1.9-2: Focus Areas of Each Level of Customer Engagement ... 85
Table 5.1.10-1: Jobs, Pains, and Gains of Target Customer Personas ... 86
Table 5.6.1.4-1: Summary of Cost Assumptions ... 95
Table 5.7.4-1: Summary of Assumptions and Inputs to Revenue Estimates ... 100
Table 5.8.1-1: Assumptions for Conservative, Optimistic and Most Likely Scenarios ... 102
Table 5.8.5-1: Potential Bundling of Features ... 108
Table 5.8.5-2: Potential Pricing Strategy... 108
Table 5.8.6-1: Value Proposition Gap Analysis ... 110
Table 5.8.6-2: Implications of Gap Score ... 110
Table 6.2.1.2-1: Comparison of Machine Learning Algorithms ... 114
Table 6.2.2-1: Computational Complexity of ML Algorithms ... 117
Table 7.1-1: Summary of the data extracted ... 120
Table 7.2.2-1: Summary of Incomplete Data Fields ... 121
Table 7.2.2-2: Steps Taken to Address Missing Data ... 122
Table 7.2.3-1: Steps Taken to Correct Inconsistent Data Entries ... 123
Table 7.2.5-1: Summary of the Results of Data Processing ... 124
Table 7.3.2-1: Single vs. Multi-Core Processing Times... 126
Table 8.1-1: Hypothesis Validation Summary ... 130
Table 8.2-1: Recommendations ... 131
10
1
Introduction
1.1 Maschinenfabrik Reinhausen (MR)
Founded in 1868, MR is an independent (majority family-owned) company specializing in
transformer switching. Approximately 75% of 3,550 employees and 90% of production are based in Germany. With their core product, tap changers (discussed in detail in section 2.1.2), and their strong reputation for high quality and reliability, MR has become a dominant player in the Power Distribution industry. According to company documents, MR’s customer base includes more than 400 transformer manufacturers and 5500 end customers, and as a result, more than 50% of the worldwide electricity consumption passes through their products.
Within the duration of this project, MR was led by three Chief Executive Officers (CEOs), Dr. Nicolas Maier-Scheubeck, Michael Rohde, and Wilfried Breuer. Their vision for MR is to “consciously choose to operate in niche areas of the electrical engineering industry, in all its lines of business” and “be present it the market to the broadest possible extent and for more than just a temporary period, with highly specialized products and services.” [1] Consistent with this vision, MR’s product portfolio currently includes electronic voltage regulators, mobile systems for on-site testing of transformers, hollow composite insulators, intelligent motor drives, sensors, protective devices, and other transformer accessories.
The three CEOs also envision a path “from product-based business to systems business, combining products intelligently to create integrated solutions to complex applications” and “position MR much further up in the supply chain.” With that, MR has expanded its service offerings to include
consulting to develop detailed strategies for the entire system, on-site assessments, training, installation, calibration, testing, logistics, and procurement.
MR has also developed the Embedded Transformer Operating System (ETOS), a multi-platform capable, modular operating system that any transformer manufacturers can use as the primary control method. ETOS has the capability not only to perform a transformer’s primary functions such as voltage regulation, cooling system control, and protective controls but also to stream critical data to a remote server continuously. To enable the same data connectivity to older transformer models that are currently in service, MR has introduced the retrofittable Integrated Smart Module (ISM). To explore the benefits of this data to the customers and the potential to create new revenue streams, MR has created a new Digital Ventures (AV) Innovation Hub in its headquarters in Regensburg, Germany.
11
2
Background:
The overall industry structure and trends have a powerful influence on the possible future actions available to a firm [2]. Therefore, the goal of this chapter is to provide background information on the basic principles of electrical power distribution, current significant trends in the Electrical Power Industry, and MR’s current position in the total value chain. An assessment of MR’s existing
capabilities in terms of data infrastructure, tools, products, and analytics resources is also provided to increase the readers’ awareness of the current state.
2.1 Electrical Power Distribution and The Transformer’s Role
2.1.1 Electricity Distribution Network
Figure 2.1.1-1: System Overview [3] 1
During power transmission, energy is lost due to resistance losses, inductive losses, magnetic losses, stray losses within transformers, and corona losses in overhead lines. However, the majority of the losses occur due to resistance and is determined by the following equation.
Power Loss due to Resistance = 𝐼𝐼2𝑅𝑅 Where:
𝐼𝐼 = Current carried on the wire 𝑅𝑅 = Resistance of the wire
Ohm’s law dictates that the voltage is directly proportional to current. V = 𝐼𝐼𝑅𝑅
Therefore, the power distribution system steps up the voltage to a significant level before transmission and steps down before distributing power to final users. Typically, electricity is
generated within the voltage range of 10-40 kV, and long-distance power transmission is achieved in the range of 100 – 500 kV [3]. Ultimately, a typical household uses power at a voltage of 120-240V.
12
2.1.2 Transformer and the Principles of Operation
The voltage increase and decrease are accomplished by equipment within the substation called the Transformer. An example of a transformer is shown in figure 2.1.2-1.
Figure 2.1.2-1: Power Transformer (Source: ABB.com) 2
The fundamental physical principle governing the core operation of transformers is induction, formulated by the British physicist Michael Faraday in 1831. He found that a changing magnetic flux induces an electro-motive force (emf) in a circuit.
Figure 2.1.2-2: Two Circuits linked by a common changing flux [3]3
This induced voltage is proportional to the number of turns linked by the changing flux. 𝑉𝑉1
𝑁𝑁1= 𝑉𝑉2 𝑁𝑁2
Thus, when two circuits are linked by a common flux, with a difference in connected turns, there will be different voltages induced in the two circuits[3].
13
Figure 2.1.2-3: Basic Functional Diagram of a Transformer4
One of the primary functions of a Regulating transformer is to maintain a stable supply voltage to the end-users. Excessively high or low voltages can cause issues at end-users’ equipment: high voltage can cause lightbulbs and other circuits to burnout, and low voltage may reduce equipment performance or may even cause damage. Therefore, for instance, residential voltage is regulated to 120 Vac ±5% (i.e., 126 Vac to 114 Vac).
MR’s core product Onload Tap Changer (OLTC) performs a very critical function in voltage regulation. When the output voltage is outside of the specified range, the OLTC dynamically adjusts the number of turns in the output coil to raise or lower the output voltage as necessary.
14
Achieving this change in output turns without interrupting the supply voltage, causing instabilities downstream, or causing electrical short circuits requires very specialized technical expertise. With a strong commitment to technological innovation, reliability, and manufacturing quality in the area of OLTC, MR has developed a leading position and a strong reputation in the industry.
Figure 2.1.2-5: MR's High-speed Resistance On-load Tap Changer (OLTC) [68] 6 2.1.3 Transformer Size and Value
A typical electrical distribution network and the points at which the voltage is stepped up or down using transformers are shown in figure 2.1.3-1.
The output from power plants is stepped up to a voltage of approximately 250 kV (higher than 500kV in some instances), and the amount of electrical power generated at plants may range from 200 MW for a traditional hydro-electric plant to 1700 MW for a nuclear power plant. The
transformers used at these transitions points are large and specialized due to the high criticality level. As a result, the cost of these transformers tends to be very high. For example, an Ultra-Highvoltage transformer that operates beyond 500kV would cost approximately $5 million.
In contrast, at the lower level of the grid (closer to the end-user: households), transformers tend to be smaller in size, lower voltage levels, and smaller in size. As a result, these transformers may cost significantly lower (in the order of thousands of dollars).
15
Figure 2.1.3-1: Typical Electrical Distribution Network (Source: https://en.wikipedia.org/wiki/Electrical_grid) 7 2.1.4 Indicators of Transformer Health
The aging of a distribution transformer is a slow process resulting from various factors, including humidity, ambient temperature, loading, materials, and manufacturing variability. The typical life expectancy of a medium-size (400 kVA) distribution transformer is typically defined to be 180,000
16
hours, which is close to 21 years [4]. Still, this number can vary significantly, as discussed in section 4.1.2.
Data that is important to evaluate the health of a transformer can be categorized into parameters related to:
1. Primary functions 2. Supporting functions 3. Protective functions 4. Environmental
Essential parameters in each of these categories are shown in table 2.1.4-1 below.
Table 2.1.4-1: Indicators of Transformer Health1
Category Sub Category Parameter
Primary Functions Output Voltage (all 3 phases) Output Current (all 3 phases) Detected Failures in Primary Functions
Device Status Supporting
Functions Voltage Regulation Online Tap Changer (OLTC) Position OLTC Motor current OLTC vibration
Cooling System status
Cooling fan/motor currents Protective
Functions Oil (Core & OLTC) Oil Gas Concentrations (H2, CO, C2H2, C2H4, CO2, CH4, C2H6) Moisture in oil
Oil level
Bushing Calculated capacitance
Insulation Insulation level based on Withstand Voltage Tests
Monitoring Functions active or not Environmental Windings Winding temperature
Oil Top and Bottom oil temperatures Surface Maximum Hot spot temperature Ambient Ambient Temperature
Mineral oil serves three purposes within the transformer and is critical to the health of the transformer:
1. Insulation
2. Conducting heat away from the coils.
3. Coat and protect the coils and the core from corrosion. 4. Greasing for the OLTC
17
2.2 MR’s current position in the Power Distribution Value Chain
In the core product business, MR primarily assumes the position of a supplier to transformer manufacturers.
Figure 2.2-1: MR Products’ Position in Power Industry Value Chain8
In the services businesses briefly introduced in section 1.1, MR has taken a different approach.
Figure 2.2-2: MR Services' Position in Power Industry Value Chain9
In an interview published in company marketing material, one of the CEOs, Michael Rohde, made the following comment: “The company is transforming from a component supplier to a system supplier.”, which indicates that forward integration is part of MR’s current strategy. Hence, the future state of the company’s product may look much similar to what is shown in figure 2.2-2.
2.3 Global Industry Trends
Investments in energy infrastructure products have a strong correlation with macroeconomic conditions and are inherently cyclical. Therefore, it is vital to understand the broader context that may influence MR’s investment decisions and the customers and regions to focus on when deploying new products and services. With Digital Ventures organization, MR is also entering two other very broad categories: Internet of Things (IoT) and Big Data Analytics (BDA). In this subsection, major industry trends in these areas and financial situation are discussed.
2.3.1 Power Generation, Distribution, and Consumption:
According to Fitch Solutions, a provider of professional development services for financial
professionals, there will also be a strong demand for power transmission infrastructure. Until 2022, the total global power consumption is forecasted to increase with a year-over-year percentage rate
18
of 2% to 3% [5]. The corresponding global power generation is also predicted to grow at a similar rate as the gap between consumption and production is continually widening. The details are provided in Table 2.3.1-1 below.
Table 2.3.1-1: Global Power Generation (Source: Fitch Solutions) 2
The cumulative Infrastructure spending on power generation between 2019 and 2050 is estimated to be approximately $12 trillion, and 85% of it is expected to be directed towards wind, solar, and other zero-emissions technologies [6].
The European companies will look at foreign markets to develop new offshore wind capacity as the technology costs decrease, and the access to government subsidies (eg: UK and Germany) increases. For example, The Ministry of Trade, Industry, and Energy (MOTIE) of South Korea has announced plans to add 12GW of offshore wind by 2030 [5].
Figure 2.3.1-2: Offshore Wind Power Project Pipeline (Source - Fitch Solutions Key Projects Database) 10
This rising utilization of renewable sources such as solar and wind will demand further investments into power transmission and distribution infrastructure. For instance, wind and solar accounted for nearly half of the annual capacity addition in 2018 [6]. By 2027, the real-time demand by fast-charging full battery electric vehicles is forecasted to be approximately 1,500GW, and the forecasted solar and wind capacity would be approximately 1,900GW.
19
The widening gap between consumption and production has also encouraged connecting markets with electricity surpluses with markets with deficits and eliminating grid bottlenecks. Closing this gap is accomplished by implementing energy storage solutions and using existing power plants to serve numerous transmission networks. Such efforts will increase infrastructure spending, and Western Europe and North America are expected to lead investments in this area.
Power storage is also expected to play a significant role in future infrastructure investments. Key enablers in this area are supercapacitors and ultracapacitors for short-term storage, the energy density of existing batteries, Power-to-X solutions (P2Gas, P2H2, P2Heat), the cost per unit storage capacity, and Vehicle-to-grid (V2G) technologies. V2G would allow electric vehicles batteries to charge when power supply increases demand and feed the excess power back to the grid when demand exceeds supply. However, V2G has many commercial challenges that need to be overcome [65].
As for declining or volatile sections of the industry: experts expect the thermal coal exports to fall nearly 60% by 2040 [6]. Changing weather patterns due to El Niño conditions (changes in the flow of high- and low-pressure systems in the earth’s upper atmosphere) may strongly impact rainfall in specific regions and the resulting hydropower production. This will affect the infrastructure investment patterns of countries and utility companies that are heavily reliant on hydropower [5].
Table 2.3.1-2: Regions Impacted by El-Nino3
Utility companies in Western Europe and the US will increase their focus on electric vehicles as a potential new source of revenue: public charging stations along highways and inside urban areas. It is also possible that utility companies will offer services that will install private charging stations and software to integrate electric vehicles to the overall energy management of their homes.
2.3.2 Global Transformer Market
In 2017, the global transformer market was valued at $13.96 billion, and until 2022, the market is expected to grow at a Compound Annual Growth Rate (CAGR) of 1.6%. As seen in figure 2.3.2-1 below, the Asia-Pacific region is expected to lead the investments in transformers.
20
Figure 2.3.2-1: Global Transformer Market Outlook11
When it comes to largest spenders in terms of countries, China is expected to account for 26.7% of annual spending by 2022, and India, driven by initiatives to provide universal access to electricity, is expected to account for 9.6% of the yearly funding [7].
21
2.3.3 Global Transformer Monitoring Market
According to Global Transformer Monitoring System Market Analysis [7] conducted by the research firm Future Market Insights (FMI), the global market for transformer monitoring was estimated to be approximately US$ 1.6 Billion and expected to grow at a CAGR of 10.1% between 2017 and 2027.
Figure 2.3.3.-1: Global Market for Transformer Monitoring [8] 13
Figure 2.3.3-21: Global Transformer Monitoring System Market Forecast, 2017 – 2027 [8] 14
Within this market, approximately 85% of the spending is expected to be on newly installed units and rest on retrofit units.
2.3.4 Financial Markets’ Influence on MR’s New Products and Ventures
MR is a private family-owned company, which highly values independence. This has strongly influenced MR’s strategy to fully self-finance its investments. According to one of the CEOs, Dr. Nicolas Maier-Scheubeck, “This allows us to focus on what our employees and customers are equally passionate about: long term solutions for the growing challenges in electrical energy engineering.”
22
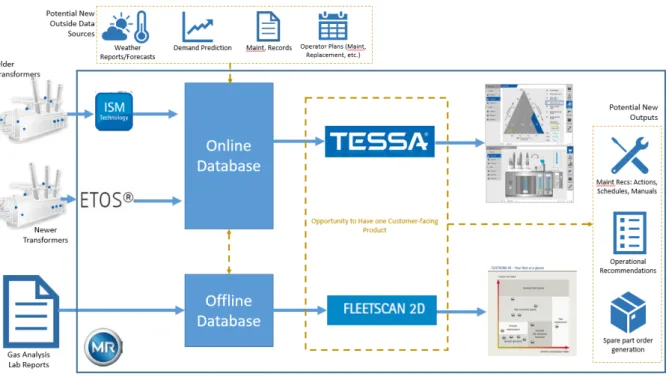
2.4 MR’s Existing Transformer Monitoring Infrastructure
MR’s current data infrastructure allows MR to collect real-time (“online”) data from Transformers using a data link. MR has also developed a platform to aggregate data collected by a
Mechanic/Service Professional manually on-site (“offline”) at the transformer. These two categories of data, Online and Offline, are currently presented to the customer as two separate products: TESSA® Fleet Monitoring and TESSA® FLEETSCAN 2D.
2.4.1 TESSA® Fleet Monitoring
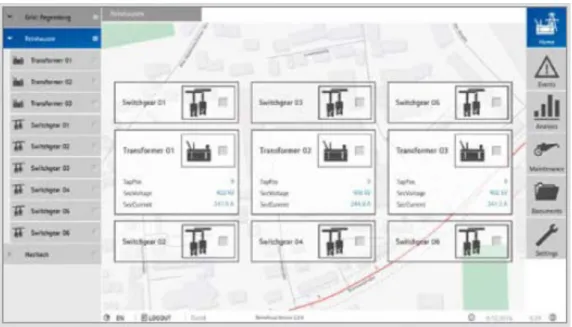
Embedded Transformer Operating System (ETOS) and the Integrated Smart Module (ISM) has enabled MR to gather critical real-time data from the transformers. This data is currently aggregated into a central database. TESSA®, a web-based platform, then allows the customer to view different transformer parameters (e.g. Service Voltage, Service Current, Tap Position, Gas levels, etc.) The graphical user interface allows customers to group transformers into substations based on their physical location (as shown in figure 2.4.1-1).
Figure 2.4.1-12: Locations of Various Substations Displayed on a Spatial Map (Source: Company Marketing Material) 15
The user can click on a substation and observe the status of the transformers with a few critical parameters (figure 2.4.1-2).
23
Figure 2.4.1-2: Substation Level Information (Source: Company Marketing Material) 16
The user can go to the transformer level and access more real-time data from the transformer.
Figure 2.4.1-3: Transformer Level Information (Source: Company Marketing Material) 17
Not only show the real-time momentary data, but TESSA® Fleet Monitoring can also present the historical values of a specific parameter and let the customer plot or download this data. Customers can also view particular events logged in the transformer, such as critical faults, certain parameters exceeding specific thresholds, etc.
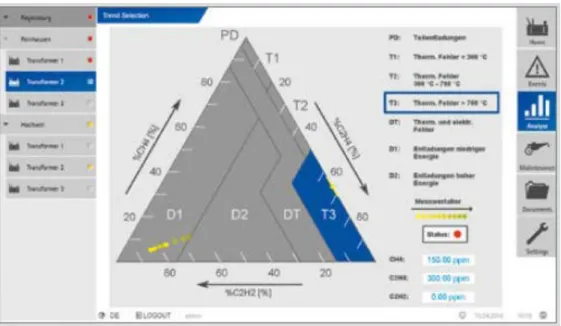
When there are accepted methods of evaluating transformer health using combinations of existing parameters (e.g. the ratio of different types of gases detected in transformer oil), TESSA® Fleet Monitoring can display this information to users, along with the trend (figure 2.4.1-4).
24
Figure 2.4.1-4: Evaluating Transformer Health (Source: Company Marketing Material) 18
2.4.2 TESSA® FLEETSCAN 2D
The process of generating offline data is as follows: A certified mechanic visits the transformer, collects an oil sample, and sends the oil sample to an accredited lab. The lab then conducts tests to look for particular types of gases. Once analyzed, the lab generates a report with the composition of gases and sends it back to the expert. Traditionally, the customer would decide whether
maintenance needs to be performed based on the report and file the physical report away in a physical binder. This process happens only annually.
TESSA® FLEETSCAN 2D attempts to digitize all of these reports and store them in a central server. Even though one data point represents a value in one specific moment in time within a year, it is possible to generate a Failure Risk Index and a Lifetime Consumption Index that would provide maintenance advice to the customer, as shown in figure 2.4.2-1.
25
2.4.3 Online/Offline Data Integration
As of February 20, 2019, MR has not integrated the two data sources. MR has expressed interest in combining TESSA® Fleet Monitoring and TESSA® FLEETSCAN 2D into one product that would enable the customer to assess the health of a transformer based on all available relevant data.
Figure 2.4.3-1: Opportunities to Integrate Multiple Data Sources20
2.4.5 Existing Analytics Capabilities
MR’s current maintenance advice based on data analytics is based on methods developed by transformer experts (Ex. Duval methodology).
MR has dedicated a team of experts to create a ‘data lake’ using all available data sources within the company (e.g. production, marketing, testing, quality, etc.) and explore the potential of using Machine Learning and Artificial Intelligence. The goal is to gain company-wide insights from this aggregated set of data.
26
3
Problem Statements / Hypotheses
3.1 PART I - Hypothesis related to TESSA® Fleet Monitoring Business Model:
Table 3.1-1: Set of Hypothesis and Proposed Evaluation Methods – Part I4
Hypothesis Evaluation Method
H1 A Transformer Asset Monitoring solution such as TESSA® Fleet Monitoring creates tangible value to Transformer Asset Managers, and they are interested in capturing this value.
• Estimate ‘Optimistic’, ‘Conservative’ and ‘Most likely’ values based on:
- Industry Rule of Thumb - Prior work in the area
- Market research by consultants
• 1:1 Interviews with asset managers (Phone calls, trade show, etc.)
• Survey sent to asset managers • The literature of prior research on:
- Challenges of traditional maintenance practices (reactive, preventive, etc.)
- Benefits of predictive maintenance
• Evidence of specific requests from customers. H2 MR can profitably deliver the value
created by TESSA® Fleet Monitoring to Asset Managers.
• Estimations based on: - Pricing
- Predicted demand based on pricing
- Predicted costs (infrastructure, direct labor, COCA, etc.)
- Profit based on pricing, demand, and costs. • Validate the attractiveness of pricing schemes
through detailed customer interviews. H3 Hosting TESSA® Fleet Monitoring
in-house is more cost-effective
compared to using an external cloud service provider.
• Cost analysis (internal implementation vs. partnering)
• Analysis of partner capabilities (strengths and weaknesses).
• The strategic vision of MR leadership and the targeted future core competencies.
• The literature on prior research on:
- Specialization, efficiency and learning curve - Make, Buy or Ally strategies
- Infrastructure as a Service (IaaS), Platform as a Service (PaaS) and Software as a Service (SaaS). H4 Focusing TESSA® Fleet Monitoring on
a market niche with specialized needs is more effective than targeting the mainstream market segment.
• Analysis of competitive landscape, target markets, product features, and pricing. • The literature on prior research (e.g. Clayton
27
3.2 PART II - Hypothesis related to Transformer Data Clustering:
Table 3.2-1: Set of Hypothesis and Proposed Evaluation Methods – Part II5
Hypothesis Proposed Evaluation Method
H5 Clustering the MR Tap Changers based on the characteristics of the transformers they are installed on, operating region, and customers will provide insights that are valuable for the MR Service Department.
• Evaluate insights with MR Service Department and their leadership.
28
PART I - Transformer Online Monitoring
4
Literature Review – Transformer Online Monitoring
4.1 Asset Management
In Support of Hypothesis AllObjective 1. Understand the primary functions of an Asset Manager
The International Standard Organization (ISO) in its standard document ISO 55000, Asset
Management – Overview, Principles, and Terminology, defines an asset as an ‘item, thing or entity that has potential or actual value to an organization.’ and Asset Management as ‘coordinated activity of an organization to realize value from assets.’
The vision of MR is to provide tools that enable Asset Managers of Power Transformers to operate their fleet reliably and efficiently while reducing overall costs. Building these tools is the primary responsibility of the Digital Ventures group. Therefore, it is valuable to gain an understanding of what Asset Management entails.
Figure 4.1-1: Institute of Asset Management Conceptual Asset Management Model (Source: Institute of Asset Management) 21
29
As seen in figure 4.1-1 above, Asset Management activities are diverse. Still, the overarching primary objectives of an Asset Manager is to maximize the value an organization gains throughout the life cycle of a tangible fixed asset (e.g. Airplanes, heavy machinery, Transformers, etc.). This is achieved by finding the optimum balance between asset availability/utilization and the costs incurred during the process while maintaining a strong commitment to quality, safety, asset performance,
customers, environment, etc. [9].
In addition to identifying the need for assets, estimating the funding required, and acquiring assets, a primary function of an Asset Manager is providing logistic and maintenance support for assets, and renewing assets as necessary.
International Standards Organizations (ISO) has published the ISO 55000 family of standards provides a framework to understand these key elements necessary for Asset Management within a modern organization (Figure 4.1-1).
ISO 55000 lists the benefits of good Asset Management practices as improved financial performance, informed asset investment decisions, managed risk, enhanced services, and outputs, demonstrated social responsibility, demonstrated compliance, enhanced reputation, improved organization sustainability, and improved efficiency and effectiveness.
Conversely, poor Asset Management may lead to high operational costs, poor quality and low customer satisfaction that make companies uncompetitive in today’s markets and in rare instances, catastrophic failure of assets may lead to casualties and subsequent bankruptcies of companies (e.g. 2018 PG&E Camp Fire in Paradise, CA).
Therefore, currently, there is a strong focus on utilizing various tools to optimize the maintenance of critical assets.
4.1.1 Performance Metrics - Asset Management in Power Distribution
The availability of a power transmission network is calculated as a function of the number and the duration of outages. These outages are also further divided by the cause and duration. Primary categories for cause are scheduled (planned) and unexpected/forced outages. The length of outages is classified as transient interruptions, lengthy interruptions (e.g. more than 3 mins), and short interruptions (less than 3 minutes). The quality of power transmitted is calculated as a function of the number and duration of limit violations of voltage, current, and frequency [10].
Common performance measurements are defined below.
Overall system unavailability of transmission lines measures the overall percentage of time transmission lines are unavailable.
30
Equation 4.1.1-1: Overall System Unavailability1
System Transmission Transformer Unavailability is a measure of the overall percentage of time transformers are unavailable from the transmission system.
Equation 4.1.1-2: Transmission Transformer Unavailability2
Transmission Line Interruption Duration per Year (in Hours) measures the average time duration per year, where a single transmission line is not available in service.
31
Substation Transformer Interruption Duration Per Year (in hours) measures the average time duration per year, where a single substation transformer is not available in service.
Equation 4.1.1-4: Annual Unavailable Duration of a Transformer4
At a substation level, overloading of transformers leads to overheating, equipment damage, and reduction of equipment life [10]. Transformer Utilization Factor is calculated to understand the ratio of maximum load on a transformer to its rated capacity.
Equation 4.1.1-5: Transmission Transformer Utilization Factor5
4.1.2 Component Failures
Component failure rates that affect the scheduling of maintenance are not constant over time. It is a time-based function that is commonly referred to as the “bathtub curve,” as shown in figure 4.1.2-1 [11].
32
During the first region of the curve above, the infant mortality phase, many failures are associated with poor design, poor installation, or misapplication [11]. This failure rate decreases as the component population increases, and the component manufacturers and operators make the necessary design and operational changes. The failure rates then stabilize in the next region of the curve, ‘Constant Failure Rate’. This length of this region is heavily influenced by preventative and predictive maintenance practices. Once the majority of the components in service reach the end of their useful life, the failure rate increases rapidly.
However, a recent publication by Petros Dalamara of the University of Wuppertal, Germany, et al. has demonstrated that the aging behavior of medium-voltage substations follows a linear trend [66], as shown in Figure 4.1.2-2 below.
Figure 4.1.2-2: Aging behavior of the main components of the MV substations based on the inspection data[66] 23
Once a maintenance action is initiated, an operator may decide to replace the component with a brand new one, replace with an already used part, or repair the failed component.
4.1.3 Maintenance Strategies
Maintenance can be defined as the combination of all technical and associated administrative actions intended to retain an item or system in, or restore it to, a state in which it can perform its required function [12]. The effect of adequate and timely maintenance was qualitatively captured by the National Research Council, as shown in figure 4.1.3-1.
33
Figure 4.1.3-1: Effect of adequate and timely maintenance and repairs (National Research Council 1998) 24
Even though the objective of maintenance may be consistent across companies and industries, there are many different system/component maintenance philosophies followed by various operators:
Reactive:
1. Conditional Maintenance
a. perform maintenance only when a component fails or degrades in performance, impacting the overall performance of the system.
Preventive:
2. Age Replacement Policy (ARP)
a. with the assumption that a component degrades over time and that the component has a predicted useful life. Maintenance is scheduled at a specific age of the component (e.g. 6000 hrs of operation).
3. Block Replacement Policy (BRP)
a. Maintenance is scheduled for specific time regardless of component operation (e.g. replace every three months)
4. Periodic Testing to detect performance degradation (e.g. annual Power Transformer oil sample analysis)
Predictive:
5. Predictive Maintenance
a. use data trends, mathematical models, and expert knowledge to predict the impending failure of a component and schedule maintenance.
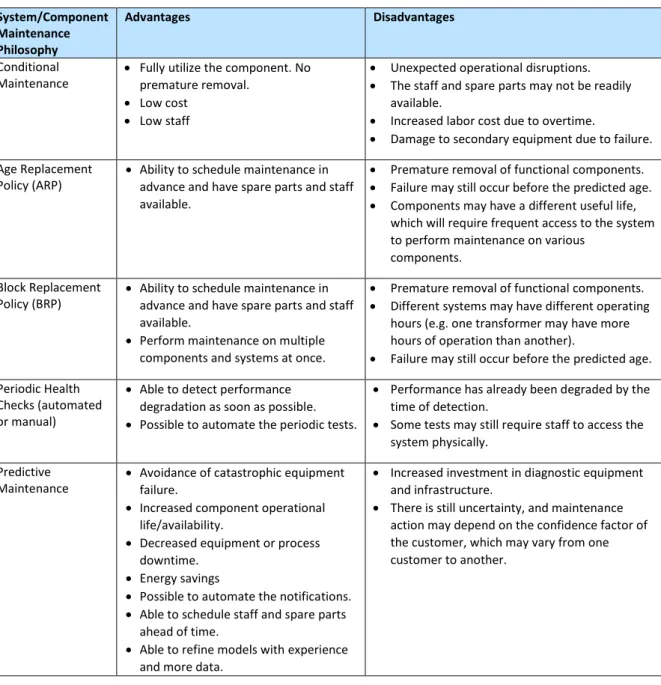
There are advantages and disadvantages inherent to each of these philosophies, as summarized below in Table 4.1.3-1.
34
Table 4.1.3-1: Advantages and Disadvantage of Various Maintenance Philosophies6
System/Component Maintenance Philosophy
Advantages Disadvantages
Conditional
Maintenance • Fully utilize the component. No premature removal.
• Low cost
• Low staff
• Unexpected operational disruptions.
• The staff and spare parts may not be readily
available.
• Increased labor cost due to overtime.
• Damage to secondary equipment due to failure.
Age Replacement
Policy (ARP) • Ability to schedule maintenance in advance and have spare parts and staff
available.
• Premature removal of functional components.
• Failure may still occur before the predicted age.
• Components may have a different useful life,
which will require frequent access to the system to perform maintenance on various
components. Block Replacement
Policy (BRP) • Ability to schedule maintenance in advance and have spare parts and staff
available.
• Perform maintenance on multiple
components and systems at once.
• Premature removal of functional components.
• Different systems may have different operating
hours (e.g. one transformer may have more hours of operation than another).
• Failure may still occur before the predicted age.
Periodic Health Checks (automated or manual)
• Able to detect performance
degradation as soon as possible.
• Possible to automate the periodic tests.
• Performance has already been degraded by the
time of detection.
• Some tests may still require staff to access the
system physically. Predictive
Maintenance • Avoidance of catastrophic equipment failure.
• Increased component operational
life/availability.
• Decreased equipment or process
downtime.
• Energy savings
• Possible to automate the notifications.
• Able to schedule staff and spare parts
ahead of time.
• Able to refine models with experience
and more data.
• Increased investment in diagnostic equipment
and infrastructure.
• There is still uncertainty, and maintenance
action may depend on the confidence factor of the customer, which may vary from one customer to another.
Even though labor-intensive and sometimes require unneeded maintenance tasks, preventive maintenance philosophies, on average, provide the operators a net benefit of approximately 12% to 18% compared to a purely reactive maintenance program [11].
From the analysis shown above, it is visible that Predictive Maintenance policies offer significant advantages. It is estimated that Predictive maintenance programs provide a net value of 8% to 12% on average [11]. Predictive Maintenance is further explored in section 4.1.7.
Many factors influence the policy that customers choose even though one policy may appear as superior to another. These factors include the culture of the company or region, government policies & regulations, the criticality of the function, availability of funding, staff and spare parts, customer service levels, management attention, age of the equipment, etc.
35
4.1.4 Reliability-Centered Maintenance (RCM)
RCM takes into consideration that all equipment in a system or process may not have the same level of criticality and may have different probabilities of failure, consequences, and degradation
mechanisms. RCM, therefore, utilizes different combinations of the maintenance strategies
discussed in section 4.1.3. For example, for non-critical and inexpensive equipment, RCM may utilize conditional maintenance (reactive). A typical RCM strategy utilizes up to 10% of reactive, 25% to 35% of preventive, and 45% to 55% of predictive strategies [11].
Figure 4.1.4-1: Elements of Reliability Centered Maintenance[13] 25 4.1.5 Maintenance Contracts
When it comes to contracting labor to perform maintenance, there are five predominant methods operators use [11]:
1. No outside contractors
a. operators maintain a full-time staff of maintenance professionals who perform inspections and repairs as required.
b. The cost of labor, parts, and material are covered by the operator. 2. Inspection Service Contract
a. The fixed annual fee paid by the operator to outside experts to perform specialized inspections (e.g. Annual transformer oil inspection).
b. The cost of labor, parts, and material related to repairs arising from an inspection is covered by the operator.
3. Preventative-Maintenance (PM) Service Contract
a. Generally purchased at a fixed fee and includes several scheduled visits.
b. The contractor provides the general consumables (e.g. lubricating oil, cooling fluids, etc.) and replaceable components (e.g. filters, belts, etc.)
c. The contractor performs calibration, testing control functions, general cleaning, etc. d. Depending on the terms of the contract, the operator may or may not be still
responsible for labor, parts, and material for repairs and emergency calls. 4. Full-labor Service Contract:
a. The contractor covers 100% of the labor associated with maintaining the asset. This may include labor costs for preventative maintenance functions, repairs, and emergency calls.
b. The operator is still responsible for purchasing material and spare parts. 5. Full-coverage Service Contract
a. A full-coverage service contract that provides 100% of maintenance coverage. b. The contractor provides all labor, parts, and material.
36
4.1.6 Maintenance Management Tools
The purpose of a Computerized Maintenance Management System (CMMS) is to manage, plan, and document the maintenance activities, categorized and related to resources and infrastructure elements. It can generate work orders according to costs, risks, equipment, relations, plans, etc. [14] Condition-Based Maintenance (CBM) tools are enabled by the data sent to a central server by the assets. This data may contain sensor data (e.g. voltage, current, etc.), internal calculation of state (e.g. power ON, shutdown, etc.), or determination of failures (e.g. voltage regulator failed). This data may be stored within the equipment itself (that an operator retrieves by physically accessing the equipment with a data extraction device) or communicated to a remote server via a datalink. Operators can then use this data within a CBM to understand the health of the equipment. Reliability-Centered Maintenance (RCM) tools enable analytic processes such as Failure Mode and Effects Analysis (FMEA), Reliability Block Diagram (RBD), Reliability Prediction (RP), Fault Tree Analysis (FTA) and Event Tree Analysis (ETA). They also provide reliability predictions derived through such analysis.
M.A. López-Campos et al.’s state in 2018 [14] that, even though many publications have been written on the topic, there has not been a successful commercial product that has integrated these three types of maintenance management tools. The process diagram of a potential integrated solution is shown in figure 4.1.6-1 [14].
Figure 4.1.6-1: Sample Integrated Computerized Maintenance Management Tool [14] 26 4.1.7 Predictive Maintenance
As briefly discussed in prior sections, predictive maintenance involves measuring different parameters within the equipment and estimate its overall health. As the level of performance degrades over time (figure 4.1.7-1), the primary objective is to detect the degradation reliably that would allow sufficient time available to act.
37
Figure 4.1.7-1: Performance Degradation Overtime [13] 27
Having sufficient time to act means that the operator can order spare parts, avoid high fees to rush parts, schedule maintenance tasks according to resources available, avoid overtime costs, minimize the downtime of the equipment, maximize asset utilization, and maintain high service level. Trends in performance degradation may also allow the operator to change the utilization pattern or intensity of an asset to extend the life or allow more time until maintenance is required. In the instance shown in figure 4.1.7-2 below, the stress on the component can be reduced in order to decrease the rate of degradation.
Figure 4.1.7-2: Extending Service Life By Decreasing Stress [13] 28
One important degradation characteristic of electrical transformers is that aging is primarily driven by alternating stress patterns: the higher the frequency, the higher the aging. Therefore, in the case
38
above, decreasing stress would mean decreasing the cycles experienced by the transformer and running at a constant temperature, even at a non-normal elevated temperature.
Predictive maintenance can be broken down into four areas: data collection, data preparation, data analysis, driving action. The technical aspects of these four areas will be discussed in section 4.2.
4.2 Data Selection & Collection
In Support of Hypothesis AllObjectives 1. Understand the fundamentals criteria for selecting the types of data to be collected for asset monitoring.
Given the opportunity to start with a clean sheet, the first important step of data collection is to decide on what parameters to collect [15]. If the system is already in place and operating, the user may be limited by the parameters available and the flexibility to add new parameters.
The factors that impact the quality of the data collected are provided in reference [16].
Table 4.2-1: Factors Impacting the Quality of Data7
Data Characteristic Definition
Accuracy The data is a true reflection of the physical entity it represents. Completeness A complete set of data is available for each asset data record,
and all assets are recorded.
Consistency Data is consistent in its definition, rules, format & value Validity All data held comply with data storage rules
Timeliness Data reflects the current state of an asset and complies with organizational standards for data update timescales.
Uniqueness All keys should be unique with no duplication of data – all assets should be recorded once only.
Data collection comes at a cost. As Machine Learning promises the ability to uncover hidden gems of information in large sets of data, there may generally be a tendency among customers and data scientists to request all possible types of data. Caution must be used as each additional data point does have cost implications. The costs are in the form of:
a. The cost of collection – the cost of sensors or the amount of time a person will spend collecting the data
b. The cost of transmission – large sets of data being transmitted may require high bandwidth data connections.
c. The cost of storage – large datasets will require efficient storage and retrieval infrastructure, whether the storage infrastructure is maintained within the company or the ‘cloud’.
d. Computational resources – data preparation techniques and analysis techniques such as Machine Learning may require a significant amount of computational power to handle a large dataset.
39
4.2.1 Access, Accuracy and Sampling Frequency
If predictive maintenance efforts require the installation of new sensors, it is vital to decide the cost of access to a specific parameter. For instance, if understanding the internal temperature of the combustion chamber of a jet engine is required, installing a sensor that can withstand approximately 2000oC will be very expensive, and the sensor may also interfere with the operations of the jet
engine. In this scenario, it may be possible to install a relatively inexpensive sensor remotely and use a mathematical model to estimate the combustion chamber temperature.
There is also a strong correlation between the accuracy demanded and the cost. Highly accurate sensors may require sophisticated electronics and, as a result, may be significantly more expensive than a simple sensor. For instance, if atmospheric temperature is required for analysis, the accuracy of 0.01oC may not be necessary.
The frequency of data collection is also essential. For a parameter that does not change rapidly, the ambient temperature in the case above, requiring a sampling frequency in the order of a few samplings per second may not be necessary.
The examples above may be extreme. However, the intent is for the reader to understand the cost implication of the decisions made early in a predictive maintenance tool development process and select the required data parameters wisely.
4.3 Business Model Frameworks
In Support of Hypothesis AllObjectives 1. To explore the prevailing business model frameworks.
4.3.1 Business Model Canvas
The primary tool used by MR to develop business models is the Business Model Canvas (BMC), which was initially proposed by Alexander Osterwalder. As shown in figure 4.4.1-1, BMC provides a pre-structured conceptual map (Trochim, 1989) to help understand and guide the development of a business model.
40
The four significant elements of a BMC are customers, offer, infrastructure, and financial viability. These elements further divided into nine major building blocks.
1. Customer segments;
The specific segment of the market that the product is intended to create value for. 2. Value propositions;
The total value the product creates by addressing the customer’s jobs and pains and providing further gains.
3. Channels of communication, distribution, and sales;
Methods by which the value proposition is communicated, sold, and delivered to the customers. The methods may vary by the target market segment.
4. Customer relationships;
Methods of establishing and maintaining relationships, which may differ from one target market segment to another.
5. Revenue streams;
Methods by which the company will capture revenue for the value created. 6. Key resources;
Assets the company utilizes to develop, offer, and deliver the value proposition. These assets can be tangible (factories, raw material, vehicles, etc.) or intangible (expertise, market access, etc.)
7. Key activities;
The necessary activities that the company shall perform to develop, offer, and reliably deliver the value proposition.
8. Key partnerships;
Companies may not control all the elements described above and may require alliances with other entities that may have access to critical elements.
9. Cost structure
All of the elements discussed above require financial investments and recurring costs.
41
4.4 Customer Analysis and Segmentation
In Support of Hypothesis H1
Objectives 1. To explore the frameworks available to conduct detailed analysis on customers.
2. To develop criteria to select a target customer segment.
Markets comprise of customers with different needs, profitabilities, Willingness to Pay (WTP), distribution channels, relationships, etc. [18]. A new venture may not have ample resources to focus on all of these customers, understand their needs, design the product with features that appeal to them, validate the product in the market, promote the product through the most effective channels available for each of them, provide after-sale services, and incorporate their feedback. Furthermore, there may be strong competitors already in the market, who will retaliate if the new venture
encroaches on their customer base. Therefore, at an early stage of a venture, it is crucial to
understand the different customer segments that exist in the market and make a conscious decision as to what segment to focus on. The right market segments will enable rapid adoption, revenue generation, growth, and the sustainability of a strong market position. Then with a position of strength, the company will be able to expand the customer and product portfolio to increase revenue and market share.
In this section of the literature search, various frameworks of customer segmentation were analyzed.
4.4.1 Frameworks for Customer Segmentation
The purpose of market segmentation is to identify the taxonomy of consumption patterns by dividing a market into several homogenous sub-markets [19]. Traditionally, when it comes to Business-to-Business (B2B) customer segmentation, the most common approaches are somewhat heuristic: segment by geography, industry, company size (revenue, number of employees, etc.), business life-stage (startup, mature, etc.), usage volume [20], brand loyalty [21], or potential value.
Figure 4.4.1-1: Traditional Segmentations [22] 30
In today’s competitive markets, where customers have many choices, and their needs are complex, segmentation based on heuristics alone would be insufficient. A potential downside is that the segments created may be too large, and the companies within a segment may exhibit significantly different preferences and behaviors. For example, if a seller picks a few of those large segments, the company may include companies with poor fit to the new venture and exclude companies in other
42
segments that may have been a better fit. Therefore, it is important to understand the characteristics that will enable a much more granular segmentation as well as provide useful insights.
Therefore, rather than creating a generic product targeted at the mass market, an organization can identify groups with unique characteristics that will enable it to understand each segments’ needs deeply, select the segments to focus on, allocate resources accordingly, customize the value proposition, select the appropriate delivery channels, and approach customers with the highest likelihood of adoption.
There are many alternative approaches to segmentation proposed. Customer groups represent separate segments if:
1. Their needs require and justify a distinct offer
2. They are reached through different Distribution Channels 3. They require different types of relationships
4. They have substantially different profitabilities
5. They are willing to pay for different aspects of the offer [18].
With the recent developments in Data Analytics, there are many tools available to efficiently aggregate customer information from various sources (e.g. Customer Relationship Management software, market research, macroeconomic conditions, etc.), analyze large data sets with many customer attributes (e.g. Data Mining/Machine Learning), and gather meaningful insights. It is important to note that the latest data analytics tools are not direct substitutes for experts with in-depth domain knowledge and experience. The results of a segmentation methodology should be validated with them.
4.4.2 Technology Adoption Lifecycle (TALC)
Relying on fleet monitoring software to gather the real-time status of the transformer fleet and taking action based on predictive analytics, as in the case of TESSA® Fleet Monitoring, constitutes a significant change in user (Asset Manager) behavior. The adoption of any such product that requires a change in behavior influenced by the user’s attitude towards new technology, the appetite for risk, and the openness to modifying behaviors. [23]
TALC model categorizes the users based on their psychographic profile (a combination of psychology and demographics) and attempts to describe the market penetration of a new technology product in terms of a profession in the types of consumers it attracts throughout its useful life [23]
In figure 4.4.2-1 below, X-axis represents the lifecycle of the product, and Y-axis represents the number of adopters.
43
Figure 4.4.2-1: Technology Adoption Lifecycle (Source: Crossing the Chasm) 31
The types of consumers that adopt the technology later in the lifecycle (the early majority, late majority, etc.) are heavily influenced by the endorsement of consumers before them. Because of that, seeking out and gaining acceptance from innovators and early adopters is critical to the rapid adoption of a new product. The generalized characteristics of each of the types are provided in Table 4.4.2-1 below.
Table 4.4.2-1: General Characteristics of TALC Categories (Source: High-Tech Marketing © 2005, TCG Advisors LLC) 8
Adopter Primary Motivation Key Characteristics Challenges
Innovators – Technology enthusiasts
• Learn about new
technologies for their own sake
• Strong aptitude for technical
information.
• Like to alpha test new
products
• Can ignore the missing
elements
• Do whatever they can to help
• Wanted unrestricted access to
top technical people.
• Want no-profit pricing
(preferably free)
• these people are not powerful
enough to dictate the buying decisions of others, nor do they represent a significant market in themselves. Early adopters – Visionaries • Looking to gain dramatic competitive advantage via revolutionary breakthrough. • May be driven by a high degree of personal recognition and reward.
• Great imaginations for
strategic applications
• Attracted by high-risk, high
reward propositions.
• Will commit to supply the
missing elements.
• Focused on gains – so not
price-sensitive.
• Want rapid time-to-market
• Demand a high degree of
customization and support.
• Easy to sell to but harder to
please. Early Majority – pragmatists • Gain productivity improvements via evolutionary change, not necessarily revolutionary changes.
• Driven by a strong sense of
practicality – they understand real-world issues and tradeoffs.
• Astute managers of
mission-critical applications.
• Focus on proven applications.
• Like to go with the market
leader.
• Insist on good references from
trusted colleagues.
• Wanted to see the solution in
production at the reference site.
• Does not want to deal with bugs


![Figure 4.1.2-2: Aging behavior of the main components of the MV substations based on the inspection data[66] 23](https://thumb-eu.123doks.com/thumbv2/123doknet/14746448.578365/32.892.176.723.389.669/figure-aging-behavior-main-components-substations-based-inspection.webp)