HAL Id: hal-00297573
https://hal.archives-ouvertes.fr/hal-00297573
Submitted on 27 Sep 2006
HAL is a multi-disciplinary open access
archive for the deposit and dissemination of
sci-entific research documents, whether they are
pub-lished or not. The documents may come from
teaching and research institutions in France or
abroad, or from public or private research centers.
L’archive ouverte pluridisciplinaire HAL, est
destinée au dépôt et à la diffusion de documents
scientifiques de niveau recherche, publiés ou non,
émanant des établissements d’enseignement et de
recherche français ou étrangers, des laboratoires
publics ou privés.
exchange of CO2 in two highly seasonal environments
A. Arneth, E. M. Veenendaal, C. Best, W. Timmermans, O. Kolle, L.
Montagnani, O. Shibistova
To cite this version:
A. Arneth, E. M. Veenendaal, C. Best, W. Timmermans, O. Kolle, et al.. Water use strategies
and ecosystem-atmosphere exchange of CO2 in two highly seasonal environments. Biogeosciences,
European Geosciences Union, 2006, 3 (4), pp.421-437. �hal-00297573�
www.biogeosciences.net/3/421/2006/ © Author(s) 2006. This work is licensed under a Creative Commons License.
Biogeosciences
Water use strategies and ecosystem-atmosphere exchange of CO
2
in
two highly seasonal environments
A. Arneth1, E. M. Veenendaal2, C. Best3, W. Timmermans4, O. Kolle3, L. Montagnani5, and O. Shibistova6 1Department of Physical Geography and Ecosystems Analysis, Lund University, 22363 Lund, Sweden
2Nature Conservation and Plant Ecology Group, Wageningen University and Research Centre 3Max Planck Institute for Biogeochemistry, PO Box 100164, 07701 Jena, Germany
4The International Institute for Geo-Information Science and Earth Observation (ITC), Enschede, The Netherlands 5University of Tuscia, Viterbo, Italy
6V. N. Sukachev Forest Institute, Akademgorodok, 660036 Krasnoyarsk, Russia
Received: 11 January 2006 – Published in Biogeosciences Discuss.: 10 April 2006 Revised: 7 July 2006 – Accepted: 12 July 2006 – Published: 27 September 2006
Abstract. We compare assimilation and respiration rates,
and water use strategies in four divergent ecosystems located in cold-continental central Siberia and in semi-arid southern Africa. These seemingly unrelated systems have in common a harsh and highly seasonal environment with a very sharp transition between the dormant and the active season, with vegetation facing dry air and soil conditions for at least part of the year. Moreover, the northern high latitudes and the semi-arid tropics will likely experience changes in key en-vironmental parameters (e.g., air temperature and precipita-tion) in the future; indeed, in some regions marked climate trends have already been observed over the last decade or so. The magnitude of instantaneous or daily assimilation and respiration rates, derived from one to two years of eddy covariance measurements in each of the four ecosystems, was not related to the growth environment. For instance, respiration rates were clearly highest in the two decidu-ous systems included in the analysis (a Mopane wood-land in northern Botswana and a Downy birch forest in Siberia; >300 mmol m−2d−1), while assimilation rates in the Mopane woodland were relatively similar to a Siberian Scots pine canopy for a large part of the active season (ca. 420 mmol m−2d−1). Acknowledging the limited number of
ecosystems compared here, these data nevertheless demon-strate that factors like vegetation type, canopy phenology or ecosystem age can override larger-scale climate differences in terms of their effects on carbon assimilation and respira-tion rates.
By far the highest rates of assimilation were observed in Downy birch, an early successional species. These were achieved at a rather conservative water use, as indicated by relatively low levels of λ, the marginal water cost of plant
Correspondence to: A. Arneth
carbon gain. Surprisingly, the Mopane woodland growing in the semi-arid environment had significantly higher values of λ. However, its water use strategy included a very plas-tic response to intermittently dry periods, and values of λ were much more conservative overall during a rainy season with low precipitation and high air saturation deficits. Our comparison demonstrates that forest ecosystems can respond very dynamically in terms of water use strategy, both on in-terannual and much shorter time scales. But it remains to be evaluated whether and in which ecosystems this plasticity is mainly due to a short-term stomatal response, or alternatively goes hand in hand with changes in canopy photosynthetic ca-pacity.
1 Introduction
In highly seasonal environments, plants are adapted to grow, and to reproduce, within a well-defined and often extremely short time period. Effects of climate change are likely to be particularly prominent under such conditions. And indeed, in some regions they can already be observed: for instance, as a lengthening of the “green” season in the northern high lati-tudes over the last decade, the principal cause being warmer temperatures that stimulate the spring recovery of the photo-synthetic apparatus and the growth of new leaves (Myneni et al., 1997; Zhou et al., 2001; Lucht et al., 2002; Sitch et al., 2005). Recent vegetation greening has also been shown for the Sahel, based on nearly 20 years of satellite records (Ek-lundh and Olsson, 2003), a trend that has been attributed to changes in the amount of precipitation (Hickler et al., 2005). A prolonged “green” period increases carbon assimila-tion. Its effect on the system’s overall carbon balance is, however, not straightforward to assess. An earlier onset of
assimilation due to warmer temperatures or a change in pre-cipitation patterns may be counterbalanced by ecosystem res-piration, which also increases with temperature or, in dry en-vironments, soil moisture. Over longer time periods, a stim-ulation of assimilation will only lead to an increased net CO2
uptake as long as decomposition lags increased productivity. What is more, at the climatic limits of discrete vegetation types marked changes in species composition – with corre-sponding effects on the carbon balance – can be proposed in response to changes in climate, although such a response cannot be based solely on annual precipitation and tempera-ture alone (Whittaker, 1975). A suite of additional factors de-termines the distribution of plant communities, their produc-tivity and reproductive success: carbon-water-nutrient inter-actions, daylength and the frequency of extreme or episodic events to name but a few (e.g., Schulze, 1982; Skre et al., 2002; Woodward and Lomas, 2004; Bond et al., 2005).
Still, using a complex ecosystem model that combines carbon cycle- and vegetation responses to changing climate (Smith et al., 2001; Sitch et al., 2003), a recent study con-cluded that not only the vegetation’s greenness but also the actual vegetation type that dominates in a certain African re-gion may be highly susceptible to modifications in the pre-cipitation regime (H´ely et al., 2006). Effects of climate change likely override effects of atmospheric CO2levels on
the dynamics of (sub)arctic vegetation (Kaplan et al., 2003). But field observations demonstrate that not only on local but also on regional scale the picture is more complex (Jonsdottir et al., 1999; Jarvis and Linder, 2000; Gamache and Payette, 2004; Bowman and Prior, 2005; Holtmeier and Broll, 2005; Scheffer et al., 2005; Williams and Albertson, 2005) and sometimes difficult to reproduce with state-of-the art models. Discrepancies between model results and field observations are to a certain degree due to the unavoidable absence of de-tail in ecosystem models. But they also place a finger on our lack of understanding the processes that underlie many of the above interactions, and how these are represented in the models. Yet, as feedbacks between the terrestrial carbon cycle and climate are anticipated to be significant (Cox et al., 2000; Friedlingstein et al., 2001; Foley et al., 2003) the de-tailed analyses of key controls on ecosystem functioning can help to identify the causes of model-observation inconsisten-cies.
Today’s biogeographical spread of sites where the surface-atmosphere exchange of CO2 and water vapour is being
measured allows assimilation and respiration to be studied in seemingly unrelated ecosystems that may, however, face analogous constraints on their productivity. Here we com-pare data derived from eddy covariance measurements in ecosystems located in the cold-continental vs. semi-arid en-vironment. Located thousands of kilometres apart, these have in common an extremely sharp transition between the dormant and the active period, as well as dry (air and soil) conditions during at least parts of the year. In the cold-continental regions the active period is characterised by
rapidly increasing temperatures in spring and short, warm, and often relatively dry summers, whereas in the semi-arid tropics the onset of the rainy season ends a several-months long period of drought. Both regions are likely to expe-rience changes in these critical environmental parameters, temperature and precipitation, in the future – or are in places already undergoing such changes, as indicated above. We include four different ecosystems: A Mopane woodland in Botswana, a deciduous ecosystem representing the typical vegetation in the semi-arid regions of Southern Africa, and three different ecosystems in Siberia, an evergreen Scots pine forest; a deciduous Downy birch forest; and a mire. Despite extensive data sets that have become available over the last decade or so (e.g., Falge et al., 2002), process studies on ecosystem scale are still relatively scarce for these regions, particularly in case of African savannas and woodlands, and deciduous boreal forests (Falge et al., 2002; Veenendaal et al., 2004). One important aspect therefore, specifically of the first part of this paper, is to present carbon assimilation and respiration observations for ecosystems, for which such data has not been discussed in detail before, and to synthe-size these in light of previously published data. The goal is to identify similarities and differences in these ecosystems’ strategies to assimilate and respire carbon, and to utilise wa-ter, which may be interpreted in terms of either their geo-graphic location and climate (boreal vs. tropical) or growth form (deciduous vs. evergreen).
2 Study sites
2.1 Mopane woodland, northern Botswana
The study site was located in northern Botswana, ca. 20 km east of the town Maun (23.5◦E, 19.9◦S). Colophospermum
mopane comprise the typical woodlands of southern Africa,
found growing on slightly heavy soils and in areas with an-nual precipitation between 300–800 mm (Timberlake, 1995). Average annual rainfall in Maun is 460 mm, of which typi-cally at least 80% fall in the four-months-period November to February. The pattern is highly irregular, however, with scattered, small rain events (<20 mm over one to two days) occurring into May or as early as September, whereas week-long dry spells are being observed even during the height of the rainy season (Veenendaal et al., 2004). Soils are hard setting sands with a maximum volumetric water holding ca-pacity of just below 20% in the top 50 cm. A layer of calcrete is found at a depth of 2–6 m.
In the area around Maun, Mopane forms a near single-species canopy of approximately 8 m tall trees with a maxi-mum leaf area index of around 1.2 in February and March. A few Acacia erioloba are present. Mopane is a drought decid-uous species but has a relatively irregular pattern of leaf fall. Leaves cease to assimilate by August (B. Mantlana, personal communication; Veenendaal et al., 2004), turning brown, but
may remain on the trees until October. New leaves emerge rapidly after the first few rain events of the season. In many years, leaf fall may be instigated earlier by night frosts, which can happen in the coldest month, July. A sparse understorey of grasses and herbs is present during the rainy season but dies back nearly completely between June and the onset of the rains (Veenendaal et al., 2004).
2.2 Boreal forests and wetlands, central Siberia
The study sites were located approximately 30 km inland to the west and 15 km to the east of the Yenisej river, with the closest settlements being the villages of Zotino and Voro-govo. The region is cold continental, has an average an-nual air temperature below minus 1◦C and low precipitation of just under 600 mm (Kurbatova et al., 2002), somewhat higher along the hills that are covered by dark taiga. There is a distinct seasonality in air temperatures, which approach nearly 20◦C on average in the warmest month (July) when daily maxima can exceed 30◦C. The period of snow cover lasts approximately seven months, typically from mid to late September until snow-melt begins by around mid-April or early May.
From a range of study sites (Heimann, 2002) we chose as representative ecosystems for this region a 200 year old
Pi-nus sylvestris forest and a mire, located in close proximity
to each other (60.8◦N, 89.4◦E), and – for comparison with the deciduous Mopane – a 50 year Betula pubescens stand (61.0◦N, 89.8◦E). The monospecific pine forest represents the typical vegetation re-growing after fire on the sandy soils to the west of the Yenisej. It has a LAI of 1.5, with a ground cover dominated by various lichen species. The mires that are interspersed with the Scots pine stands are typical for the central Siberian lowlands between the rivers Ob and Yenisej. The Betula stands grow on sandy silts that dominate to the east of the river what is the initial rise of the Central Siberian mountain range; it is an early succession species of the “dark taiga”. Maximum leaf area of this nearly monospecific for-est was 2.6 by late August. A more detailed description of the three ecosystems can be found elsewhere (Arneth et al., 2002a; Lloyd et al., 2002; R¨oser et al., 2002; Shibistova et al., 2002; Tchebakova et al., 2002).
3 Methods
All sites had been equipped with nearly identical eddy co-variance and climate sensors and software to measure and interpret the ecosystem-atmosphere exchange of CO2, water
vapour and sensible heat. Briefly, the eddy covariance flux systems consisted of a three dimensional sonic anemometer (Solent R3, Gill Instruments, Lymington, UK), located atop a tower a few metres above the respective vegetation type. At the Mopane site the instrumentation was placed at a height of 13 m, in a patch of the woodland with maximum canopy
height of ca. 8 m; at the Siberian pine forest, measurements were made at a height of 25.2 m, ca. 5 m above average canopy height whereas at the birch forest the instrumentation was placed at 22 m, ca. 7 m above average canopy height. At the Siberian wetland, instrumentation was placed ca. 4 m above the mire’s ridges (Kurbatova et al., 2002; Lloyd et al., 2002; R¨oser et al., 2002; Veenendaal et al., 2004). Infra-red gas analysers were located at ground level (LI-COR 6262, Lincoln, USA) to measure fluctuations in CO2and H2O
con-centration in air that was drawn from anemometer height. Flux measurements were accompanied by measurements of the associated weather parameters (e.g., quantum flux den-sity, precipitation, air relative humidity, air and soil temper-atures, soil moisture content). Eddy flux calculations were performed online but were later corrected to account for flux losses due to the gas-analysers’ imperfect performance in the high-frequency domain, or dampening of the signal while air was travelling along the tube (O. Kolle, unpublished; Eug-ster and Senn, 1995; Arneth et al., 2002a; Lloyd et al., 2002; R¨oser et al., 2002; Tchebakova et al., 2002; Veenendaal et al., 2004). The half-hourly fluxes thus derived were screened, and corrected for possibly dubious values encountered dur-ing stable conditions at night by applydur-ing a stationarity test or a u*-threshold, with the thresholds being: >0.2 ms−1 at the birch forest, >0.1 ms−1at the Mopane woodland, 0.055 at the wetland, and >0.15 ms−1at the pine forest (Arneth et al., 2002a; Lloyd et al., 2002; R¨oser et al., 2002; Veenen-daal et al., 2004). To calculate daily sums, gaps were filled using a respiration-temperature function for night-time val-ues (see below) and a hyperbolical relationship with quan-tum flux density (Q) during daytime hours. The shape of the correction functions was plastic and parameter values varied throughout the year in response to seasonal changes observed in assimilation and respiration (Arneth et al., 2002a; Lloyd et al., 2002; Tchebakova et al., 2002; Veenendaal et al., 2004).
The instrumentation was in place from June 1998– November 2000 at the Zotino mire, June 1998–present at the Zotino pine forest, May 2000–October 2000 at the Zotino birch forest, and February 1999–November 2001 at the Mopane woodland. In what follows we concentrate on data from the two consecutive years 1999 and 2000. Our inter-est lies with the underlying controls on canopy physiology, rather than reporting annual totals (for these c.f. above ref-erenced publications), and we therefore divide the measured ecosystem-atmosphere exchange of CO2(NEE) into its
com-ponent fluxes assimilation (A) and respiration (R). In case of the Siberian ecosystems, Arrhenius-type relationships of measured night-time NEE (=R) with soil temperature were established, and by using these, R were extrapolated to day-light hours (Lloyd and Taylor, 1994; Arneth et al., 2002a; Shibistova et al., 2002). In the Mopane woodland, ecosys-tem respiration rates were frequently confined by soil mois-ture rather than by temperamois-ture. During these dry parts of the year, half-hourly night-time rates observed above the u* threshold did not vary much and averages were calculated
for a number of nights (typically one to two weeks) to be ex-trapolated to the daytime hours. During the summer months, respiration rates responded in a pulse-like manner to the episodic rain events and calculations were performed for each one to two days separately. Due to logistical constraints at the remote sites, estimates of night-time canopy storage of CO2from concentration profiles could only be calculated for
the Scots pine forest (Lloyd et al., 2002). Since over a day, time integrated storage is normally zero this will not influ-ence the respiration totals for any of the three forests. Inclu-sion of storage would also have little impact on the observed seasonal variation and climate response. However, the abso-lute half-hourly eddy flux respiration data from the Mopane woodland and the Downy birch forest are likely to be some-what too low due to the absence of CO2 storage estimates.
But because of the rather open structure of the canopies and the u*-threshold imposed for data screening the effects are expected to be small (Veendendaal et al., 2004).
The surface conductance for water vapour exchange with the atmosphere was calculated from ecosystem latent heat fluxes using the Penman Monteith equation (Monteith and Unsworth 1990; Kelliher et al., 1993). Changes in leaf area index in the deciduous ecosystems were estimated from the ratio of radiation measured below and above the canopy
(Be-tula) and from remote sensing information (Mopane). For
the Betula stand, sporadic LAI measurements were also per-formed using a LiCor LAI 2000 canopy analyser (R¨oser et al., 2002). For the Mopane site, remote sensing-based LAI were derived from MODIS channels 1 and 2, which are specifically designed for vegetation monitoring, and are available at 250 m resolution (Justice et al., 1998). Atmo-spherically corrected reflectances (Vermote and Vermeulen, 1999) were used to obtain LAI on a daily basis. These are based on calculating Normalized Difference Vegetation In-dex (NDVI) values from visible and near-infrared surface re-flectances after a visual cloud cover check. The NDVI were, in turn, applied to semi-empirical relationships (Choudhury, 1987; Choudhury et al., 1994) to arrive at fractional vegeta-tion cover and LAI estimates. This procedure differs from the one used to produce the global MODIS LAI-products (Myneni et al., 2002) but comparison revealed date of the onset of leaf growth to be similar. Since spatial as well as temporal resolution is considerably higher than when using the standard products the within season-variation was higher, potentially leading to improved monitoring of pulse-like re-sponses.
4 Results and discussion
The period of plant assimilation in seasonal environments is frequently denoted as “green” or “growing” season. Us-ing this terminology to describe physiological activity at the ecosystem level is difficult ’though, as autotrophic and heterotrophic respiration contribute substantially to the
to-tal amount of carbon exchanged with the atmosphere. What is more, the seasonal courses of ecosystem assimilation and respiration rate are frequently out of phase (Falge et al., 2002). For instance, in deciduous forests a distinct respi-ration peak has been observed just after leaf fall. This peak occurs when assimilation rates are zero, but it nonetheless represents an active period in the system that corresponds to the rapid decay of readily available carbon in the freshly fallen leaves (Granier et al., 2002). Hence we adopt here the terms “active” vs. “dormant” season, where “active” refers to the period characterised by relatively high rates of either assimilation or respiration that are observed during the more temperate parts of the year. This period thus exceeds the green or growing season, as it can commence before new leaf-growth and continue beyond senescence. We also ex-plicitly acknowledge continuation of some ecosystem activ-ity during the dormant period, particularly heterotrophic res-piration, since the low rates of CO2 efflux observed in the
cold or dry season can sum up to a sizeable portion of the annual budget and must not be ignored (Hanan et al., 1998; Lafleur et al., 2001; Arneth et al., 2002a; Shibistova et al., 2002; Aurela et al., 2004; Veenendaal et al., 2004).
To alleviate comparison of the seasonality in the observed carbon exchange rates in ecosystems that represent diverse biomes from both hemispheres we define the onset of the active period as the first day following the month of Au-gust when rain exceeds 10 mm (Botswana), and the first day after January with average air temperature exceeding 0◦C (Siberia), respectively. These thresholds may appear some-what arbitrary at first; but for the rapidly changing climatic conditions that are found in extremely seasonal environments it has been shown that the associate physiological responses indeed resemble such a threshold-type behaviour (Suni et al., 2003; Arneth et al., 2006). And consequently, as the onset of the active period may vary by several weeks from year to year, this approach allows us to focus on the rate, nature and magnitude of the response, rather than the calendar date per se.
4.1 Seasonal patterns of ecosystem assimilation and respi-ration
In Figs. 1 and 2 daily NEE, ecosystem assimilation (A) and respiration (R) are summarised for two consecutive active seasons, 1999/2000 and 2000/2001 in case of the Mopane woodland. and 1999 and 2000 in case of the Siberian ecosys-tems. The complementary daily climate conditions are plot-ted in Fig. 3, but concentrating here on the first two to three months of the active season.
In the semi-arid tropics, a profound interannual variation is typical for both, the onset and the continuation of the rainy season, and the two study years provide illustrative exam-ples. In 1999, the first rain event of the summer exceed-ing 10mm was observed on 26 November – in the follow-ing year this occurred more than twenty days earlier (2000,
NEE ( m m o l m -2 d -1) -300 -200 -100 0 100 200 300 0 10 20 30 40 50 60 70 80 90 100 110 120 130 140 150 160 170 180 190 200 A ( m m o l m -2 d -1)
day of active season
0 100 200 300 400 500 0 10 20 30 40 50 60 70 80 90 100 110 120 130 140 150 160 170 180 190 200 R (m mol m -2 d -1) 0 100 200 300 400 1999 (/00)
Fig. 1. Daily net ecosystem-atmosphere exchange of CO2(NEE),
and component fluxes ecosystem assimilation (A) and respira-tion (R) in ecosystems representing the semi-arid tropics (Mopane woodland, Botswana) and the cold-continental boreal biome (Scots pine forest and mire, Siberia). Data are from eddy covari-ance measurements conducted during the active period 1999/2000 (Botswana) and 1999 (Siberia), denoted as Mopane: dark yellow circles, Mire: dark red triangles, and Pine: green open squares. The derivation of ecosystem assimilation and respiration from NEE measurements is described in the text. Following meteorological standards NEE are denoted as negative when directed into the sys-tem (A>R). However, in the manuscript the fluxes are analysed with respect to basic ecophysiological theory and assimilation as well as respiration are plotted as positive values.
The x-axes shows the number of days since the beginning of the active season, defined for Siberia as the first day average air tem-perature exceeded 0◦C, and for Botswana as the first day precipita-tion exceeded 10 mm. For the year shown this was on 26 November 1999 in Botswana and 11 April 1999 in Siberia.
2 November). Rainfall measurements taken since 1922 at Maun airfield approximately 20 km from the study site in-dicate that rain exceeding 10 mm day−1 falls typically not
before mid to late October. While commencing later, the continuation of the rainy season 1999/2000 was relatively regular, dry spells between December and February rarely exceeded 5 days (Fig. 3, black bars). By contrast, the rainy season 2000/2001 proceeded in a rather irregular pattern that included several dry periods of close to two weeks (white bars). During these dry periods air temperatures were natu-rally also warmer by several degrees (dashed line).
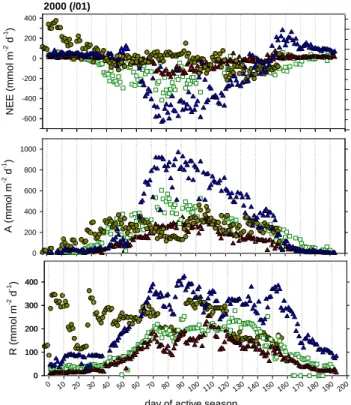
0 10 20 30 40 50 60 70 80 90 100 110120130140150160170 180 190 200 R (mm o l m -2 d -1) 0 100 200 300 400 NE E (mmol m -2 d -1) -600 -400 -200 0 200 400
day of active season
A ( m m o l m -2 d -1) 0 200 400 600 800 1000 0 100 200 300 400 2000 (/01)
Fig. 2. Same as Fig. 1 for the active period 2000/2001 in the tropics
and 2000 for Siberia. During that active season, measurements were also conducted in a Betula pubescens forest in Siberia (blue trian-gles). The onset of the active season as defined in the text coincided with 2 November 2000 in Botswana and 9 April 2000 in Siberia.
In both years little rain had fallen already during October (<10 mm in total) and these few and short events would have brought the Mopane buds close to burst (E. Veenendaal, per-sonal observations). Leaf area index measurements were not available for the site. The Modis 250 m-resolution data for 2000/2001 indicate a nearly immediate leaf-out following the onset of the rains, with a rapidly increasing leaf area index to 0.8 within the first 10 days of the active season (Fig. 3, cir-cles). Subsequently, LAI continued to increase to ca. 1.0–1.2 at fully developed canopy (Veenendaal et al., 2004). Cor-responding with leaf emergence was an initial drop in the above canopy short wave albedo below daily averages of 0.16 (Fig. 3) declining to ca. 0.12 at the height of the rainy season (not shown).
In the cold continental climate of Siberia, average air tem-peratures exceeded zero ◦C for the first time at around the same day in the two study years (9 and 11 April, respectively) but considerable differences in terms of the subsequent speed of warming and snow melt were observed (Fig. 3; Arneth et al., 2006). Average daily temperatures can be above zero degrees at least as early as 1 April in the region, but the fre-quency of days >0◦C increases considerably after mid-April (http://www.ncdc.noaa.gov). Yet even until mid-May, aver-age air temperature may fall below −10◦C in the occasional
Tai r ( o C) -10 -5 0 5 10 15 20 25 Al bedo, R below :abov e 0.0 0.2 0.4 0.6 0.8 0 10 20 30 40 50 60 70 80 90 LAI, Al bedo ( X 0.1) 0.6 0.8 1.0 1.2 1.4 1.6 T (o C) R a in fa ll ( mm d -1 ), Tair ( o C) 0 5 10 15 20 25 30 0 10 20 30 40 50 60 70 80 0.00 0.04 0.08 0.12 0.16
Cold-continental boreal, pine, birch and mire Semi-arid tropics, Mopane
day of active season day of active season
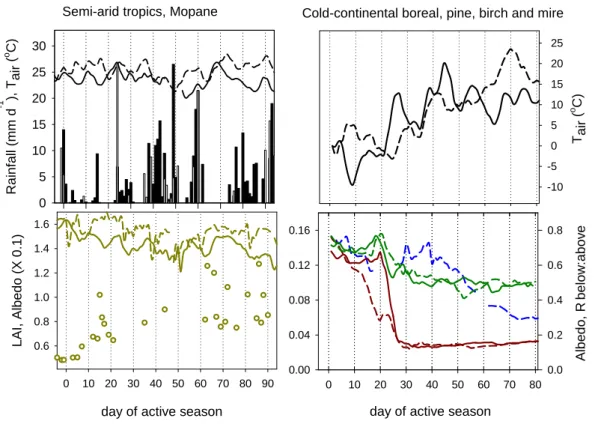
Fig. 3. Climate conditions, albedo and LAI (or surrogates) during the transition period dormancy – active for the semi-arid tropics and the
boreal environment. All lines represent four-day running means through daily data, with the solid lines for data collected in 1999/2000 (Botswana) and 1999 (Siberia) and the dashed line for data from 2000/2001 and 2000, respectively.
The panels show for the Mopane site (left) average daily air temperature and daily rainfall (top panel), shortwave albedo and Modis–derived LAI (bottom panel; the latter for 2000/2001 only). Rainfall is denoted as black (1999/00) and white (2000/01) bars. Panels on the right are for the cold-continental sites, including the ratio of Birch forest below:above canopy radiation in the second panel as surrogate for changes in LAI. The left y-axis denotes albedo measured above the Scots pine forest (i.e., varying between ca. 0.1 and 0.16), the right axis albedo and radiation ratio above the mire and underneath the birch canopy.
Colours are: blue – birch forest, green – pine forest, dark red – mire, dark yellow – Mopane.
year. With warming temperatures and the disintegration of the snow cover the surface’s radiation balance changed con-siderably. Albedo of the mire dropped from pre-melt 0.7–0.8 to active season values below 0.2, with distinct differences in the rate of the decline reflecting the slower melt in 2000. In the pine forest, where the snow-free canopy in spring masked the still snow-covered soil surface, albedo decreased from 0.15 to 0.10 during that period (Arneth et al., 2006). There were no albedo measurements available from the deciduous birch forest but the rapidly decreasing ratio of below:above canopy radiation after 38 days into the active season indi-cates leaf emergence, which was nearly completed about two weeks later when only 30% of the radiation entering the sys-tem reached the understorey and soil surface. By July, LAI was 2.2, with a maximum (2.6) in August.
In the evergreen forests and mires of the cold boreal en-vironment, CO2assimilation can “switch on” with
extraordi-nary alacrity as soon as snow begins to melt (Fig. 4). This fast physiological response ensures uptake and use of available
resources over the very short summer and hence the plant’s – and thus ecosystem’s – survival over the entire year. In the case of the pine forest, low carbon assimilation rates may al-ready be attained in spring when snow still covers the ground as long as air temperatures are positive (Suni et al., 2003; Ar-neth et al., 2006; Fig. 4/year 2000).
In deciduous forests, a lag between the onset of the ac-tive season and commencement of ecosystem assimilation is naturally to be expected. But in both, Mopane and Downy birch an immediate onset of ecosystem activity was observed nonetheless: in terms of respiration rather than assimila-tion (Fig. 1, 2). In the Mopane woodland, the first rain-falls of the season caused an instantaneous increase of res-piration by a factor of four to eight. Carbon assimilation was discernible about 10 days later (Fig. 1, 2 and 4). In years with a regular rainy season (1999/2000) the canopy reached its uptake capacity of around 15 µmol m−2s−1 (or 400–450 mmol m−2d−1)within about two months. Assimi-lation and respiration rates remained balanced for a large part
Q (µmol m-2 s-1) 200 400 600 800100012001400160018002000 A ( µmol m -2 s -1 ) 0 2 4 6 8 10 12 14 -5 - 09 - 11 15 20 - 21 53 Q (µmol m-2 s-1) 200400600800100012001400160018002000 0 2 4 6 8 10 12 14 4 - 9 11 - 12 27 42 1999-2000 2000-2001 A ( µmo l m -2 s -1 ) 0 1 2 3 4 5 6 7 8 9 20 - 23 * 24 * 25 - 26 35 - 36 48 - 50 0 1 2 3 4 5 6 7 8 9 3 - 8* 9 * 27 * 29 38 61 - 62 Scots pine 1999 2000 A ( µmo l m -2 s -1 ) 0.0 0.4 0.8 1.2 1.6 2.0 2.4 2.8 3.2 20 - 25 * 26 27 35 - 36 48 - 50 0.0 0.4 0.8 1.2 1.6 2.0 2.4 2.8 3.2 3 - 8 * 22 - 29 * 36 38 61 - 63 Mire 1999 2000 0 2 4 6 8 10 12 14 3 - 8 * 29 * 41 - 42 49 - 50 63 - 64 Mire 2000 Downy birch Mopane Mopane Scots pine
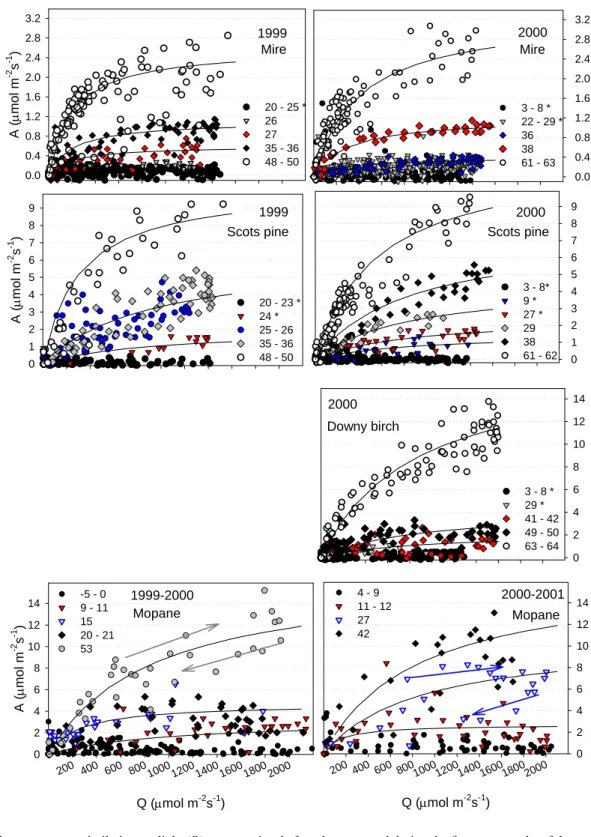
Fig. 4. Example ecosystem assimilation vs. light (Q) response just before the onset and during the first two months of the active period. The
numbers denote the days of the active period (see also Figs. 1 and 3). Stars indicate data from periods before completion of snowmelt in Siberia. Lines follow the hyperbolic light-response and are drawn to guide the eye.
On some days, the data from the Mopane woodland reveal a strong hysteresis between morning and afternoon values (arrows), likely due to stomatal closure at high air saturation deficit in the afternoon.
Air temperature (oC) 0 5 10 15 20 25 30 R ( µmol m -2s -1) 0 5 10 15 day 0 50 100 150 200 R10 ( µmo l m -2s -1) 1 2 3 4 5 6 Air temperature (oC) 0 5 10 15 20 25 30 R ( µmol m -2 s -1 ) 0 5 10 15 soil moisture < 5% soil moisture > 9% Mopane NEE ( µmo l m -2s -1 1 ) 0 4 8 12 16 Birch
Fig. 5. Half-hourly ecosystem respiration vs. air temperature in the
Siberian birch forest (top panel) and the Mopane woodland (bottom panel). Data were chosen to cover the entire range of air tempera-tures observed during the measurement period, lines are calculated from an Arrhenius type equation (Lloyd and Taylor, 1994) using for both ecosystems an average R10of 1.5 µmol m−2s−1. At the
Mopane site, data are grouped by volumetric soil moisture in the top 10 cm, with triangles measured during very dry conditions (<5%), and circles measured during periods with regular rain (>9%). The inset in the Mopane woodland shows nighttime NEE at the onset of the active season (days −2 to 5), the arrow indicating the response to a 10 mm rain event on 26 November. The inset in the top panel, birch, shows the seasonal variation in average respiration rates at a temperature of 10◦C (R10). Grey (circled) are data from days ca.
140–160, corresponding to just before and at the onset of leaf litter fall when R10exceeded 2.5 µmol m−2s−1. For further details see text.
of the early active season, and days with positive NEE were observed throughout; it was only after the rains had started to cease that A exceeded R and NEE became negative for a prolonged period (Fig. 1, 2; Veenendaal et al., 2004).
In the Siberian birch forest, daily R doubled from 50 to 100 mmol m−2d−1within 5 days of average positive air tem-peratures. Leaf-emergence was accompanied by a further, distinct increase in R (Figs. 2, 3). Simultaneously,
respi-ration rates expressed at 10 degrees (R10; Lloyd and
Tay-lor, 1994) increased rapidly from 1.3 to 1.8 µmol m−2s−1
(Fig. 5 inset, arrow), providing evidence to this rise in R be-ing caused by physiological activity (i.e., the growth respira-tion of the new leaves as well as enhanced tree root and fun-gal or microbial growth and turnover) rather than by warm-ing temperatures alone. Assimilation accelerated another 10 days later, when rates increased rapidly to values up to 1000 mmol m−2d−1. For the major part of the active sea-son daily birch forest assimilation exceeded rates in the other three ecosystems by a factor of up to three.
From NEE data alone one can only but speculate whether the observed step-increase in respiration rates early in the ac-tive season may be a general feature of deciduous forests irre-spective of their growth environment or leaf-type. It has been observed in a deciduous coniferous larch forest of Eastern Siberia (where rates quite suddenly increased from less than 1 µmol m−2s−1to maxima around 5 µmol m−2s−1; Dolman
et al., 2004), as well as in the temperate biome (Granier et al., 2002), yet it was notably absent from the Scots pine forest and from mixed evergreen dark taiga forests growing nearby the Betula stand (R¨oser et al., 2002). It may well represent an important evolutionary trait of the entire system. Warm-ing sprWarm-ing temperatures accelerate fungal and/or microbial activity (Clein and Schimel, 1995) and hence nutrient min-eralization, which occurs simultaneously with enhanced root activity by the trees as leaves emerge. The sharp respira-tion increase thus is most likely not limited to autotrophic growth respiration but it includes a significant heterotrophic component, pointing towards a finely tuned system-level in-teraction between tree-root nutrient demand and supply via decomposers. Still, separate cuvette measurements on soil, stem and leaf level would be required to investigate these processes in more detail.
Throughout the year, an ecosystems’ “capacity” for res-piration varies since plant growth and maintenance respi-ration, and heterotrophic activity respond rather plastically to varying environmental conditions (e.g., Law et al., 1999; Arneth et al., 2002a; Shibistova et al., 2002; Atkin and Tjoelker, 2003; Pendall et al., 2004). Over a period of weeks to months, the exponential respiration-temperature response which typically dominates the short-term variation in respi-ration rates is thus mediated by additional factors, like avail-able soil moisture or phenology. Hence for instance the clear increase in R10 associated with leaf growth in the birch
for-est indicated above. Later in the year, a further steep in-crease in respiration rates (day 130 to 160; Fig. 5, circled & grey data) was equally unrelated to changes in air tem-perature. During this period, R10 rose rapidly from values
around 1.8 µmol m−2s−1to close to 5 µmol m−2s−1, such that at air temperatures of 8–12◦C respiration rates were sim-ilar to those measured during the warmest parts of the year. It is unlikely that sudden changes in soil moisture played a major role, these data were collected at the end of August 2000 which saw sufficient rain (Arneth et al., 2002a). Leaf
fall in the birch forest began around day 150, identified from the rapidly increasing ratio of radiation measured below and above the canopy (not shown). A rapid decomposition of rel-atively labile carbon readily available in the fresh litter might have explained the rapid increases in R10 and respiration
rates – except that the observed increase in R10preceded
lit-ter fall. It is unclear whether the spot radiation measurements that serve as indicator for changes in canopy LAI were suffi-ciently precise to represent the entire forest; there may well have been some shedding of leaves that was not picked up by the radiation sensors. However, autumnal leaves when still attached contain proteases and proteins that are associated with respiration and the breakdown of molecules (Bhalerao et al., 2003), and broad-leaf trees generally appear to either maintain or increase leaf respiration during senescence (Col-lier and Thibodeau, 1995). The remobilisation of leaf nutri-ents therefore is likely the cause for the observed autumnal increase in Betula respiration before the onset of leaf fall.
In the Botswana Mopane woodland, respiration rates ac-celerated immediately after the first rains (Figs. 1, 2, 5 in-set). Afterwards, mean rates increased with continuation of the rainy period as the soil moisture storage became replen-ished – which fosters microbial as well as root activity –, but with additional pulse-responses observed after rain events. A combined physical and biological response of CO2efflux
in response to environmental factors is typical for season-ally dry environments. As a consequence, there was a clear separation of respiration rates being higher at a given tem-perature when soil moisture measured over 10 cm depth ex-ceeded 9%, compared to rates when soil moisture was below 5% (Fig. 5). In the moisture range between 5 and 9% the sep-aration was less obvious. Short rain events, wetting only the surface, would not necessarily have been clearly visible in the soil moisture sensors. But they could still lead to imme-diate CO2efflux, partially due to a response of microbes and
roots growing very close to the soil surface, but also due to physical effects of wind-related pressure fluctuations on CO2
efflux from porous soils (Kimball and Lemon, 1971). Such pulse-respiration responses, smaller in magnitude, have also been found for the Siberian pine and larch forests (e.g., Kel-liher et al., 1999; Dolman et al., 2004) and they conceal the respiration-temperature relationship (Arneth et al., 1998).
Maximum instantaneous A in birch and Mopane were more or less identical after about two months into the ac-tive season (12–14 µmol m−2s−1, Fig. 4). It is not possible across biomes to extrapolate from maximum uptake to daily integrals because of, in this case, the dissimilar number of daylight hours (Q>20 µmol m−2s−1for 17 h in Siberia, vs.
12 h in Botswana), as well as a pronounced hysteresis such that Mopane carbon assimilation rates were distinctly lower in the afternoon when stomata closed during periods of high air saturation deficits (Fig. 4, arrows). This hysteresis nearly completely obliterated the typical hyperbolic assimilation – light response at the Botswana site for some days. While A of the Mopane peaked around 15 µmol m−2s−1, canopy
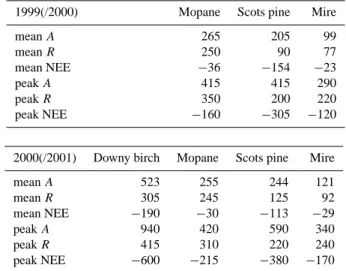
assim-Table 1. Average and peak daily rates of ecosystem assimila-tion during the photosynthetic period (c.f., Figs. 1 and 2), as well as average and maximum rates of respiration and NEE (all in mmol m−2d−1). Maximum values are the average of the peak five values.
1999(/2000) Mopane Scots pine Mire
mean A 265 205 99 mean R 250 90 77 mean NEE −36 −154 −23 peak A 415 415 290 peak R 350 200 220 peak NEE −160 −305 −120
2000(/2001) Downy birch Mopane Scots pine Mire
mean A 523 255 244 121 mean R 305 245 125 92 mean NEE −190 −30 −113 −29 peak A 940 420 590 340 peak R 415 310 220 240 peak NEE −600 −215 −380 −170
ilation of the birch canopy continued to increase to summer maxima close to 30 µmol m−2s−1, resulting in maximum
daily active season A of about twice the one in Botswana (R¨oser et al., 2002; Veenendaal et al., 2004). Therefore, when all four systems are summarised side by side (Table 1), it is the Betula stand that during the active period had the highest average daily rates of A, R and highest instantaneous (half-hourly) assimilation (but not respiration, c.f. Fig. 5), whereas the mire had lowest rates. These convert into high-est and lowhigh-est mean and peak NEE during the period of car-bon assimilation for the Betula stand and the mire, respec-tively. It is problematical to assess these results in terms of more a comprehensive ranking of ecosystem NEE based on the FLUXNET data set (Falge et al., 2002), since this has been performed for maxima, minima and averages of instan-taneous (hourly or half-hourly) net exchange – whereas our focus lies with daily rates, and the physiologically defined components A and R. But our results emphasise the fact that if a grouping of ecosystems in terms of their carbon-atmosphere exchange is to be possible at all, a large number of studies is required from both hemispheres representing all ecosystem types in a region, to separate effects of climate from those of phenology, vegetation type, ecosystem age and history (Falge et al., 2002).
In the Scots pine forest, assimilation rates were of the same order of magnitude as observed in the Mopane woodland, whereas respiration rates were more similar to the mire. An-nual NEE of the Scots pine forest exceeded net uptake in the mire by a factor of five to six (ca. −13 vs. −2 to −3 mol m−2; Arneth et al., 2002a; Lloyd et al., 2002) while the Mopane woodland was nearly carbon neutral (Veenendaal et al.,
2004); uptake during the “green” period in the Betula stand was −25 mol m−2. Assuming an average daily winter loss of
45 mmol m−2, based on the pre-melt CO
2efflux measured in
the Betula stand (R¨oser et al., 2002), would result in an an-nual total of ca. −13 mol m−2, similar to the best-guess for the pine forest growing just across the river. But likely, these speculated winter losses are too high, as the measurements in spring had begun when soil temperatures would have already warmed to a certain degree. Therefore, it is very likely that NEE in the Betula forest was highest (most negative) of the four systems compared here.
4.2 Canopy carbon-water relations in seasonal environ-ments
A well established hypothesis that seeks to combine the co-nundrum of plant water loss and carbon uptake argues that stomata serve to optimise the two by minimising water loss per carbon gain (Cowan, 1977, 1982). This concept has been applied successfully on the leaf level, and can be mathemat-ically expressed in a linearised way as
Gs =Aλ0.5/[D(Ca−0)/1.6]0.5,
where Gs is stomata (canopy-, or surface-, see below) con-ductance, D is air saturation deficit at the leaf or canopy level, Ca is ambient carbon dioxide concentration, and 0 is the CO2 compensation point (Lloyd, 1991; Lloyd et al.,
1995). Hence, plotting Gs vs. A/[D(Ca– 0)/1.6]0.5yields a slope equivalent to λ0.5, where λ is a Lagrange multiplier de-noting the leaf’s marginal water use per carbon gain, which should remain constant over a period of one to few days at least. Large values of lambda are typically found for plants with a non-conservative water use.
The above expression has been successfully applied in a big-leaf approach to analyse the Scots pine canopy photo-synthesis and conductance (Lloyd et al., 2002). It also pro-vided the basis to interpret a tree-ring stable carbon isotope record in stems of Scots pine trees growing few hundred me-tres from the pine forest flux tower (Arneth et al., 2002b). Extending this analysis from the tree canopy to the entire ecosystem would be problematic in a multilayer-canopy with distinct understorey vegetation, due to the contribution of below canopy carbon and water fluxes to the measured to-tal. But the three forests compared here have little ground vegetation and for that reason the day-to-day variation in as-similation and evapotranspiration during the active season will be dominated by processes taking place at the canopy level. Thus, as our main focus lies with the relative ecosys-tem response to seasonal changes in weather and phenology the analysis can be adopted on that scale. Gs in the equa-tion above is consequently surface conductance, calculated from measured latent heat fluxes using the Penman-Monteith equation (e.g., Kelliher et al., 1993), and A is ecosystem assimilation. A similar analysis is not useful for the mire.
There, the stomata of vascular plant control an unknown, sea-sonally strongly varying and often small proportion of the total water vapour flux, or of the carbon assimilated. A size-able percentage of carbon and/or water fluxes would have been via Sphagnum and other mosses, or free water surfaces. Figure 6 shows the above relationship for the two decidu-ous ecosystems, the data being grouped into 30-day intervals from early on in the active season. The lines are linear regres-sions, and for reasons of clarity are shown for a select number of periods only (but c.f., Fig. 7). Offsets of the regressions were typically less than ±0.03 mol m−2s−1. Considering the inherent scatter in eddy flux data, and the uncertainties and potential sources of error associated with deriving assimila-tion and surface conductance from flux measurements, these are unlikely to be significantly different from zero and sub-sequently the regressions were all plotted through the origin, which facilitates the comparison.
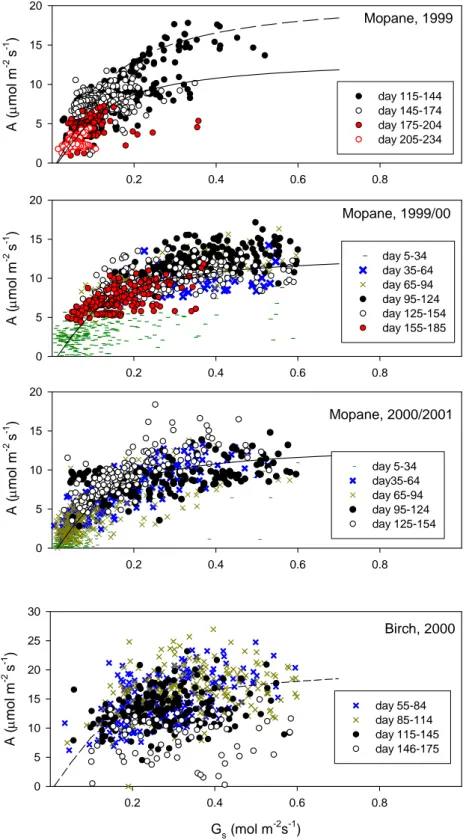
There are two important observations to be made. Firstly, the slopes of the linear regressions in the Siberian birch (33 to 43, suggesting λ around 1100–1800 mol mol−1)were gener-ally about half to two thirds of the ones found for the Mopane woodland throughout the 1999/2001 and 2000/2001 rainy season. In other words, the high assimilation rates of the birch canopy were achieved at a relatively more conservative water use compared to the generally lower assimilation rates at considerably more aggressive water use in the Mopane woodland – despite the latter growing in a hot climate, with dry spells even during the rainy season. Still, the maximum regression slope of the birch forest was 1.5 times the one cal-culated for the Scots pine canopy, where slopes were 20 and 29 in the two consecutive years 1999 and 2000 (Lloyd et al., 2002).
The second observation to be made is the presence or ab-sence of a month-to-month or year-to-year variation in the respective canopy’s water use strategy, which is reflected in this slope. For instance, for the data from the Mopane woodland during and after the rainy season 1999 (Fig. 6, top panel) slopes during consecutive 30-day periods were sim-ilar or only little higher than those calculated for the birch forest, and in both ecosystems variation between the periods shown was rather small when compared to the 1999/2000 and 2000/2001 Mopane data. In the Siberian Scots pine canopy, a noteworthy monthly variation of the canopy’s water use within a season was equally absent, but a significant differ-ence in slope was observed between the two years 1999 and 2000, which was apparent already from very early on in the growing season on canopy and whole ecosystem level (Lloyd et al., 2002; Arneth et al., 2006).
In other years, however, in the Mopane woodland vari-ation of the ecosystem’s water use strategy could well be large, the slopes varying by 50% and more within one ac-tive season, sometimes even from one period to the next (c.f. in 2000/1). This variation was not progressive in the sense, that it did not reflect a gradual change in the woodland’s wa-ter use as the active season progressed. This could well have
0.000 0.005 0.010 0.015 0.020 Gs (m ol m -2 s -1 ) 0.0 0.2 0.4 0.6 0.8 day 115-144 day 145-174 day 175-204 day 205-234 0.000 0.005 0.010 0.015 0.020 Gs (m ol m -2 s -1 ) 0.0 0.2 0.4 0.6 0.8 day 5-34 day 35-64 day 65-94 day 95-124 day 125-154 day 155-184 0.000 0.005 0.010 0.015 0.020 Gs (m ol m -2 s -1 ) 0.0 0.2 0.4 0.6 0.8 day 5-34 day 35-64 day 65-94 day 95-124 day 125-154 A/[D(Ca - Γ )/1.6]0.5 0.000 0.005 0.010 0.015 0.020 Gs (m o l m -2 s -1 ) 0.0 0.2 0.4 0.6 0.8 day 55-84 day 85-114 day 115-144 day 145-174 Mopane, 1999 Mopane, 1999/00 Mopane, 2000/01 Birch, 2000
Fig. 6. Average surface conductance for water vapour vs. A/[D(Ca– 0)/1.6]0.5in the two deciduous forests, Mopane and Betula. The data are grouped into 30-day intervals, which were collected at the Mopane woodland between March and June 1999, December 1999 and June 2000, and December 2000 and June 2001, respectively (top three panels). The bottom panel shows the data from the Siberian birch forest between May and September 2000. Lines are linear regressions, for reasons of clarity only example regressions are plotted for the Mopane data.
Data were taken from high light conditions (Botswana, Q>1200; Siberia: Q>800 µmol m−2s−1), excluding data shortly after rain events, when Gs were unusually high due to water evaporation from wet surfaces. However the shown relationships hold over the entire daytime data-set although the scatter increases.
average D (mbar) 0 5 10 15 20 25 30 Sl ope of A/[D (C a - Γ) /1.6] 0. 5 0 20 40 60 80 100
average soil water deficit (m3 m-3)
0.00 0.05 0.10 0.15 0.20 Slope of A /[D (C a - Γ) /1.6] 0.5 0 20 40 60 80 100
Fig. 7. The relationship of the slope of the regressions shown in Fig. 6 vs. average daily air saturation deficit (top panel) and soil water deficit (using the maximum value observed in the field, 0.17 m3m−3as upper limit) in the top 10 cm (bottom panel). Soil moisture data were only available for the Mopane site and after November 1999. Circles denote data from the Mopane woodland, with one outlier from the very early days of the growing season in black. Triangles denote data from the birch forest.
been plausible due to, e.g., aging leaves or the refill of the soil profile with water. Nevertheless the slope of the relationship, and thus ecosystem λ, should be related to some degree to variation in air saturation deficit and/or soil water supply as both significantly constrain Gs. Soil moisture content and air saturation deficit naturally vary in concert, hence D was higher on average during periods with little or no rain (not shown). In a simple analysis, the observed variation in the ecosystems water use strategy was therefore plotted against variation in average D (Fig. 7, top panel) and average daily soil moisture deficit in the top 10 cm (bottom panel). One outlier was observed during the very early stages of the ac-tive season 1999/2000, when the leaves were just emerging, but for the remainder up to 70% of the variation could be ex-plained that way. The overall lower slopes observed in the second half of the rainy period 1998/1999 for the Mopane canopy (Fig. 6, top panel) thus may well reflect the low total amount of precipitation received, as the summer 1998/1999 was relatively dry (total precipitation <400 mm). This anal-ysis indicates a strong constraint by dry and hot conditions
on variations in Mopane λ – but also a surprisingly non-conservative water use overall when put into a larger biogeo-graphical context. For the Siberian birch forest, soil moisture data were not available, but no obvious relationship existed with average D (Fig. 7). Yet, D varied much less in the con-tinental climate over an active season compared to the semi-arid tropics, and in any case, four months of data limit the interpretation.
It is well established in the ecophysiological literature that leaf level λ, or water use efficiency, do not necessarily re-main constant over periods longer than few days (Schulze and Hall, 1982). But on ecosystem level, the plasticity in the “aggressiveness” with which the vegetation can use the available water has only been recognised recently. Lloyd et al. (2002) did not find obvious monthly variation in λ for the Siberian Scots pine canopy, even though precipitation during some summer months was as low as 30 mm during the two study years (Arneth et al., 2002a). However, the significant difference in λ between years was evident right from the on-set of the active period. In Scots pine trees growing nearby the Siberian eddy flux tower, the variation in stem cellu-lose carbon isotope ratios could be explained using a coupled assimilation-conductance model that accounted for a reduc-tion of stomatal conductance, and λ, as soils dried (Arneth et al., 2002b). Since it is the combination of water and nutri-ent availability that influences stomatal and canopy conduc-tance, photosynthetic capacity and hence water use strate-gies, the history in environmental conditions (e.g., soil water table level, soil temperatures) may be an important factor to explain variation in λ on interannual time steps. For instance, the availability and partitioning of carbohydrates for fine root growth can affect both present but also subsequent water and nutrient uptake – even in the following season, which may explain the observations made in the Siberian pine forest (Lloyd et al., 2002). A similar possibility was brought up to interpret results from soil warming experiments of Scots pine stands in Sweden, where effects of the previous years’ warming were detected in the subsequent years’ transpira-tion (Mellander, 2003). For the Mopane woodland, the data indicate a rather more rapid response of canopy conductance to current environmental constraints, whereas it is unfortu-nately unknown whether λ in the Downy birch forest would vary between years.
In the context of these observations it is also of inter-est to invinter-estigate how much a variation in ecosystem pho-tosynthetic capacity would contribute to the variation in λ, due to the close coupling of assimilation and transpiration via the stomata. Figure 8 illustrates the relationship be-tween ecosystem assimilation and surface conductance for the periods shown in Fig. 6, displaying the typical satura-tion of A at high values of G with a very small offset being due to the use of surface values. This relationship can be examined in terms of the carboxylation efficiency, k (e.g., Lloyd et al., 2002), since a higher k results in higher rates of carbon assimilation at a given Gs. When the data was
0.2 0.4 0.6 0.8 A ( µmo l m -2 s -1 ) 0 5 10 15 20 day 115-144 day 145-174 day 175-204 day 205-234 0.2 0.4 0.6 0.8 A ( µmo l m -2 s -1 ) 0 5 10 15 20 day 5-34 day 35-64 day 65-94 day 95-124 day 125-154 day 155-185 0.2 0.4 0.6 0.8 A ( µmo l m -2 s -1 ) 0 5 10 15 20 day 5-34 day35-64 day 65-94 day 95-124 day 125-154 Mopane, 1999 Mopane, 1999/00 Mopane, 2000/2001 Birch Gs (mol m-2s-1) 0.2 0.4 0.6 0.8 A ( µmo l m -2 s -1 ) 0 5 10 15 20 25 30 day 55-84 day 85-114 day 115-145 day 146-175 Birch, 2000
Fig. 8. The relationship of ecosystem assimilation and surface conductance. For clarity data were selected for high light conditions. The
top three panels show the relationship in the semi-arid Mopane forest (Q>200 µmol m−2s−1), the bottom panel for the Siberian birch (Q>800 µmol m−2s−1). Lines follow the relationship [k(Ca−0)/(1+k/Gs)], where 0= photosynthetic compensation point, Ca= CO2
plotted that way some intriguing monthly and interannual differences in k were discernible – the second half of the rainy season 1998/1999 standing out in particular for the Mopane woodland, when ecosystem carboxylation efficiency for some time exceeded the values calculated for the follow-ing rainy seasons notably, with a proportion of the data de-fined by k=0.085 mol m−2s−1bar−1. This value was more or less identical to the average carboxylation efficiency of the Siberian Downy birch forest, where the scatter in the data was, however, much higher. During 1999/2000 and 2000/2001, and also for parts of the 1998/1999 rainy sea-son, k in the Mopane woodland were considerably lower. In the figure, identical lines with k=0.061 are drawn for all three Mopane rainy season data sets. With the exception of 1999, most of the data suggest relatively minor variation in k, some periods having little higher (e.g., days 95–124 in 1999/2000, and 125–154 in 2001/2002), or lower values on average (data from days 95–124 in 2000/2001). This variation was not re-lated to variation in the water use strategy shown in Fig. 6. For instance, λ was 3025 and 4900 in the two example peri-ods with k>0.061, compared to 3360 for the example period with k slightly below 0.061. These observations contrast the pattern observed for the Siberian Scots pine canopy, where k were 0.056 and 0.062 for the two consecutive years, respec-tively, but in this case higher k did coincide with higher λ (Lloyd et al., 2002).
4.3 Summary
Not surprisingly, in highly seasonal environments ecosys-tem activity accelerates immediately as soon as suitable cli-mate conditions set-in. The character of this initial response varies, however. In the four examples presented here, it was dominated by assimilation in the evergreen conifer forest and by respiration in deciduous canopies, whereas in the mire A and R increased more or less simultaneously. Where new leaves need to be grown at the onset of the active period, the initial respiration response may be an important adap-tation on the system level, reflecting not only autotrophic growth respiration but also stimulation of mineralization, which makes nutrients available for uptake by the tree roots. Overall, the two deciduous systems had the highest rates of respiration throughout most of the active season, despite the very different growth environments compared here. In terms of instantaneous and integrated R, A, or NEE, there was no obvious general difference between Siberian ecosystems on the one hand, and the woodland from the semi-arid tropics on the other; this result is, however, limited by the fact that ecosystem flux studies from tropical savannas and woodlands are extremely scarce.
Our observations made under a broad range of climate conditions speak for the capability of forests to respond in a resilient way in terms of their water use strategy. The lat-ter may vary significantly between years and even between months, as a result of either short-term weather fluctuations
or as longer term effects of carbon allocation and growth. Of the three forests compared here, it was the Mopane stand in the semi-arid environment that had the least conservative wa-ter use strategy during periods when soil wawa-ter was available; however, the response of the canopy could change rapidly to low values of λ (implying a more moderate water use) dur-ing sporadic dry periods, or in rainy seasons with low pre-cipitation overall. Considering the fickle nature of rainfall in the semi-arid tropics the non-conservative water use dur-ing times when water is available as a resource, combined with a rapid response to periods with no or little rain may help to optimise carbon gain over the entire active period. In these latter periods, values of λ approached those observed in the deciduous Siberian birch, but were still higher than those calculated for the Scots pine canopy. While some vari-ation in photosynthetic capacity was evident, it appears that in Mopane most of the observed variation in system water use strategy was related to changes in canopy conductance. Acknowledgements. The flux measurements in Siberia were supported by the European Commission in the project EuroSiberian Carbonflux. A. Arneth acknowledges support from New Zealand Foundation for Research, Science and Technology for the research in Siberia and from the Deutsche Forschungsgemeinschaft for the research in Botswana. A multitude of people from the MPI Biogeochemistry in Jena and from the Krasnoyarsk Forest Institute contributed with skill and patience to the maintenance of the eddy flux sites in Siberia.
Edited by: T. Laurila
References
Arneth, A., Kelliher, F. M., Gower, S. T., Scott, N. A., Byers, J. N., and McSeveny, T. M.: Environmental variables regulating soil carbon dioxide efflux following clear-cutting of a Pinus radiata D. Don plantation, J. Geophys. Res., 103, 5695–5705, 1998. Arneth, A., Kurbatova, J., Kolle, O., Shibistova, O., Lloyd, J.,
Vygodskaya, N. N., and Schulze, E.D.: Comparative ecosystem -atmosphere exchange of energy and mass in a European Russian and a central Siberian bog II. Interseasonal and interannual vari-ability of CO2fluxes, Tellus, 54 B, 514–530, 2002a.
Arneth, A., Lloyd, J., ˇSantrukov´a, H., Bird, M., Grigoriev, S., Gleixner, G., and Schulze, E.-D.: Response of central Siberian Scots pine in to soil water deficit and long-term trends in at-mospheric CO2concentration, Global Biogeochem. Cycles, 16,
5/1–5/13, 2002b.
Arneth, A., Lloyd, J., Shibistova, O., and Kolle, O.: Snow melt in the boreal environment: exploring spring energy and CO2 fluxes in two typical central Siberian ecosystems, Boreal Environ. Res., in press, 2006.
Atkin, O. K. and Tjoelker, M. G.: Thermal acclimation and the dynamic response of plant respiration to temperature, Trends in Plant Science, 8, 343, 2003.
Aurela, M., Laurila, T., and Tuovinen, J. P.: The timing of snow melt controls the annual CO2balance in a subarctic fen, Geo-phys. Res. Lett., 31, L16119, doi:10.1029/2004GL020315, 2004.
Bhalerao, R., Keskitalo, J., Sterky, F., Erlandsson, R., Bjorkbacka, H., Birve, S. J., Karlsson, J., Gardestrom, P., Gustafsson, P., Lun-deberg, J., and Jansson, S.: Gene expression in autumn leaves, Plant Physiology, 131, 430–442, 2003.
Bond, W. J., Woodward, F. I., and Midgley, G. F.: The global dis-tribution of ecosystems in a world without fire, New Phytologist, 165, 525–538, 2005.
Bowman, D. and Prior, L. D.: Why do evergreen trees dominate the Australian seasonal tropics?, Australian Journal of Botany, 53, 379–399, 2005.
Choudhury, B. J.: Relationships between vegetation indices, radia-tion absorpradia-tion, and net photosynthesis evaluated by a sensitivity analysis, Remote Sens. Environ., 22, 209–233, 1987.
Choudhury, B. J., Ahmed, N. U., Idso, S. B., Reginato, R. J., and Daughtry, C. S. T.: Relations between evaporation coefficients and vegetation indices studied by model simulations, Remote Sens. Environ., 50, 1–17, 1994.
Clein, J. S. and Schimel, J. P.: Microbial activity of tundra and taiga soils at sub-zero temperatures, Soil Biology and Biochemistry, 27, 1231–1234, 1995.
Collier, D. E. and Thibodeau, B. A.: Changes in respiration and chemical content during autumnal senescence of Populus tremu-loides and Quercus rubra leaves, Tree Physiology, 15, 759–764, 1995.
Cowan, I. R.: Stomatal behaviour and environment, Advances in Botanical Research, 4, 117–128, 1977.
Cowan, I. R.: Regulation of water use in relation to carbon gain in higher plants, p. 589–613 in: Physiological Plant Ecology II. Water Relations and Carbon Assimilation, edited by: Lange, O. L., Nobel, P. S., Osmond, C. B., and Ziegler, H., Springer, Berlin, 1982.
Cox, P. M., Betts, R. A., Jones, C. D., Spall, S. A., and Totterdell, I. J.: Acceleration of global warming due to carbon-cycle feed-backs in a coupled climate model, Nature, 408, 184–186, 2000. Dolman, A. J., Maximov, T. C., Moors, E. J., Maximov, A. P.,
El-bers, J. A., Kononov, V., Waterloo, M. J., and v. d. Molen, M. K.: Net ecosystem exchange of carbon dioxide and water of far eastern Siberian Larch (Larix cajanderii) on permafrost, Biogeo-sciences, 1, 133–146, 2004,
http://www.biogeosciences.net/1/133/2004/.
Eklundh, L. and Olsson, L.: Vegetation index trends for the African Sahel 1982–1999, J. Geophys. Res., 30, 1430, doi:10.1029/2002GL016772, 2003.
Eugster, W. and Senn, W.: A cospectral correction model for mea-surement of turbulent NO2flux, Boundary-Layer Meteorol., 74,
321–340, 1995.
Falge, E., Tenhunen, J., Baldocchi, D., Aubinet, M., Bakwin, P., Berbigier, P., Bernhofer, C., Bonnefond, J. M., Burba, G., Clement, R., Davis, K. J., Elbers, J. A., Falk, M., Goldstein, A. H., Grelle, A., Granier, A., Grunwald, T., Gudmundsson, J., Hollinger, D., Janssens, I. A., Keronen, P., Kowalski, A. S., Katul, G., Law, B. E., Malhi, Y., Meyers, T., Monson, R. K., Moors, E., Munger, J. W., Oechel, W., U, K. T. P., Pilegaard, K., Rannik, U., Rebmann, C., Suyker, A., Thorgeirsson, H., Tirone, G., Turnipseed, A., Wilson, K., and Wofsy, S.: Phase and ampli-tude of ecosystem carbon release and uptake potentials as derived from FLUXNET measurements, Agric. For. Meteorol., 113, 75– 95, 2002.
Foley, J. A., Costa, M. H., Delire, C., Ramankutty, N., and
Sny-der, P.: Green surprise? How terrestrial ecosystems could affect earth’s climate, Frontiers in Ecology and Environment, 1, 38–44, 2003.
Friedlingstein, P., Bopp, L., Ciais, P., Dufresne, J.-L., Fairhead, L., LeTreut, H., Monfray, P., and Orr, J.: Positive feedback between future climate change and the carbon cycle, Geophys. Res. Lett., 28, 1543–1546, 2001.
Gamache, I. and Payette, S.: Height growth response of tree line black spruce to recent climate warming across the forest-tundra of eastern Canada, J. Ecology, 92, 835–845, 2004.
Granier, A., Pilegaard, K., and Jensen, N. O.: Similar net ecosystem exchange of beech stands located in France and Denmark, Agric. For. Meteorol., 114, 75, 2002.
Hanan, N., Kabat, P., Dolman, A. J., and Elbers, J. A.: Photosyn-thesis and carbon balance of a Sahelian fallow savanna, Global Change Biology, 4, 523–538, 1998.
Heimann, M.: The Eurosiberian Carbonflux project, Tellus, 54B, 417–419, 2002.
H´ely, C., Bremond, L., Alleaume, S., Smith, B., Sykes, M. T., and Guiot, J.: Sensitivity of African biomes to changes in precipi-tation regime, Global Ecology and Biogeography, Global Ecol. Biogeogr., 15(3), 258–270, 2006.
Hickler, T., Eklundh, L., Seaquist, J., Smith, B., Ard¨o, J., Olsson, L., and Sj¨ostr¨om, M.: Precipitation controls Sahel greening trend, Geophys. Res. Lett., 32, L21415, doi:10.1029/2005GL024370, 2005.
Holtmeier, F. K. and Broll, G.: Sensitivity and response of north-ern hemisphere altitudinal and polar treelines to environmental change at landscape and local scales, Global Ecology and Bio-geography, 14, 395–410, 2005.
Jarvis, P. J. and Linder, S.: Constraints to growth of boreal forests, Nature, 405, 904–905, 2000.
Jonsdottir, I. S., Virtanen, R., and Karnefelt, I.: Large-scale differ-entiation and dynamics in tundra plant populations and vegeta-tion, Ambio, 28, 230–238, 1999.
Justice, C. O., Vermote, E., Townshend, J. R. G., Defries, R., Roy, D. P., Hall, D. K., Salomonson, V. V., Privette, J. L., Riggs, G., Strahler, A., Lucht, W., Myeni, R. B., Knyazikhin, Y., Running, S. W., Nemani, R. R., Wan, Z., Huete, A. R., Leeuwen, W. V., Wolfe, R. E., Giglio, L., Muller, J.-P., Lewis, P., and Barns-ley, M. J.: The Moderate Resolution Imaging Spectroradiome-ter (MODIS): Land remote sensing for global change research, IEEE Trans. Geosci. Rem. Sens., 36, 1228–1249, 1998. Kaplan, J., Bigelow, N. H., Prentice, I. C., Harrison, S., Bartlein, P.
J., Christensen, T. R., Cramer, W., Matveyeva, N. V., McGuire, A. D., Murray, D. F., Razzhivin, V. Y., Smith, B., Walker, D., Anderson, P. M., Andreev, A. A., Brubaker, L. B., Edwards, M. E., and Lozhkin, A. V.: Climate change and Arctic ecosystems: 2. Modelling, paleodata-model comparisons, and future projec-tions, J. Geophys. Res., 108, 8171, doi:10.1029/2002JD002558, 2003.
Kelliher, F. M., Leuning, R., and Schulze, E.-D.: Evaporation and canopy characteristics of coniferous forests and grasslands, Oe-cologia, 95, 153–163, 1993.
Kelliher, F. M., Lloyd, J., Arneth, A., Luhker, B., Byers, J. N., Mc-Seveny, T. M., Milukova, I., Grigoriev, S., Panfyorov, M., So-gatchev, A., Varlargin, A., Ziegler, W., Bauer, G., Wong, S. C., and Schulze, E. D.: Carbon dioxide efflux density from the floor of a central Siberian pine forest, Agric. For. Meteorol., 94, 217–

![Fig. 6. Average surface conductance for water vapour vs. A/[D(C a – 0)/1.6] 0.5 in the two deciduous forests, Mopane and Betula](https://thumb-eu.123doks.com/thumbv2/123doknet/14795090.603406/12.892.154.742.116.888/average-surface-conductance-vapour-deciduous-forests-mopane-betula.webp)