HAL Id: hal-01678451
https://hal.archives-ouvertes.fr/hal-01678451
Submitted on 16 May 2018
HAL is a multi-disciplinary open access
archive for the deposit and dissemination of
sci-entific research documents, whether they are
pub-lished or not. The documents may come from
teaching and research institutions in France or
abroad, or from public or private research centers.
L’archive ouverte pluridisciplinaire HAL, est
destinée au dépôt et à la diffusion de documents
scientifiques de niveau recherche, publiés ou non,
émanant des établissements d’enseignement et de
recherche français ou étrangers, des laboratoires
publics ou privés.
The dust attenuation of star-forming galaxies at z similar
to 3 and beyond: New insights from ALMA observations
Y. Fudamoto, P. A. Oesch, E. Schinnerer, B. Groves, A. Karim, B. Magnelli,
M. T. Sargent, P. Cassata, P. Lang, D. Liu, et al.
To cite this version:
Y. Fudamoto, P. A. Oesch, E. Schinnerer, B. Groves, A. Karim, et al.. The dust attenuation of
star-forming galaxies at z similar to 3 and beyond: New insights from ALMA observations. Monthly
Notices of the Royal Astronomical Society, Oxford University Press (OUP): Policy P - Oxford Open
Option A, 2017, 472 (1), pp.483-490. �10.1093/mnras/stx1948�. �hal-01678451�
arXiv:1705.01559v2 [astro-ph.GA] 25 May 2017
The Dust Attenuation of Star-forming Galaxies at z ∼ 3
and Beyond: New Insights from ALMA Observations
Y. Fudamoto
1⋆
, P. A. Oesch
1
, E. Schinnerer
2
, B. Groves
3
, A. Karim
4
,
B. Magnelli
4
, M. T. Sargent
5
, P. Cassata
6
, P. Lang
2
, D. Liu
2
, O. Le F`
evre
7
,
S. Leslie
2
, V. Smolˇ
ci´
c
8
, L. Tasca
7
1Observatoire de Gen`eve, 51 Ch. des Maillettes, 1290 Versoix, Switzerland 2Max Planck Institute for Astronomy, K¨onigstuhl 17, 69117 Heidelberg, Germany
3Research School of Astronomy and Astrophysics, Australian National University, Canberra, ACT 2611, Australia 4Argelander-Institut f¨ur Astronomie, Universit¨at Bonn, Auf dem H¨ugel 71, D-53121 Bonn, Germany
5Astronomy Centre, Department of Physics and Astronomy, University of Sussex, Brighton, BN1 9QH, UK
6Instituto de Fisica y Astronoma, Facultad de Ciencias, Universidad de Valparaiso, 1111 Gran Bretana, Playa Ancha Valparaso, Chile 7Aix-Marseille Universit´e, CNRS, LAM (Laboratoire d’Astrophysique de Marseille) UMR 7326, 13388 Marseille, France
8Faculty of Science University of Zagreb Bijeniˇcka c. 32, 10002 Zagreb, Croatia
Accepted XXX. Received YYY; in original form ZZZ
ABSTRACT
We present results on the dust attenuation of galaxies at redshift ∼ 3 − 6 by studying the relationship between the UV spectral slope (βUV) and the infrared excess (IRX;
LIR/LUV) using ALMA far-infrared continuum observations. Our study is based on
a sample of 67 massive, star-forming galaxies with a median mass of M∗∼ 1010.7M⊙
spanning a redshift range z = 2.6−3.7 (median z = 3.2) that were observed with ALMA at λr est = 300 µm. Both the individual ALMA detections (41 sources) and stacks
including all galaxies show the IRX–βUV relationship at z ∼ 3 is mostly consistent
with that of local starburst galaxies on average. However, we find evidence for a large dispersion around the mean relationship by up to ±0.5 dex. Nevertheless, the locally calibrated dust correction factors based on the IRX–βUVrelation are on average
applicable to main-sequence z ∼ 3 galaxies. This does not appear to be the case at even higher redshifts, however. Using public ALMA observations of z ∼ 4 − 6 galaxies we find evidence for a significant evolution in the IRX–βUVand the IRX–M∗ relations
beyond z ∼ 3 toward lower IRX values. We discuss several caveats that could affect these results, including the assumed dust temperature. ALMA observations of larger z >3galaxy samples will be required to confirm this intriguing redshift evolution. Key words: galaxies: ISM – galaxies: star formation – galaxies: evolution – submil-limetre: ISM
1 INTRODUCTION
One of the keys to understand the formation and evolution of galaxies is to estimate the star-formation activity of galaxies across cosmic times. Recent optical/near-infrared (NIR) ob-servations successfully measured the star formation rate den-sity (SFRD) of galaxies out to z ∼ 10 (e.g.Oesch et al. 2013,
2014; Ellis et al. 2013; Bouwens et al. 2015; McLeod et al. 2016), and showed that the SFRD steadily increases toward
⋆
E-mail: [email protected]
lower redshift, peaks around z ∼ 2–3, and then declines by an order of magnitude over the last seven billion years (e.g.
Hopkins & Beacom 2006;Madau & Dickinson 2014). However, a major caveat of current studies at z > 3 in particular is that most measurements of the SFRD rely on the rest-frame UV light from young, massive stars to es-timate the star formation rate of galaxies. This UV light is highly sensitive to obscuration by dust particles in the interstellar medium. The absorbed energy in the UV is re-emitted in infrared (IR) wavebands by the heated dust. As a result, a galaxy emits a considerable amount of energy in
2
Fudamoto et al.
the IR, which together with the UV luminosity provides a good measurement of the total star-formation of a galaxy (e.g. Elbaz et al. 2011;Symeonidis et al. 2013;Ivison et al. 2016). Without a direct detection of dust emission, however, one requires a well calibrated relation between total energy output from star formation activity and observed energy in UV to recover the total star formation rate (SFR) of galax-ies.
The useful quantities that parametrise the amount of obscuration are the UV spectral slope (βUV) and the in-frared excess (IRX ≡LIR/LUV). βUVis defined as a power law form of fλ∝ λβUV and thus describes galaxy colours in the
UV waveband, which are modulated by dust attenuation. Thus one naturally expects a relation between the βUVand the fraction of energy emitted by dust in the IR (i.e. IRX). The IRX–βUV relation has been well calibrated using lo-cal star bursting galaxies (Meurer et al. 1999;Overzier et al. 2011;Takeuchi et al. 2012;Casey et al. 2014). In particular, the local relation estimated inMeurer et al. (1999) is very widely used, and we will refer to it as M99 in the following. The locally calibrated IRX–βUV relation has been shown to be applicable to the general star-forming galaxy population at redshift z = 0–2 (e.g. Reddy et al. 2006;
Daddi et al. 2009; Pannella et al. 2009; Reddy et al. 2010;
Overzier et al. 2011;Sklias et al. 2014). However, it is not clear if the relation is still valid at z & 3, as the sample of individual IR detections is limited to the most luminous galaxies with extremely high SFR (e.g. Oteo et al. 2013;
Riechers et al. 2013).
Despite the power of stacking analyses of high-redshift galaxies using single dish sub/mm telescopes (Heinis et al. 2013, 2014; Pannella et al. 2015; Alvarez-M´´ arquez et al. 2016;Bourne et al. 2017), detailed studies require individual detections of IR emission from normal star-forming galaxies along the star-forming main sequence.
With currently accumulating observations with ex-tremely sensitive sub/mm interferometers such as ALMA and NOEMA, the study of dust emission from high-redshift star forming galaxies is rapidly maturing. These observa-tions hint at a potential evolution of the IRX–βUV rela-tion at z & 3, with high-redshift star forming galaxies ap-pearing to be ’infrared-dark’ (Ouchi et al. 2013; Ota et al. 2014;Capak et al. 2015;Schaerer et al. 2015;Bouwens et al. 2016;Dunlop et al. 2017). However, current studies are still based on small samples only, and the direct detection of IR emission from statistical samples of individual high-redshift galaxies is still missing.
In this paper, to improve our knowledge of the nature of dust emission from z & 3 star-forming galaxies, we ex-plore the IRX–βUVrelation at z ∼ 3.2 by using our ALMA observations of UV selected, massive (M∗& 1010.7M⊙), star-forming galaxies located on COSMOS field. We also include public ALMA observations of z ∼ 4–6 galaxies, in order to investigate a possible redshift evolution of the dust atten-uation between z ∼ 3 and z ∼ 6, within the first 2 Gyr of cosmic history.
This paper is organised as follows: In Section 2, we present our galaxy sample and the data used for the analy-sis. Section 3 describes the basic measurements performed, before our results are presented in Section 4 and we conclude in Section 5. Throughout this paper, we assume a cosmology
with (Ωm,ΩΛ, h0) = (0.3, 0.7, 0.7), and a Chabrier initial mass function (Chabrier 2003) where applicable.
2 OBSERVATIONS
2.1 ALMA Observations of z ∼ 3.2 Targets
The main data used for this study come from an ALMA Cycle-2 Program (2013.1.00151.S, PI E. Schinnerer), which targets the ∼ 300 µm rest-frame continuum of a sample of main-sequence galaxies at z ∼ 3. Details of the tar-get selection and ALMA observations are presented in
Schinnerer et al. (2016), and they are briefly summarised below.
The main purpose of the ALMA program was to ob-serve massive, star-forming galaxies at z ∼ 3 on the main sequence. In this paper, we only include sources with reli-able photometric redshifts in the range 2.6–3.7 in the lat-est COSMOS15 catalogue (Laigle et al. 2016) and we ex-clude sources that potentially host an AGN (as discussed in
Schinnerer et al. 2016). Our final z ∼ 3 sample thus consists of 67 galaxies, which have a median redshift of 3.18, and a median stellar mass of log(M∗[M⊙]) ∼ 10.7, with the mini-mum/maximum stellar mass being log(M∗[M⊙]) = 9.2/11.5. While most sources only have photometric redshifts, 7 galax-ies of our sample have high-quality spectroscopic redshift measurements from VIMOS Ultra Deep Survey (VUDS;
Le F`evre et al. 2015).
ALMA observations of these targets were performed to detect the continuum emission at 240 GHz, which cor-responds to rest-frame λrf ∼ 300 µm at the redshift of our sample. Targets were observed with typically 38 an-tennas between December, 25th and 30th, 2015 for an average on-source time of 2 min. The achieved beam-size and rms of the ALMA images are 1.8′′×1.1′′(1.7′′×1.1′′) and 66(77) µJy/beam for 19(48) fields using the NATURAL weighting scheme.
A total of 41 of our 67 targets were detected at more than > 3 σ at the counterpart positions of the lat-est COSMOS Ultra-Vista NIR images (McCracken et al. 2012). Four out of these sources have reliable spectroscopic redshifts from VUDS. For the 26 targets with ALMA non-detections, we compute 3σ upper limits on the ALMA fluxes that are used throughout the paper.
Stellar masses for our z ∼ 3 sample are calculated based on multi-wavelength spectral energy distribution (SED) fitting using the MAGPHYS code (da Cunha et al. 2008). In addition to the COSMOS optical+NIR pho-tometry (Laigle et al. 2016), we also exploit all available longer wavelength data in these fits. This includes the Spitzer/MIPS 24 µm fluxes fromLe Floc’h et al.(2009), the Herschel/PACS 100 µm fluxes from Lutz et al. (2011), and our ALMA 1.3-mm fluxes (see Schinnerer et al. 2016, for details on the SED fitting).
2.2 z ≥4 Galaxy Samples
While our main analysis is based on the z ∼ 3 sample from
Schinnerer et al.(2016), we also investigate a potential red-shift evolution of the IRX–βUV relation in section 4.4. To do this, we exploit the published ALMA fluxes of z ∼ 4–5
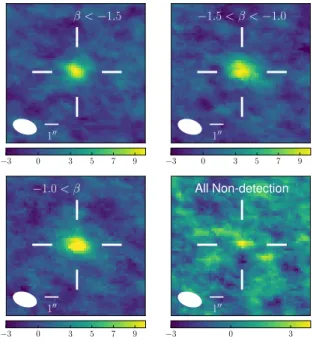
1′′ β < −1.5 −3 0 3 5 7 9 1′′ −1.5 < β < −1.0 −3 0 3 5 7 9 1′′ −1.0 < β −3 0 3 5 7 9 1′′ All Non-detection −3 0 3
Figure 1.Stacked images of our ALMA 1.3-mm continuum ob-servations for different sub-samples. 1′′ scales and our synthe-sised beam FWHM sizes are shown at the bottom left corners of each panel. Median stacks are computed using all z ∼ 3.2 ALMA sources (individually detected and non-detected) split into 3 bins of UV slope (top left: βUV < −1.5with 14 galaxies, top right: −1.5 < βUV < −1.0with 30 observations, and bottom left: −1.0 < βUV with 23 observations). All stacks result in a clear detection. The bottom right panel corresponds to a stack of all individual ALMA non-detections (26 sources), for which we find a tentative detection with σ ∼ 4.3. We note that this is the most sig-nificant positive/negative signal within the primary beam FWHM of the stack. Colour bars below each panel indicate the signal to noise ratio per pixel. The stacking results are summarised in Tab. 1.
galaxies from Scoville et al.(2016), and the IRX–βUVdata points of z ∼ 5–6 galaxies fromCapak et al.(2015).
ALMA band-6 fluxes of the z ∼ 4 − 5 sample are taken from Table 8 of Scoville et al.(2016). This sample consists of 19 galaxies with median log(M∗[M⊙]) of 10.45 and me-dian redshift of 4.3. For this sample, the observed ALMA fluxes probe rest-frame wavelengths λrf ∼ 240 µm. The UV luminosities and continuum slopes are derived in the same manner as for our z ∼ 3 sample based on the photometry of the COSMOS15 catalogue. Stellar masses for the z ∼ 4 − 5 sources are directly taken from that catalogue.
For further constraints at even higher redshift, we ex-ploit the data set byCapak et al.(2015). That sample con-sists of 9 galaxies (4 detections and 5 non-detections) with median mass log(M∗[M⊙]) of 9.86 and median redshift of 5.55. We utilise the LIR, LUV, and βUVestimates of the tar-gets from Table 1 ofBarisic et al.(2017), which updates the original measurements by using additional HST photometry (and also provides measurements for individual clumps in two sources). We excluded the X-ray detected quasar from their sample.
3 ANALYSIS
The analysis of the IRX–βUVrelation requires us to measure the galaxies’ luminosities at UV and IR wavelengths, as well as the UV continuum slope βUV, which we describe in the following section.
3.1 LIR, LUV, and βUV
Infrared luminosities (LIR) are estimated by fitting a sin-gle component modified black body function to the ALMA 240 GHzfluxes of our galaxies and integrating over the wave-length range between 8 and 1000 µm. We assume a dust emis-sivity index of βd= 1.5 (Dunne & Eales 2001).
Dust temperatures (Td) are estimated based on a stack-ing analysis of Spitzer, Herschel, and ALMA images of our full z ∼ 3 galaxy sample (seeMagnelli et al. 2014, for a sim-ilar analysis). From the full IR SED of these stacked data, we obtain a best-fit dust temperature of Td = 41.5 ± 2.5 K by fitting a standard modified black body spectrum (Casey 2012). The derived dust temperature is consistent with re-cently obtained values at z ∼ 4 galaxies (e.g.Schreiber et al. 2016). Hereafter, we will use Td = 40 K as our fiducial value throughout the paper, but we will comment on the potential impact of assuming a lower dust temperature of Td= 35 K.
Uncertainties on our LIR measurements are estimated using the ALMA flux measurement errors. For the 26 non-detected targets, we estimated upper limits on their LIR us-ing the 3σ ALMA flux limits.
The LIR of our detected targets range between 5.9 × 10¹¹ and 5.8 × 10¹²L⊙, thus straddling the range between luminous infrared galaxies (LIRGs, 1011 < L
IR < 1012L⊙) and ultra luminous infrared galaxies (ULIRGs, 1012< L
IR< 1013L⊙).
While the increased CMB temperature can affect the luminosity measurements of higher redshift galaxies (e.g.
da Cunha et al. 2013;Zhang et al. 2016), we estimate that the expected effect on our z ∼ 3 sample is still less than 5% and thus negligible compared to our typical flux measure-ment uncertainties.
UV spectral slopes (βUV) are calculated by fitting a power law fλ ∝ λβUV to the broad- and narrow-band
pho-tometry of the galaxies over the rest-frame wavelength range 1500 − 2500 ˚A. For this purpose, we utilise the photome-try measured within 3′′apertures listed in the COSMOS15 catalogue (Laigle et al. 2016). Typically more than 10 data points are available covering this waveband for each of our targets. The monochromatic UV luminosities are then calcu-lated at rest-frame 1600 ˚A using the above power law fits to the UV SEDs and defining LUV= ν1600Lν1600. The range of
obtained LUVcovers 1.2 × 10¹⁰< ν1600Lν1600<1.5 × 10¹¹L⊙.
3.2 Stacking Analysis
While 41 out of our sample of 67 galaxies are detected with ALMA, the remaining targets still contain important infor-mation on the average IRX relation at z ∼ 3. We therefore perform a stacking analysis of all target fields. In particu-lar, we are interested in the average IRX of our sample as a function of UV continuum slope βUV. We thus split our full galaxy sample in three bins: βUV< −1.5, βUV= −1.5 to
4
Fudamoto et al.
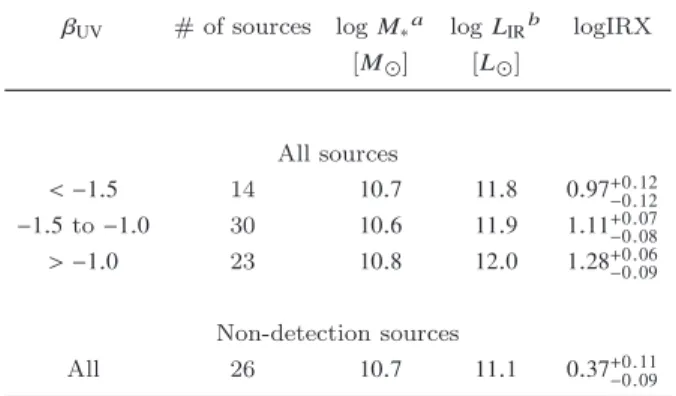
Table 1.Results of the Stacking Analysis
βUV # of sources log M∗a log LIRb logIRX [M⊙] [L⊙] All sources < −1.5 14 10.7 11.8 0.97+0.12 −0.12 −1.5to −1.0 30 10.6 11.9 1.11+0.07 −0.08 > −1.0 23 10.8 12.0 1.28+0.06 −0.09 Non-detection sources All 26 10.7 11.1 0.37+0.11 −0.09 a Median stellar mass of the target galaxies as estimated by the MAGPHYScode (da Cunha et al. 2008).
bCorresponding IR luminosity of the stacked ALMA images.
−1.0, and βUV> −1.0, which contain 14, 30, and 23 galaxies, respectively.
Thanks to the very uniform synthesised beam full-width-at-half-maximum (FWHM) of our ALMA images, stacks can be created by simply taking the median of each pixel in the ALMA maps. During the stacking procedure, the ALMA images are weighted by the inverse of the galaxy’s LUV, in order to compute the median IRX of the sample go-ing into the stack. All three ALMA stacks reveal a significant detection, as shown in Fig.1.
We also compute a stacked image of all 26 ALMA non-detections using the same procedure as above. The stack reveals a tentative detection with a significance of ∼ 4.3 σ (lower right panel of Fig.1). We note that this tentative de-tection is the most significant positive/negative signal within the central 23′′× 23′′ of the stacked image, corresponding to the FWHM of the primary beam of each observation at 240 GHz.
We then measure total fluxes for each of the stacks us-ing the peak fluxes and applyus-ing a correction to total flux derived from the mean of the ALMA detected sources. Un-certainties on all stacked quantities, including the IRX, are estimated using bootstrap resampling. The results of this stacking analysis are summarised in Table1, where we also tabulate the resulting median IRX of the different stacks that are used in our analysis later on.
4 RESULTS AND DISCUSSION
In the following, we discuss our results on the IRX–βUVand the IRX–M∗ relations at z ∼ 3.2, as well as their possible redshift evolution to z ∼ 4 − 6.
4.1 IRX–βUV Relation at z ∼ 3.2
The IRX–βUVdiagram of our z ∼ 3.2 galaxy sample is shown in Fig.2together with the expected relations of two different local dust extinction curves, the M99 relation and SMC-type extinction (e.g. Prevot et al. 1984). These two attenuation laws have both been discussed in the past to represent dif-ferent sub-samples of z ∼ 2 − 3 galaxies (e.g. Reddy et al. 2012;Bouwens et al. 2016). −3 −2 −1 0 βUV 0.5 1.0 1.5 2.0 lo g IR X (= LIR /L U V ) Td= 35 K
z ∼ 3
Meurer+99 SMC like extinction Detection Stacking All Stacking Non-detectionFigure 2. The IRX–βUV diagram for massive (median M∗∼ 1010.7M⊙) star-forming galaxies at z ∼ 3.2 using individual de-tections (blue dots), and 3 σ upper limits for non-dede-tections (ma-genta arrows). Our stacking results are plotted with large squares, where the three red points correspond to median stacks of all galaxies in bins of βUV representing the average IRX–βUV rela-tion of our sample. The green square corresponds to the me-dian stack of all 26 ALMA non-detection fields. Two typically assumed attenuation curves are also shown: the relation of local starburst galaxies (Meurer et al. 1999, solid line), and an SMC-like relation (e.g.Prevot et al. 1984, dotted line). While our fidu-cial measurements assume a dust temperature (Td) of 40 K, the downward arrow in the lower left corner shows the impact of as-suming Td= 35 K. While individual detections (and upper limits) typically lie above the M99 relation, our stacking analysis shows that the local M99 relation is generally applicable for the av-erage z ∼ 3 galaxy. However, there is a considerable amount of dispersion around the mean IRX–βUV relation at z ∼ 3.2 with some sub-samples of galaxies (i.e. our individually non-detected sources) that are more consistent with an SMC-type attenuation curve.
The figure shows that our ALMA detected targets typ-ically lie above the M99 line. Similarly, the 3σ upper limits of individually un-detected sources often lie above the M99 relation. However, when we combine these samples through stacks in bins of βUV, we obtain three measurements of the IRX–βUVrelation that lie at the low end of the individually detected IRX values, showing that the typical z ∼ 3 galaxy is mostly consistent with the M99 relation, in particular at β > −1.5.
Since the sample with β < −1.5 only contains 14 sources, its stacked IRX value is quite uncertain. It lies significantly above the M99 relation. However, in the redder UV slope bins, where we have better statistics, both median stacked IRX values are in excellent agreement with the M99 relation. Interestingly, the median stacks show that an SMC-like attenuation is clearly not applicable for the general galaxy sample at z ∼ 3.2. In the βUVrange probed by our stacks, the median IRX values lie & 0.7 dex above an SMC-like at-tenuation curve. However, considering the stack of ALMA
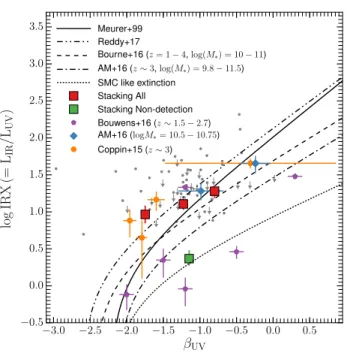
−3.0 −2.5 −2.0 −1.5 −1.0 −0.5 0.0 0.5 βUV −0.5 0.0 0.5 1.0 1.5 2.0 2.5 3.0 3.5 lo g IR X (= LIR /L U V ) Meurer+99 Reddy+17 Bourne+16 (z = 1 − 4, log(M∗) = 10 − 11) AM+16 (z ∼ 3, log(M∗) = 9.8 − 11.5) SMC like extinction Stacking All Stacking Non-detection Bouwens+16 (z ∼ 1.5 − 2.7) AM+16 (logM∗= 10.5 − 10.75) Coppin+15 (z ∼ 3)
Figure 3.IRX–βUV diagram from several previous studies. Our results of individual detections and 3 σ upper limits are shown as grey dots and arrows. The results for stacked images are indicated by red squares (all sources) and a green square (for non-detected fields only). Results from previous studies include stacking analyses and individual ALMA detections. Blue: stacking analysis of z ∼ 3 LBGs with mass range log(M∗) ∼ 10.5–11.0 from
´
Alvarez-M´arquez et al.(2016, labelled AM+16). Yellow: Stacking results of LBGs at z ∼ 3 − 4 with M∗& 109.7M ⊙ (Coppin et al. 2015). Purple: individual detections of M∗>109.75M⊙galaxies at z = 2 − 3 (Bouwens et al. 2016). Lines show different best-fit rela-tions of local galaxies, as well as for a z ∼ 3 LBG sample (dash-dotted line; AM+16) and IR selected z ∼ 1−4 galaxies (dashed line; Bourne et al. 2017, the appropriate mass ranges are indicated in the label). Finally, the dash-double-dotted line shows a theoretical relation based on an intrinsically very blue SED reddened by the Reddy et al.(2015) extinction curve that appears to provide the best representation of the IRX–β of our full sample.
non-detected sources only, we find a very low IRX value that lies within < 1σ of the SMC curve.
This provides some evidence for a large dispersion in IRX values at a given βUV from one galaxy to another at z ∼3, with certain subsamples of galaxies that show signif-icantly lower IRX values at a given βUV than the average population. This confirms previous analyses of z ∼ 2 − 3 galaxies which find that the local M99 relation is typically applicable to the general galaxy population, but that there are a few galaxies (that are typically younger) that are more consistent with an SMC-type attenuation (Siana et al. 2009;
Reddy et al. 2012). Within our sample, we do not find a clear separation in physical parameters, however, between our ALMA detections and non-detections (e.g. zphot, age, M∗).
Note that our conclusions would not change signifi-cantly under the assumption of a lower dust temperature, Td = 35 K that has been used in some previous analyses of high-redshift galaxies (e.g.,Bouwens et al. 2016). Under this assumption, the values of LIRas well as the IRX decrease by ∼ 0.25 dexfor our sample (see arrow in Fig 2).
4.2 Comparison to Previous z ∼ 3 Studies
In Fig. 3, we compare our results with several pre-vious studies of the IRX–βUV relation at z ∼ 3 for samples covering a similar mass range (M∗& 1010M⊙). In particular, the comparison samples include stacking analyses of Lyman Break Galaxies (LBGs) and/or IR-selected galaxies (Coppin et al. 2015; Bourne et al. 2017;
´
Alvarez-M´arquez et al. 2016;Reddy et al. 2017), as well as individual ALMA detections of z & 1.5–2.7 galaxies from
Bouwens et al.(2016). Despite similar mass ranges probed, these previous analyses found IRX values that are sometimes different by & 1 dex at a fixed βUV.
Interestingly, our data points and stacks are in good agreement with the full range of these previous analyses. For instance, the stack of our non-detections shows an IRX value similar to individual galaxies found byBouwens et al.
(2016). On the other hand, our stacked measurements and our individual detections are in good agreement with the values found byCoppin et al.(2015), who utilised a stacking analysis of SCUBA-2 and Herschel observations of ∼ 4200 LBGs. Similar agreement is found with the z ∼ 3 high-mass stacks fromAlvarez-M´´ arquez et al.(2016).
We also investigate whether an IRX–β relation with bluer intrinsic UV slope could explain our data. Such a trend to bluer intrinsic slopes at higher redshift is expected due to, e.g., lower metallicities and younger stellar popula-tion ages (e.g. Dayal & Ferrara 2012; Schaerer et al. 2013;
Alavi et al. 2014; Castellano et al. 2014; de Barros et al. 2014; Sklias et al. 2014; Cullen et al. 2017), and evidence for such bluer intrinsic slopes is continuously emerging from several studies. For instance,Smit et al.(2016) derive a sim-ilar best fit βUV,int = −2.5 by comparing UV-based SFRs with those inferred from Hα fluxes at z ∼ 4. Reddy et al.
(2017) provide theoretical derivations of IRX–β relation-ships based on different assumptions of the intrinsic SED and dust curves. A relation based on a young SED with βUV,int = −2.62, reddened by the Reddy et al. (2015) dust curve indeed provides an adequate representation of our stacked points, including the bluest bin, in better agreement than the M99 relation. It will thus be interesting to further investigate the overall shape of the IRX–βUV relation and the βUV, int based on larger ALMA surveys of high redshift galaxies spanning a wide range in UV continuum slopes in the future.
4.3 The IRX-M∗ Relation
Several studies have shown that more massive star-forming galaxies show larger dust attenuation than their lower mass counterparts, which results in a mass dependence of the IRX values (e.g. Reddy et al. 2010; Buat et al. 2012;Heinis et al. 2013;Coppin et al. 2015;Pannella et al. 2015;Bouwens et al. 2016;Bourne et al. 2017;Dunlop et al. 2017).
In a recent analysis,Alvarez-M´´ arquez et al.(2016) dis-cuss the IRX–M∗ relation based on a stacking analysis of z ∼3LBGs using Herschel and AzTEC data. Although their mean IRX–βUV relation exhibits a lower IRX than M99 at fixed βUVas shown in our Fig. 3, their stacking analysis of a mass-matched sub-sample with M∗∼ 1010.5–1011results in a ∼ 0.5 dex higher IRX at fixed βUV than their mean
rela-6
Fudamoto et al.
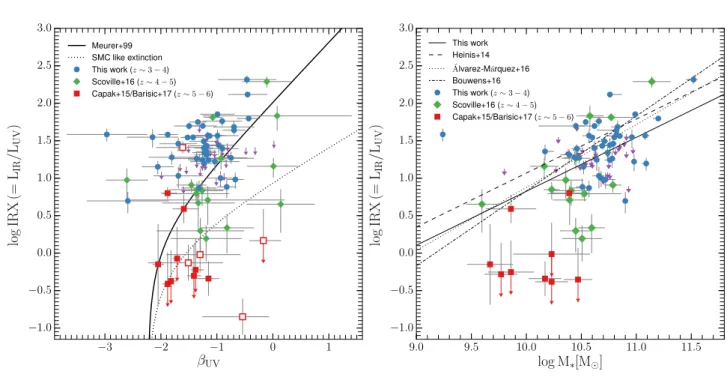
−3 −2 −1 0 1 βUV −1.0 −0.5 0.0 0.5 1.0 1.5 2.0 2.5 3.0 lo g IR X (= LI R /L U V ) 9.0 9.5 10.0 10.5 11.0 11.5 log M∗[M⊙] −1.0 −0.5 0.0 0.5 1.0 1.5 2.0 2.5 3.0 lo g IR X (= LI R /L U V ) This work Heinis+14 ´ Alvarez-M´arquez+16 Bouwens+16 This work (z ∼ 3 − 4) Scoville+16 (z ∼ 4 − 5) Capak+15/Barisic+17 (z ∼ 5 − 6) Meurer+99 SMC like extinction This work (z ∼ 3 − 4) Scoville+16 (z ∼ 4 − 5) Capak+15/Barisic+17 (z ∼ 5 − 6)Figure 4. IRX-βUV and IRX–M∗ diagrams at z = 3 − 6 utilising ancillary datasets fromScoville et al. (2016); Capak et al. (2015); Barisic et al.(2017). Individual detections and 3 σ upper limits are shown at at z ∼ 3–4 (blue circles and magenta arrows; this work), z ∼ 4–5 (green diamonds, Scoville et al. 2016), and z ∼ 5–6 (red squares, fromCapak et al. 2015;Barisic et al. 2017). Left panel: IRX-βUVdiagram combining data at z ∼ 3–6. Lines show the IRX-βUVrelation of local starburst galaxies (solid, Meurer et al. 1999), and an SMC like extinction curve (dotted). For z ∼ 5 − 6 samples, we plot all data points including the measurements of individual clumps (empty red squares) as well as integrated values (filled red squares; seeBarisic et al. 2017). Right panel: IRX-M∗diagram of the same samples. Lines show stacking analyses of LBGs at z ∼ 3 (dotted line;Alvarez-M´´ arquez et al. 2016), UV selected galaxies at z ∼ 3 (dashed line;Heinis et al. 2014), z ∼ 2 − 3 galaxies in the HUDF (dot-dashed line;Bouwens et al. 2016), and best-fit results to our data at z ∼ 3.2 (solid line). These figures suggest the existence of a significant redshift evolution of the IRX-βUV relation between z ∼ 3 and z ∼ 6 even when the IRX–M∗correlation is taken into account.
tion, agreeing with the M99 relation and our results (see Fig.
3), and it clearly demonstrates the importance of comparing mass-matched galaxy samples.
In Fig. 4 right we analyse the IRX–M∗ relation of our sample. Although the dynamic range in mass is small, there is generally a correlation with a slope that is consistent with previous studies. However, our targets show lower IRX val-ues than previous studies at fixed M∗. We note that this could potentially be due to different βUV distributions, in particular the lack of redder objects in our sample (i.e., with βUV> −0.5).
We quantify the offset by fitting for the normalisation but keeping the slope fixed to the one found inHeinis et al.
(2013). This results in a best-fit IRX–M∗ relation following: log(IRX) = 0.72 [log(M∗) − 10.35] + 1.08
The offset in normalisation relative toHeinis et al.(2013) is thus 0.24 dex. A similar offset is found relative to the IRX– M∗relation fromAlvarez-M´´ arquez et al.(2016).
Interestingly, the sub-sample of our ALMA non-detections shows an even larger offset to lower IRX values compared to previous studies when we consider the location of their median stacked IRX. This suggests that there is also a significant scatter around the mean IRX–M∗ relation at z & 3. InReddy et al. (2010), the authors discussed the IRX–M∗relation of z ∼ 2 UV selected star forming galaxies, and estimated a scatter in the relation of ∼ 0.46 dex about a linear fit. Consistent with this, our result suggests that
indi-vidual galaxies indeed can span a ∼ 0.5 dex range in IRX val-ues at z ∼ 3 around the IRX–βUVrelation. Such a large dis-persion will result in large uncertainties on the inferred dust corrections of UV-based SFRs of individual galaxies, and it will be crucial to search for correlations with other physical parameters in an attempt to decrease these dispersions in the future with larger samples. For instance,Nordon et al.
(2013) show that the scatter in the IRX is correlated with the position of a galaxy with respect to the main-sequence of star-formation.
4.4 The Evolution of IRX–βUV Beyond z = 3 Our finding that the IRX–βUV relation at z ∼ 3.2 is consis-tent with the local M99 relation is in contrast to some recent results on high redshift galaxies.
For instance,Capak et al.(2015) find that their sample of z ∼ 5.5 galaxies generally lies ∼ 1 dex below the M99 rela-tion (see alsoBarisic et al. 2017). Similarly,Bouwens et al.
(2016) find that the z > 4 IRX–βUV relation lies below the M99 relation based on a stacking analysis of Lyman Break Galaxies (LBGs) in the ASPECS data over the Hub-ble Ultra-Deep Field.
To investigate this evolution further, we compare our z ∼3.2galaxies with the z ∼ 4 − 5 sample fromScoville et al.
(2016) and with the z ∼ 5.5 galaxies from Capak et al.
(2015);Barisic et al.(2017) in Fig.4. While the z > 4 sample is currently very small, we see tentative evidence for an
lutionary trend at z > 3. Between z ∼ 3–6, the median IRX gradually drops by & 1 dex, and a large fraction of the z ≥ 4 sample lies close to or even below the SMC like extinction curve.
This evolution to lower IRX values at a given βUVis very intriguing, and could potentially hint at an evolution of the dust properties within the first 2 Gyr of cosmic history. This is expected theoretically due to the younger stellar popula-tion ages of galaxies in the early universe for which the AGB star population has not yet had enough time to produce a significant amount of dust. At very high redshift, the main dust production mechanism is thus thought to be super-novae explosions, which can be expected to lead to a different dust composition and attenuation curve than at later times (Todini & Ferrara 2001; Gallerani et al. 2010). Alternative solutions as to why higher redshift galaxies show lower dust emission could involve a higher fraction of gas to be locked up in a cold, molecular component compared to lower red-shift (Ferrara et al. 2016). Furthermore, it will be important to understand the relative morphological distributions and the mixing of the stars and the dust in multi-component high redshift (e.g.Casey et al. 2014;Koprowski et al. 2016).
However, before making strong claims about a possible redshift evolution, we have to control for the differences in stellar masses of the different samples. To do this, we explore the IRX–M∗ relation of the three high-redshift samples in the right panel of Fig. 4. As is evident from the plot, there is indeed a difference in mass among the different samples. However, the higher redshift samples generally show a larger offset from the z ∼ 3 stacking analysis ofHeinis et al.(2014) at lower masses. The median offsets from our best-fit IRX– M∗ relation are ∼ 0.31 dex and ∼ 1.2 dex for the samples at z ∼4.3and z ∼ 5.5 (including 3 σ upper limits), respectively. Note that this rapid redshift evolution is in general agreement with the best-fit IRX–M∗ relation presented in Bouwens et al. (2016), where the authors studied star forming galaxies with log(M∗) < 9.5 at z ∼ 4–10, and found lower IRX values by ∼ 0.5 dex at fixed M∗ com-pared to a consensus relation estimated from previous anal-yses at z ∼ 2 − 3 (Reddy et al. 2010;Whitaker et al. 2014;
´
Alvarez-M´arquez et al. 2016). However, this was based on the assumption of Td= 35 K. When assuming that the dust temperature increases with redshift, their results are in bet-ter agreement with the previous relations (Fig4).
It is thus clear that it is critical to constrain the dust temperatures at z > 4. Changes in Td can have a signif-icant impact on the LIR and IRX values estimated from single-band observations, and could affect all samples in-cluded in Fig.4. An evolution in the Td as a function of redshift is has been observed by many studies using stack-ing analyses (e.g. Magdis et al. 2012; Magnelli et al. 2014;
B´ethermin et al. 2015;Ivison et al. 2016), typically finding an evolution following Td∝ (1+ z)0.32. Assuming Td= 40 K at z = 3.2, this evolution then predicts Td∼ 43 Kand Td∼ 46 K at z ∼ 4.3 and z ∼ 5.5, respectively.
Relative to our fiducial value of Td= 40 K, these assump-tions would increase the IRX values of the observed samples by ∼ 0.1 dex, and ∼ 0.2 dex at z ∼ 4.3 and z ∼ 5.5, respectively. Clearly, a Td evolution could thus partially compensate for the observed IRX deficit at z > 4. However, a much more ex-treme evolution of the dust temperature would be required to fully account for the median decrement in IRX values at
z >4. Nevertheless, it is clear that better constraints on the dust temperatures of high redshift galaxies will be crucial for future studies.
5 CONCLUSIONS
In this paper, we have presented an investigation of the IRX-βUVrelation of massive (M∗∼ 1010.7M⊙) star-forming galax-ies at z ∼ 3.2, through FIR continuum observations with ALMA. We also explored a possible redshift evolution of the IRX–βUVand the IRX–M∗ relations by utilising public ALMA observations of star forming galaxies between z ∼ 3 and z ∼ 6. Our findings can be summarised as follows:
• The IRX–βUV relation of our sample is on average mostly consistent with that of local starburst galaxies derived by Meurer et al. (1999) and we can exclude an SMC-type extinction curve for the general star-forming z ∼ 3 galaxy (see Fig. 2, 3). However, as the stack of our ALMA non-detections shows, certain sub-samples of galax-ies exist that are in better agreement with the SMC relation. • Our individually detected sources and our stacks span a large range in IRX values at fixed βUV, consistent with previous analyses at z ∼ 3. This indicates the presence of a very large dispersion around the average IRX–βUVrelation of up to ±0.5dex. The same is observed for the IRX–M∗ relation (see Fig. 3,4).
• With public ALMA observations of galaxies at z ∼ 4– 6, we explored the redshift evolution of the IRX–βUV and the IRX–M∗relations, which we find to be significant. Even though the current samples are still small, we find a strong, gradual decrease to lower IRX values at fixed βUVor M∗with increasing redshift, with the z ∼ 6 sample generally lying an order of magnitude below our z ∼ 3 relations on average (see Fig. 4).
The fact that our z ∼ 3 sample is consistent with the local M99 dust law, yet higher redshift samples appear to fall off this relation, is particularly interesting, as it could point to significant changes in the ISM and dust properties of high-redshift galaxies. It will be important to confirm the suggested evolution between z ∼ 3 and z ∼ 6 with future datasets. In particular, our study demonstrates that indi-vidual IR detections of the dust emission from a statistical high-redshift sample are crucial due to considerable scatter around the average IRX–βUVthat can not be fully captured by stacking analyses. Our analysis thus motivates a larger investment of ALMA time to study the dust emission of a statistical sample of normal high-redshift galaxies.
ACKNOWLEDGEMENTS
The authors thank A. Ferrara, R. Bouwens, and N. Reddy for very helpful discussions related to this work. This paper makes use of the follow-ing ALMA data: ADS/JAO.ALMA#2013.1.00151.S, ADS/JAO.ALMA#2013.1.00034.S, and ADS/JAO.ALMA#2012.1.00523.S. ALMA is a part-nership of ESO (representing its member states), NSF
8
Fudamoto et al.
(USA) and NINS (Japan), together with NRC (Canada) and NSC and ASIAA (Taiwan) and KASI (Republic of Korea), in cooperation with the Republic of Chile. The Joint ALMA Observatory is operated by ESO, AUI/NRAO and NAOJ. Based on data products from observations made with ESO Telescopes at the La Silla Paranal Ob-servatory under ESO programme ID 179.A-2005 and on data products produced by TERAPIX and the Cambridge Astronomy Survey Unit on behalf of the UltraVISTA consortium. B.G. gratefully acknowledges the support of the Australian Research Council as the recipient of a Future Fellowship (FT140101202). MTS acknowledges support from a Royal Society Leverhulme Trust Senior Research Fellowship (LT150041). VS acknowledges support from the European Union’s Seventh Frame-work program under grant agreement 337595 (ERC Starting Grant, ’CoSMass’). OLF acknowledges support from the European Research Council Advanced Grant ERC-2010-AdG-268107-EARLY.
REFERENCES
Alavi A., et al., 2014,ApJ,780, 143 ´
Alvarez-M´arquez J., et al., 2016,A&A,587, A122 Barisic I., Faisst A. L., Capak P., 2017, in prep. B´ethermin M., et al., 2015,A&A,573, A113 Bourne N., et al., 2017,MNRAS,
Bouwens R. J., et al., 2015,ApJ,803, 34 Bouwens R. J., et al., 2016,ApJ,833, 72 Buat V., et al., 2012,A&A,545, A141 Capak P. L., et al., 2015,Nature,522, 455 Casey C. M., 2012,MNRAS,425, 3094 Casey C. M., et al., 2014,ApJ,796, 95 Castellano M., et al., 2014,A&A,566, A19 Chabrier G., 2003,PASP,115, 763
Coppin K. E. K., et al., 2015,MNRAS,446, 1293
Cullen F., McLure R. J., Khochfar S., Dunlop J. S., Dalla Vecchia C., 2017, preprint, (arXiv:1701.07869)
Daddi E., Dannerbauer H., Krips M., Walter F., Dickinson M., Elbaz D., Morrison G. E., 2009,ApJ,695, L176
Dayal P., Ferrara A., 2012,MNRAS,421, 2568 Dunlop J. S., et al., 2017,MNRAS,466, 861 Dunne L., Eales S. A., 2001,MNRAS,327, 697 Elbaz D., et al., 2011,A&A,533, A119 Ellis R. S., et al., 2013,ApJ,763, L7
Ferrara A., Hirashita H., Ouchi M., Fujimoto S., 2016, preprint, (arXiv:1607.01824)
Gallerani S., et al., 2010,A&A,523, A85 Heinis S., et al., 2013,MNRAS,429, 1113 Heinis S., et al., 2014,MNRAS,437, 1268 Hopkins A. M., Beacom J. F., 2006,ApJ,651, 142 Ivison R. J., et al., 2016,ApJ,832, 78
Koprowski M. P., et al., 2016,ApJ,828, L21 Laigle C., et al., 2016,ApJS,224, 24 Le F`evre O., et al., 2015,A&A,576, A79 Le Floc’h E., et al., 2009,ApJ,703, 222 Lutz D., et al., 2011,A&A,532, A90
Madau P., Dickinson M., 2014,ARA&A,52, 415 Magdis G. E., et al., 2012,ApJ,760, 6
Magnelli B., et al., 2014,A&A,561, A86 McCracken H. J., et al., 2012,A&A,544, A156
McLeod D. J., McLure R. J., Dunlop J. S., 2016, MNRAS, 459, 3812
Meurer G. R., Heckman T. M., Calzetti D., 1999,ApJ,521, 64 Nordon R., et al., 2013,ApJ,762, 125
Oesch P. A., et al., 2013,ApJ,773, 75
Oesch P. A., et al., 2014,ApJ,786, 108 Ota K., et al., 2014,ApJ,792, 34 Oteo I., et al., 2013,A&A,554, L3 Ouchi M., et al., 2013,ApJ,778, 102 Overzier R. A., et al., 2011,ApJ,726, L7 Pannella M., et al., 2009,ApJ,698, L116 Pannella M., et al., 2015,ApJ,807, 141
Prevot M. L., Lequeux J., Prevot L., Maurice E., Rocca-Volmerange B., 1984, A&A,132, 389
Reddy N. A., Steidel C. C., Fadda D., Yan L., Pettini M., Shapley A. E., Erb D. K., Adelberger K. L., 2006,ApJ,644, 792 Reddy N. A., Erb D. K., Pettini M., Steidel C. C., Shapley A. E.,
2010,ApJ,712, 1070
Reddy N., et al., 2012,ApJ,744, 154 Reddy N. A., et al., 2015,ApJ,806, 259
Reddy N., Oesch P., Montes M., Bouwens R., 2017, in prep Riechers D. A., et al., 2013,Nature,496, 329
Schaerer D., de Barros S., Sklias P., 2013,A&A,549, A4 Schaerer D., Boone F., Zamojski M., Staguhn J.,
Dessauges-Zavadsky M., Finkelstein S., Combes F., 2015,A&A,574, A19 Schinnerer E., et al., 2016,ApJ,833, 112
Schreiber C., Pannella M., Leiton R., Elbaz D., Wang T., Oku-mura K., Labb´e I., 2016, preprint, (arXiv:1606.06252) Scoville N., et al., 2016,ApJ,820, 83
Siana B., et al., 2009,ApJ,698, 1273 Sklias P., et al., 2014,A&A,561, A149
Smit R., Bouwens R. J., Labb´e I., Franx M., Wilkins S. M., Oesch P. A., 2016,ApJ,833, 254
Symeonidis M., et al., 2013,MNRAS,431, 2317
Takeuchi T. T., Yuan F.-T., Ikeyama A., Murata K. L., Inoue A. K., 2012,ApJ,755, 144
Todini P., Ferrara A., 2001,MNRAS,325, 726 Whitaker K. E., et al., 2014,ApJ,795, 104
Zhang Z.-Y., Papadopoulos P. P., Ivison R. J., Galametz M., Smith M. W. L., Xilouris E. M., 2016, Royal Society Open Science,3, 160025
da Cunha E., Charlot S., Elbaz D., 2008,MNRAS,388, 1595 da Cunha E., et al., 2013,ApJ,766, 13
de Barros S., Schaerer D., Stark D. P., 2014,A&A,563, A81 This paper has been typeset from a TEX/LATEX file prepared by the author.