HAL Id: hal-00297004
https://hal.archives-ouvertes.fr/hal-00297004
Submitted on 13 Jun 2007
HAL is a multi-disciplinary open access
archive for the deposit and dissemination of
sci-entific research documents, whether they are
pub-lished or not. The documents may come from
teaching and research institutions in France or
abroad, or from public or private research centers.
L’archive ouverte pluridisciplinaire HAL, est
destinée au dépôt et à la diffusion de documents
scientifiques de niveau recherche, publiés ou non,
émanant des établissements d’enseignement et de
recherche français ou étrangers, des laboratoires
publics ou privés.
Application of two phosphorus models with different
complexities in a mesoscale river catchment
B. Guse, A. Bronstert, M. Rode, B. Tetzlaff, F. Wendland
To cite this version:
B. Guse, A. Bronstert, M. Rode, B. Tetzlaff, F. Wendland. Application of two phosphorus models with
different complexities in a mesoscale river catchment. Advances in Geosciences, European Geosciences
Union, 2007, 11, pp.77-84. �hal-00297004�
Adv. Geosci., 11, 77–84, 2007 www.adv-geosci.net/11/77/2007/ © Author(s) 2007. This work is licensed under a Creative Commons License.
Advances in
Geosciences
Application of two phosphorus models with different complexities in
a mesoscale river catchment
B. Guse1,*, A. Bronstert1, M. Rode2, B. Tetzlaff3, and F. Wendland3 1University of Potsdam, Institute of Geoecology, Potsdam, Germany
2Helmholtz Centre for Environmental Research – UFZ, Department of Hydrological Modelling, Magdeburg, Germany 3Research Centre Juelich, Institute of Chemistry and Dynamics of the Geosphere (ICG), Juelich, Germany
*now at: GeoForschungsZentrum Potsdam, Section Engineering Hydrology, Telegrafenberg, Potsdam, Germany
Received: 16 January 2007 – Revised: 24 April 2007 – Accepted: 22 May 2007 – Published: 13 June 2007
Abstract. The water balance and phosphorus inputs of surface waters of the Weiße Elster catchment, Germany, have been quantified using the models GROWA/MEPhos and SWAT. A comparison of the model results shows small dif-ferences in the mean long-term total runoff for the entire study area. All relevant pathways of phosphorus transport were considered in MEPhos with phosphorus inputs resulting to about 65% from point sources. SWAT focuses on agricul-tural areas and estimates a phosphorus input of about 60% through erosion. The mean annual phosphorus input from erosion calculated with SWAT is six times higher than the es-timation with MEPhos due to the differing model concepts. This shows the uncertainty contributed by the modelling de-scription of phosphorus pathways.
1 Introduction
Following the implementation of the Water Framework Di-rective for European waters (EU, 2000) acquiring qualitative and quantitative knowledge about nutrient inputs in waters is increasingly becoming a focal point of hydro-ecological re-search. Along with nitrogen, phosphorus is a very important in-stream nutrient in German surface waters because of its role as a limiting nutrient of primary production. In water bodies, phosphorus is present mostly as dissolved or particu-late anions (Sharpley and Rekolainen, 1997). Although point and non-point sources can be distinguished, the pathways of the latter are often hard to detect. Thus, large uncertainties are associated with their quantification (Sharpley and Reko-lainen, 1997).
Examples of phosphorus models in small-scale catch-ments are AGNPS (Rode and Frede, 1997) or ANIMO (Groenendijk and Kroes, 1999), which focus on non-point Correspondence to: B. Guse
sources. Large-scale phosphorus models such as SWAT (Arnold et al., 1998), MONERIS (Behrendt et al., 2000) or MEPhos (Tetzlaff, 2006) estimate point and non-point phos-phorus inputs to meso-scale catchments. However, since the models have been developed for specific applications, they may differ in their description of processes, sources and pathways of phosphorus in the landscape. Their description should correspond to their related time scales of application. The aim of this paper is to simulate runoff and phospho-rus input of surface waters of the Weiße Elster River catch-ment area by the two different models GROWA/MEPhos and SWAT. Simulations of modelled runoff und phosphorus inputs are compared with observed runoff and phosphorus loads. The main focus is to form a clear analysis of the phos-phorus input pathways represented by the models and the re-lated consequences for the levels of phosphorus inputs.
2 Study area and data
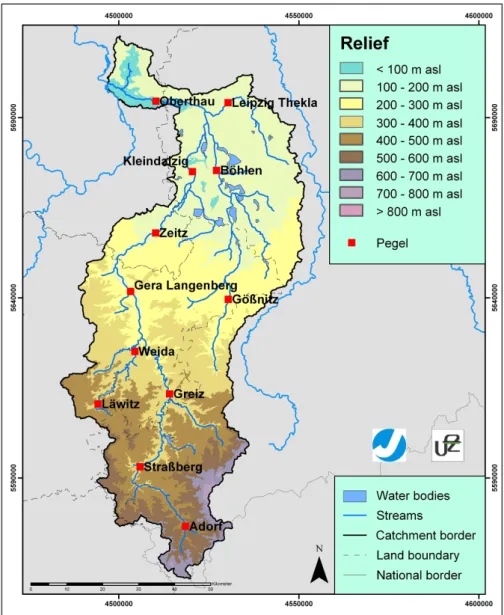
The study area is the catchment of the Weiße Elster River in the southeast of Germany, which has an area of 5200 km2. The Weiße Elster River has a length of 257 km and is a tribu-tary of the Saale River, which is a tributribu-tary of the Elbe River (Fig. 1). The mean annual precipitation is about 720 mm. The study area has a population of about 1.6 million inhabi-tants.
The more highly elevated southern area of the catchment is part of the Erzgebirge and the Vogtland with hard rocks such as schist. Coniferous forests cover the southern portion of the catchment. Reservoirs regulate the river runoff of this region.
Arable land and pasture on loess soil are the dominant land usages in the middle portion of the catchment. The slope of the river decreases with closer proximity to the river conflu-ence. Unconsolidated rocks and flat areas characterise the northern part of the study area. The largest cities of the study
78 B. Guse et al.: Application of two phosphorus models with different complexities
Fig. 1. Relief of the catchment of the Weiße Elster and gauging stations.
area, Leipzig and Halle, are located near the mouth of the river. Due to open-pit mining activities in this region, the water balance of this area is greatly disturbed.
This catchment has been the subject of intense research in the Weiße Elster project (Klauer et al., 2007). The modelling period spans a twelve year period (1992–2003), for which meteorological (e.g. 62 precipitation stations) and runoff data were available. Based on hydrological and landscape charac-teristics twelve sub-catchments were delineated according to runoff gauging stations.
Due to the limited quality of phosphorus measurement data only six water quality gauging stations could be used. Measurements of phosphorus concentrations are only avail-able on a biweekly time resolution. Since variability in sus-pended sediment and total phosphorus concentrations is a common and well-known phenomenon, it is expected that
the calculations of mean annual phosphorus loadings will be subject to high uncertainties (Rekolainen et al., 1991; Rode and Suhr, 2007).
3 Models and their application
The spatially-distributed modelling system GROWA/MEPhos has been developed at the Research Centre Juelich in order to quantify the water balance and phosphorus inputs of surface waters of large river basins. GROWA is an empirical hydrological model (Kunkel and Wendland, 2002) and is based on simple relationships between climatological, hydrological and soil characteris-tics. Special emphasis is paid to the runoff separation in direct runoff and groundwater flow and baseflow indices
B. Guse et al.: Application of two phosphorus models with different complexities 79
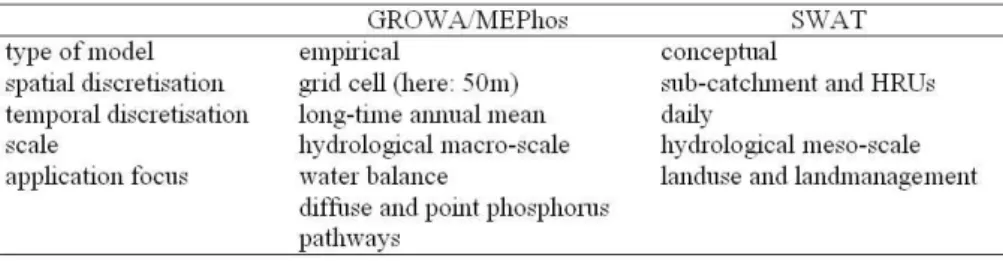
Table 1. Overview about the attributes of the models applied in this study.
are derived by a hierarchical approach of different site characteristics (Bogena et al., 2003). GROWA calculates a mean long-time value for each grid cell. For the Weiße Elster basin a grid size of fifty meters was chosen.
MEPhos is coupled with GROWA to quantify the phos-phorus input. It is an emissions-oriented model (Tetzlaff, 2006) which considers eight different pathways to repre-sent non-point (drainage, groundwater flow, wash off, ero-sion, rainwater sewers) and point sources (combined sewers overflows, sewage treatment plants, industrial effluents). To quantify phosphorus input it is necessary to derive different phosphotopes with specific export coefficients. MEPhos uses the USLE formulation (Schwertmann et al., 1987) to cal-culate erosion. Sediment and partical-culate phosphorus input caused by soil erosion is restricted to a thirty meter buffer strip along both sides of a flow path or river network.
Recently, MEPhos has been developed for the catchments of the Ems River and a part of the Rhine River. This study is the first application of MEPhos on another catchment.
GROWA needs gauging stations with natural (unmodified) runoff which precludes activities such as mining and water withdrawals. Consequently, we concentrated on the model validation for the upper parts of the catchment (hard rock region) which are not influenced by mining activities.
The parameters in GROWA (Bogena et al., 2003; Kunkel and Wendland, 2002; Tetzlaff et al., 2003) and MEPhos (Tet-zlaff, 2006) have been calibrated in former applications to a higher number of undisturbed gauges and their settings were adopted for this study.
The second model, the conceptual Soil and Water Assess-ment Tool (SWAT) (Arnold et al., 1998) in the version SWAT 2005, combines physically-based equations with empirical algorithms. Three runoff components are calculated sepa-rately. Developed for agricultural areas SWAT contains a complex tool to describe agricultural management practices and crop rotation. SWAT mainly considers non-point phos-phorus pathways and assumes that phosphos-phorus is primarily transported by surface runoff, which is calculated according to the SCS curve number method (Soil Conservation Ser-vice, 1972). Erosion is calculated by the MUSLE formu-lation (Williams, 1975) for each hydrological response unit (HRU). Sewage plants and industrial effluents are considered
as point sources by providing this information as external in-put data.
In this study SWAT divides the Weiße Elster catchment into 108 sub-catchments which represent the smallest spa-tially referenced units. The sub-catchments have an average size of 50 km2. They are sub-divided in HRUs based on sim-ilar landscape and soil characteristics. For the calibration of SWAT we used all twelve available gauging stations. Pa-rameters were calibrated by a trial-and-error approach using runoff time series and an objective function. Calibration is based on visual comparison of flow and phosphorus time se-ries and indices such as the coefficient of efficiency (Nash and Sutcliffe, 1970).
Considering model features some important differences stand out. Table 1 shows an overview of the different fea-tures of the model systems. Differences between the models pertain to spatial und temporal scale. GROWA/MEPhos is a grid-based model system and requires input data adequate for the fifty meter grid size. The spatial resolution of SWAT is coarser because the mean size of a HRU is about 5 km2.
Both models need climatological and hydrological input data with a daily resolution. However, their temporal reso-lution is quite different. SWAT also gives daily output val-ues whereas GROWA calculates only one mean value for a long-term period for each grid cell. Consequently, SWAT es-timates a daily process-based behaviour of runoff and phos-phorus load. Since GROWA gives results of a period of at least five years we compared the mean annual values for a six-year period from 1998 until 2003.
The applicability of the models differs according to the aim of a study. Due to eight different options for phosphorus pathways MEPhos can be applied to large catchments with very different phosphorus sources. In contrast to MEPhos, SWAT can be used to investigate changes in agricultural management practices.
If one applies different phosphorus models, it is essential to be aware of potentially different concepts of phosphorus pathway approaches. Only a comparison based on similar pathway definitions leads to meaningful results. Keeping this in mind we decided to compare only the phosphorus input from the catchment without looking at in-stream retention processes.
80 B. Guse et al.: Application of two phosphorus models with different complexities
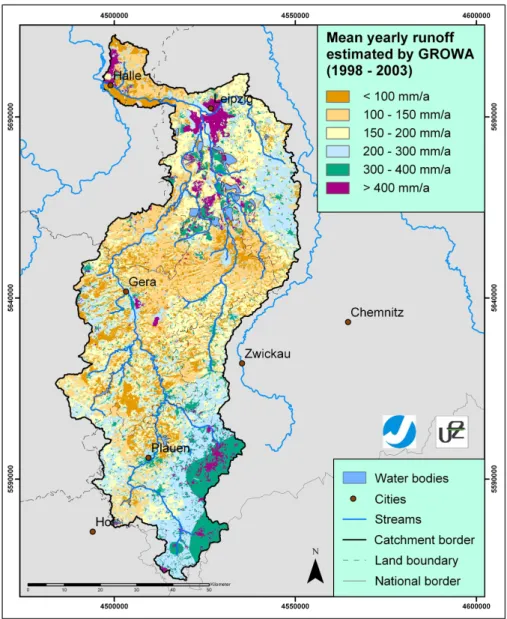
Fig. 2. Mean annual runoff in the catchment of the Weiße Elster estimated by GROWA.
Fig. 3. Validation of the mean annual total runoff estimated by GROWA in selected gauged sub-catchments.
4 Results and discussion
4.1 Hydrology 4.1.1 GROWA
The spatial variation of catchment runoff modelled by GROWA shows that the highest annual values (>400 mm/a) were achieved in the southern mountainous part of the basin. This results from high precipitation and low evapotranspira-tion rates in the catchment. High values of runoff were also modelled in urban areas where GROWA estimates a lower evapotranspiration rate (Fig. 2).
The validation for the hard rock region shows that the model results fit well with the measurements (Fig. 3). Here the bias is always lower than 12%. As expected, the results
B. Guse et al.: Application of two phosphorus models with different complexities 81
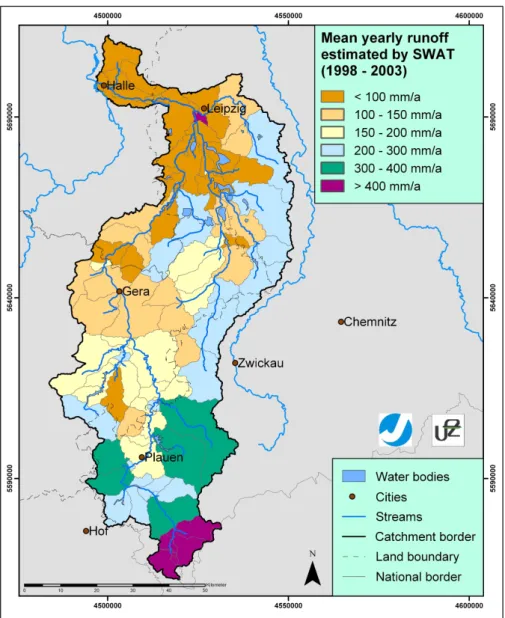
Fig. 4. Mean annual runoff in the catchment of the Weiße Elster estimated by SWAT.
at gauges in lower parts of the catchment show a high differ-ence from the measured runoff which is strongly infludiffer-enced by open-pit mining activities.
4.1.2 SWAT
SWAT estimates the highest runoff for those sub-catchments situated at the most upper gauge sites (Fig. 4). This results not only from the highest precipitation but is also based on a relatively low evaporation in the forested areas. In the most southern part sixty percent of the area is covered by forest. The lowest values are calculated for the sub-catchments in the lowland areas in the northern part of the catchment.
Both calibration and validation runs show an overestima-tion of total runoff (Fig. 5), both in the upper and the lower parts of the catchment. In the central parts SWAT estimates
Fig. 5. Calibration and validation of the mean annual total runoff estimated by SWAT at gauged sub-catchments.
a bias in runoff lower than 10%. In these sub-catchments there is a low percentage of forested or urban areas. In the
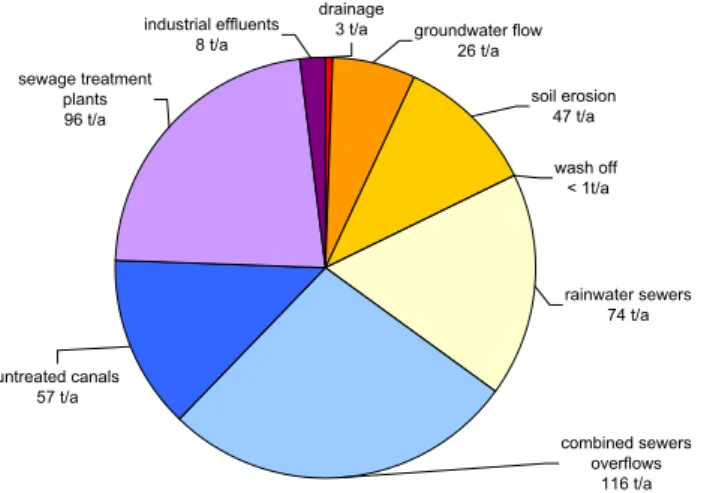
82 B. Guse et al.: Application of two phosphorus models with different complexities groundwater flow 26 t/a drainage 3 t/a industrial effluents 8 t/a sewage treatment plants 96 t/a untreated canals 57 t/a combined sewers overflows 116 t/a rainwater sewers 74 t/a soil erosion 47 t/a wash off < 1t/a
Fig. 6. Phosphorus input calculated by MEPhos in the catchment of the Weiße Elster.
validation run six of the twelve gauging stations have a co-efficient of efficiency (Nash and Sutcliffe, 1970) higher than 0.65. The largest discrepancies are in the upper region with the highest percentage of forests and in the urban regions in the lower part of the catchment.
4.1.3 Comparison
We compared the results of the two models for 108 sub-catchments, showing the highest differences between the model results to be in the northern or southern parts of the catchment. In the upper parts SWAT calculates a higher runoff than GROWA. In the north we find the opposite ten-dency with the results of GROWA being higher. In the central parts, the mean annual runoff is similar for the two models.
The differences between the models cannot be explained by model complexity or scale. The reasons lie in the under-lying assumptions in the model process descriptions. SWAT, which is the more complex of the two models, does not esti-mate runoff in sub-catchments better than GROWA. The rea-sons lie in the underlying assumptions in the model process descriptions. GROWA has been developed to quantify the water balance of heterogeneous regions, hence it can be ap-plied consistently to agriculture, forested and urban regions. The application of SWAT is tailored to agricultural areas, thus forests and urban areas are simulated with significantly higher structural model uncertainty. This explains the high differences in SWAT between the simulated and measured runoff in the upper catchment areas.
In the northern areas, which are influenced by open-pit mining activities, the GROWA results show higher differ-ences from the observed runoff rates than the SWAT results. Since GROWA does not utilise observed runoff data from heavily modified catchment areas for model calibration, the calculated values represent “undisturbed hydrological condi-tions”. wash off 47 t/a soil erosion 274 t/a groundwater runoff 50 t/a sewage treatment plant 96 t/a industrial effluents 8 t/a
Fig. 7. Phosphorus input calculated by SWAT in the catchment of the Weiße Elster.
4.2 Phosphorus transport 4.2.1 MEPhos
MEPhos estimates a mean annual total phosphorus load of 427 t/a in the catchment of the Weiße Elster.
The simulation of the various phosphorus input options does not yield a dominant pathway (Fig. 6), but the input from point sources is higher than the input from non-point sources. The low phosphorus input by artificial drainage from agricultural land can be explained by a lack of data on drainage tiles in that area. Due to the prescribed restriction of the erosion source area to a buffer strip around the flow path network only about seven percent of the catchment can con-tribute to a phosphorus input via soil erosion. This explains the relatively low phosphorus input by soil erosion.
4.2.2 SWAT
SWAT calculates a mean annual total phosphorus input of 475 t/a. 58% of the estimated phosphorus input is contributed by erosion (274 t/a, Fig. 7). Considering that the HRUs are not spatially referenced, it must be noted that SWAT cal-culates sediment yield without taking the distance between source areas and the stream network into account.
Apart from soil erosion, wash off (47 t/a) and groundwater flow (50 t/a) are also important pathways. Point sources con-tribute only 22% to the mean annual total phosphorus input. 4.2.3 Comparison
Even though the two models calculate similar mean annual total phosphorus loads, there are considerable differences in the phosphorus inputs via specific pathways.
The phosphorus input of sewage treatment plants and in-dustrial effluents is identical in both models because the same data were used. Additionally, MEPhos considers all other
B. Guse et al.: Application of two phosphorus models with different complexities 83 possible sources yielding a higher input from point sources
in the study area. We conclude that MEPhos estimates the input from point sources more realistically than SWAT.
The estimation of non-point phosphorus input by SWAT is higher than the estimation by MEPhos. This is mainly re-lated to the modelled soil erosion. SWAT estimates a higher surface runoff than MEPhos. The phosphorus input by ero-sion in MEPhos is lower because of the prescribed restriction of the erosion source area. Consequently, SWAT estimates a phosphorus load by erosion which is six times higher than that calculated by MEPhos.
It is obvious that the estimated phosphorus input for the specific pathways is significantly different. Due to the lack of adequate phosphorus concentrations measurements and path-way observations, an adequate comparison and evaluation of the modelled total phosphorus input could not be made.
5 Conclusions
The aim of this study was to simulate the water balance and specific phosphorus input of the Weiße Elster River using two models of different complexity and focus. Addition-ally, the model results of total runoff and specific phosphorus pathways were compared.
The more complex model SWAT does not estimate the catchment runoff better than the empirical model system GROWA/MEPhos. Both models calculate reasonable results in the central part of the Weiße Elster catchment. With regard to the water balance modules the different foci of the models can explain the differences in the runoff results. Each model calculates the best result in its scope of application.
Phosphorus input by the specific pathways differs due to the different aims of each model. There are large differences in the estimated pathway of soil erosion, which can be ex-plained by the different calculation algorithms. It is impor-tant to consider all relevant processes and therefore appro-priate data are required. Furthermore, the partial lack of ad-equate data in our study does not allow us to conclude if one model performs better than the other.
Uncertainty analysis in modelling phosphorus pathways may show advantages and limitations of hydrological and phosphorus models. For future estimations of phosphorus load a detailed consideration of the specific pathways is es-sential. In particular, a better understanding of the non-point phosphorus processes could improve the model results. For this purpose adequate phosphorus measurement programmes are necessary.
Acknowledgements. This work was a joint project of two Helmholtz centres, the Helmholtz Centre for Environmental Re-search – UFZ in Magdeburg and the ReRe-search Centre Juelich. For financial support we thank the two centres and the University of Potsdam. We also thank all colleagues from these centres who sup-ported this work.
This study was supported by data from the State Agency of Envi-ronment and Geology of the Free State of Saxony, the Department of Regional Development, Agriculture and Environment of Saxony-Anhalt and the Department of Agriculture, Conservation of Nature and Environment of the Free State of Thuringia.
The authors thank the two unknown reviewers. Edited by: K.-E. Lindenschmidt
Reviewed by: G. Petersen and an anonymous referee
References
Arnold, J., Srinivisan, R., Muttiah, R., and Williams, J.: Large area hydrologic modeling and assessment – Part 1: Model develop-ment, J. Am. Water Resour. As., 34/1, 73–89, 1998.
Behrendt, H., Huber, P., Kornmilch, M., Opitz, D., Schmoll, O., Scholz, G. and, Uebe, R.: Nutrient Emissions into River Basins of Germany. Institute of Freshwater Ecology and Inland Fish-eries, Research report 23/00, Berlin, 2000.
Bogena, H., Kunkel, R., Sch¨obel, T., Schrey, H. P., and Wend-land, F.: Die Grundwasserneubildung in Nordrhein-Westfalen, Schriften des Forschungszentrums Juelich – Environment, Vol-ume 37, 2003.
EU: Directive 2000/60/EC of the European Parliament and of the Council establishing a framework for the Community action in the field of water policy, 2000.
Groenendijk, P. and Kroes, J.: Modelling the nitrogen and phospho-rus leaching to groundwater and surface water with ANIMO 3.5, Winand Staring Centre Report Nr. 144, Wageningen, NL, 1999. Klauer, B., Petry, D., and Rode, M. (Eds.):
Flussgebietsman-agement nach EU-Wasserrahmenrichtlinie – Entscheidungsun-terst¨utzung f¨ur die Aufstellung von Maßnahmenprogrammen il-lustriert am Beispiel der Weißen Elster, Metropolis Verlag, Mar-burg, 330 Seiten, in press, 2007.
Kunkel, R. and Wendland, F.: The GROWA98 model for water bal-ance analysis in large river basis – the river Elbe case study, J. Hydrol., 259, 152–162, 2002.
Nash, J. and Sutcliffe, J.: River flow forecasting through conceptual models, part I: a discussion of principles, J. Hydrol., 10, 282– 290, 1970.
Rekolainen, S., Posch, M., K¨am¨ari, J., and Ekholm, P.: Evaluation of the accuracy and precision of annual phosphorus load esti-mates from two agricultural basins in Finland, J. Hydrol., 128, 237–255, 1991.
Rode, M. and Frede, H.-G.: Modification of AGNPS for agricultural land and climate condition in central Germany, J. Environ. Qual., 26(1), 165–172, 1997.
Rode, M. and Suhr, U.: Uncertainties in selected river water quality data, Hydrol. Earth Syst. Sci., 11, 863–874, 2007,
http://www.hydrol-earth-syst-sci.net/11/863/2007/.
Schwertmann, U., Vogl, W., and Kainz, M.: Bodenerosion durch Wasser – Vorhersage des Abtrags und Bewertung von Gegen-maßnahmen, 2. Auflage, Eugen Ulmer, Stuttgart, 1987. Sharpley, A. and Rekolainen, S.: Phosphorus in Agriculture and
Its Environmental Implications, in: Phosphorus Loss from Soil to Water, edited by: Tunney, H., Carton, O., Brookes, P., and Johnston, A., Center for Agriculture and Biosciences, New York, pp. 1–53, 1997.
84 B. Guse et al.: Application of two phosphorus models with different complexities Soil Conservation Service: Section 4: Hydrology, National
Engi-neering Handbook, SCS, 1972.
Tetzlaff, B.: Die Phosphatbelastung großer Flusseinzugsgebiete aus diffusen und punktuellen Quellen, Schriften des Forschungszen-trums Juelich – Environment, Volume 65, 287 pp., 2006. Tetzlaff, B., D¨orh¨ofer, G., Kunkel, R., and Wendland, F.:
GIS-gest¨utzte Ermittlung der Grundwasserneubildung in Niedersach-sen, Wasser & Boden, Band 55, 2003.
Williams, J.: Sediment-yield prediction with universal equation using runoff energy factor, Present and prospective technology for predicting sediment yield and source: Proceedings of the sediment-yield workshop, USDA Sedimentation Lab., Oxford, MS, 1975.