HAL Id: hal-00296114
https://hal.archives-ouvertes.fr/hal-00296114
Submitted on 18 Jan 2007
HAL is a multi-disciplinary open access
archive for the deposit and dissemination of
sci-entific research documents, whether they are
pub-lished or not. The documents may come from
teaching and research institutions in France or
abroad, or from public or private research centers.
L’archive ouverte pluridisciplinaire HAL, est
destinée au dépôt et à la diffusion de documents
scientifiques de niveau recherche, publiés ou non,
émanant des établissements d’enseignement et de
recherche français ou étrangers, des laboratoires
publics ou privés.
M. Höpfner, T. von Clarmann, H. Fischer, B. Funke, N. Glatthor, U.
Grabowski, S. Kellmann, M. Kiefer, A. Linden, M. Milz, et al.
To cite this version:
M. Höpfner, T. von Clarmann, H. Fischer, B. Funke, N. Glatthor, et al.. Validation of MIPAS
ClONO2 measurements. Atmospheric Chemistry and Physics, European Geosciences Union, 2007, 7
(1), pp.257-281. �hal-00296114�
www.atmos-chem-phys.net/7/257/2007/ © Author(s) 2007. This work is licensed under a Creative Commons License.
Chemistry
and Physics
Validation of MIPAS ClONO
2
measurements
M. H¨opfner1, T. von Clarmann1, H. Fischer1, B. Funke2, N. Glatthor1, U. Grabowski1, S. Kellmann1, M. Kiefer1,
A. Linden1, M. Milz1, T. Steck1, G. P. Stiller1, P. Bernath3, C. E. Blom1, Th. Blumenstock1, C. Boone3, K. Chance4,
M. T. Coffey5, F. Friedl-Vallon1, D. Griffith6, J. W. Hannigan5, F. Hase1, N. Jones6, K. W. Jucks7, C. Keim1,
A. Kleinert1, W. Kouker1, G. Y. Liu1, E. Mahieu8, J. Mellqvist9, S. Mikuteit1, J. Notholt10, H. Oelhaf1, C. Piesch1,
T. Reddmann1, R. Ruhnke1, M. Schneider1, A. Strandberg9, G. Toon11, K. A. Walker3, T. Warneke10, G. Wetzel1,
S. Wood12, and R. Zander8
1Institut f¨ur Meteorologie und Klimaforschung, Forschungszentrum Karlsruhe, Germany 2Instituto de Astrof´ısica de Andaluc´ıa, Granada, Spain
3Department of Chemistry, University of Waterloo, Ontario, Canada
4Harvard-Smithsonian Center for Astrophysics, Atomic and Molecular Physics Division, Cambridge, MA, USA 5Atmospheric Chemistry Division, National Center for Atmospheric Research, Boulder, CO, USA
6Department of Chemistry, University of Wollongong, Australia
7Harvard-Smithsonian Center for Astrophysics, Optical and Infrared Astronomy Division, Cambridge, MA, USA 8Institut d’Astrophysique et de G´eophysique, Universit´e de Li`ege, Belgium
9Department of Radio and Space Science, Chalmers University of Technology, G¨oteborg, Sweden 10Institut f¨ur Umweltphysik, Universit¨at Bremen, Germany
11Jet Propulsion Laboratory, California Institute of Technology, Pasadena, CA, USA 12National Institute of Water and Atmospheric Research, Lauder, New-Zealand
Received: 8 August 2006 – Published in Atmos. Chem. Phys. Discuss.: 5 October 2006 Revised: 10 January 2007 – Accepted: 10 January 2007 – Published: 18 January 2007
Abstract. Altitude profiles of ClONO2 retrieved with
the IMK (Institut f¨ur Meteorologie und Klimaforschung) science-oriented data processor from MIPAS/Envisat (Michelson Interferometer for Passive Atmospheric Sound-ing on Envisat) mid-infrared limb emission measurements between July 2002 and March 2004 have been validated by comparison with balloon-borne (Mark IV, FIRS2, MIPAS-B), airborne (MIPAS-STR), ground-based (Spitsbergen, Thule, Kiruna, Harestua, Jungfraujoch, Iza˜na, Wollongong, Lauder), and spaceborne (ACE-FTS) observations. With few exceptions we found very good agreement between these instruments and MIPAS with no evidence for any bias in most cases and altitude regions. For balloon-borne measurements typical absolute mean differences are below 0.05 ppbv over the whole altitude range from 10 to 39 km. In case of ACE-FTS observations mean differences are below 0.03 ppbv for observations below 26 km. Above this altitude the comparison with ACE-FTS is affected by the photochemically induced diurnal variation of ClONO2.
Correction for this by use of a chemical transport model led to an overcompensation of the photochemical effect by up to
Correspondence to: M. H¨opfner
0.1 ppbv at altitudes of 30–35 km in case of MIPAS-ACE-FTS comparisons while for the balloon-borne observations no such inconsistency has been detected. The comparison of MIPAS derived total column amounts with ground-based observations revealed no significant bias in the MIPAS data. Mean differences between MIPAS and FTIR column abundances are 0.11±0.12×1014cm−2 (1.0±1.1%) and
−0.09±0.19×1014cm−2 (−0.8±1.7%), depending on the
coincidence criterion applied. χ2tests have been performed to assess the combined precision estimates of MIPAS and the related instruments. When no exact coincidences were available as in case of MIPAS – FTIR or MIPAS – ACE-FTS comparisons it has been necessary to take into consideration a coincidence error term to account for χ2deviations. From the resulting χ2profiles there is no evidence for a systematic over/underestimation of the MIPAS random error analysis.
1 Introduction
Chlorine nitrate (ClONO2) is a major temporary reservoir
gas of chlorine in the stratosphere. It plays an important role in the processes of ozone depletion (Solomon, 1999; Brasseur and Solomon, 2005, and references therein).
The amount of ozone depletion through chlorine catalytic cycles is controlled by the partitioning between active (ozone destroying) chlorine species like Cl and ClO and their ozone-inactive reservoir gases ClONO2 and HCl. ClONO2 is
formed by the reaction of ClO with NO2:
ClO + NO2+ M → ClONO2+ M, (1)
and destroyed via photolysis in the ultraviolet mainly by:
ClONO2+ hν → Cl + NO3. (2)
Additionally, in presence of solid or liquid particles ClONO2 can be converted heterogeneously into reactive
chlorine by the reaction with HCl
ClONO2(g) + HCl(s, l) → Cl2(g) + HNO3. (3)
or by hydrolysis
ClONO2(g) + H2O(s, l) → HOCl(g) + HNO3. (4)
Subsequently, HOCl can be converted rapidly into active chlorine by photolysis or by heterogeneous reaction with HCl.
Irregularly, large stratospheric aerosol loading caused by volcanic eruptions may lead to enhanced global chlorine activation (Solomon, 1999). Regularly, during Arctic and Antarctic winter heterogeneous chlorine activation takes place at polar stratospheric cloud (PSC) particles which is a prerequisite for the fast catalytic destruction of ozone in springtime. In the Arctic polar vortex the recovery of chlo-rine into the reservoir gases predominantly takes place via reaction (1) leading to large concentrations of ClONO2in the
lower stratosphere (von Clarmann et al., 1993; Oelhaf et al., 1994). However, under conditions of strong ozone depletion, which is usually the case in the springtime Antarctic lower stratosphere, active chlorine is primarily converted into HCl (Douglass et al., 1995; Mickley et al., 1997; Grooss et al., 1997; Michelsen et al., 1999):
Cl + CH4→ HCl + CH3. (5)
Though ClONO2 has recently been observed by in-situ
methods (Stimpfle et al., 1999; Marcy et al., 2005), by far most measurements have been made remotely by analysis of its rovibrational bands in the mid-infrared atmospheric win-dow through high-resolution spectroscopy.
Stratospheric ClONO2was first detected by solar
absorp-tion spectroscopy from balloons (Murcray et al., 1979; Rins-land et al., 1985) and from space (Zander et al., 1986) by the Atmospheric Trace Molecule Spectroscopy (ATMOS) in-strument. ATMOS also provided spaceborne measurements of ClONO2profiles in March 1992, April 1993 and
Novem-ber 1994 (Rinsland et al., 1994, 1995, 1996; Zander et al., 1996). The first space-borne solar occultation sensor mea-suring ClONO2continuously (between 30 October 1996 and
30 June 1997) at high latitudes has been the Improved Limb Atmospheric Spectrometer (ILAS) (Nakajima et al., 2006).
Column amounts from ground-based solar absorption ob-servations have been first reported by Zander and Demoulin (1988) over the Jungfraujoch and by Farmer et al. (1987) over McMurdo.
Examples for sun-independent determination of ClONO2
through mid-IR thermal emission spectroscopy are balloon-borne measurements by the Michelson Interferometer for Passive Atmospheric Sounding (MIPAS-B) (von Clarmann et al., 1993; Oelhaf et al., 1994), airborne observation by MIPAS-FT (Blom et al., 1995), and spaceborne measure-ments by the Cryogenic Infrared Spectrometers and Tele-scopes for the Atmosphere (CRISTA) (Riese et al., 2000) and by the Cryogenic Limb Array Etalon Spectrometer (CLAES) (Roche et al., 1993, 1994). CLAES obtained nearly global fields of ClONO2 from 25 October 1991 until 5 May 1993
which have been validated by Mergenthaler et al. (1996). In this paper we report on the validation of atmospheric ClONO2profiles derived from MIPAS observations made on
board the polar orbiting satellite Envisat between mid-2002 and end of March 2004.
2 MIPAS ClONO2data analysis
MIPAS is a Fourier transform spectrometer sounding the thermal emission of the earth’s atmosphere between 685 and 2410 cm−1 (14.6–4.15 µm) in limb geometry. The max-imum optical path difference (OPD) of MIPAS is 20 cm. For the present data analysis the spectra have been apodised with the Norton-Beer strong function (Norton and Beer, 1976) resulting in an apodised spectral resolution (FWHM) of 0.048 cm−1. The field-of-view of the instrument at the tangent points is about 3 km in the vertical and 30 km in the horizontal. In the standard observation mode in one limb-scan 17 tangent points are observed with nominal altitudes 6, 9, 12,..., 39, 42, 47, 52, 60, and 68 km. In this mode about 73 limb scans are recorded per orbit with 14.3 orbits per day. The measurements of each orbit cover nearly the complete latitude range from about 87◦S to 89◦N. In the de-scribed standard mode MIPAS measured quasi-continuously from July 2002 until end of March 2004 when operation was stopped for investigation of instabilities of the interferome-ter drive velocity. Measurements have been resumed in early 2005, however, with poorer spectral resolution and finer tan-gent altitude grid.
Here we concentrate on the validation of ClONO2profiles
derived from the first measurement period. ClONO2is one
of the trace-gases retrieved at the Institut f¨ur Meteorologie und Klimaforschung, Forschungszentrum Karlsruhe (IMK) as an off-line product and is available at http://www-imk.fzk. de/asf/ame/envisat-data/. ClONO2is not included in the
op-erational level 2 data analysis under ESA responsibility. The present validation work is performed with IMK data versions V3O CLONO2 10 and V3O CLONO2 11 which are
consis-tent. These retrievals are based on reprocessed ESA level 1b products (calibrated spectra) Version 4.61 and 4.62.
The data processing chain for ClONO2has been described
in detail by H¨opfner et al. (2004). The IMK version of the data discussed there was V1 CLONO2 1 which differs from the version V3O CLONO2 10/11 in several aspects: (1) near-real-time ESA level 1b data version 4.53 was used then, (2) latitude-band dependent a-priori profiles were as-sumed while for V3O CLONO2 10/11 flat zero a-priori pro-files are used, and (3) the height-dependent regularization strength has been changed to allow for more sensitivity at lower and higher altitudes.
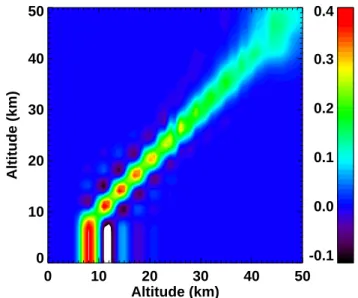
For characterisation of the altitude resolution of a typical ClONO2profile of the data version used in this paper, Fig. 1
shows as an example the averaging kernel matrix A of a mid-latitude MIPAS measurement. This observation is validated against a MIPAS-B observation below in Sect. 3.1.1. The rows of A represent the contributions of the real profile to the retrieved profile whereas the columns are the response of the retrieval scheme to a delta function in the related alti-tude (Rodgers, 2000). The full width at half maximum of the columns of A can be used as a measure for the vertical reso-lution which ranges from 3.2 to 8.5 km in the altitude region 8 to 40 km for our ClONO2retrievals.
The linear error analysis of the previous example from mid-latitudes is given in Table 1. It shows that the main er-ror sources are the spectral noise of the instrument and the uncertainty of spectroscopic data. This is consistent with the error estimation of a polar profile discussed in H¨opfner et al. (2004). For the comparisons with other measurements we use the total estimated random error which we define as the total error given in Table 1 without the error due non-local thermodynamic equilibrium (non-LTE), which is any-way negligible, and due to spectroscopy. The spectroscopic error is neglected since most experiments use the same spec-troscopic dataset by Wagner and Birk (2003) as will be de-scribed below.
3 Comparison with balloon- and airborne
measure-ments: MIPAS-B, Mark IV, FIRS, MIPAS-STR
In this chapter we discuss the comparison of single MIPAS ClONO2altitude profiles with collocated ones obtained
dur-ing field campaigns of one aircraft- and various balloon-borne instruments.
For the comparison, the correlative ClONO2profiles xref,
which, in general, have a better altitude resolution than MI-PAS, are adjusted by application of the MIPAS averaging kernel AMIPAS. Since the a-priori profile of MIPAS retrievals xa,MIPASis zero at all altitudes, Eq. (4) of Rodgers and
Con-nor (2003) ˜xref=xa,MIPAS+AMIPAS(xref−xa,MIPAS)
simpli-fies to
˜
xref= AMIPASxref. (6)
0 10 20 30 40 50 Altitude (km) 0 10 20 30 40 50 Altitude (km) -0.1 0.0 0.1 0.2 0.3 0.4
Fig. 1. Averaging kernel of ClONO2retrieval from MIPAS limb-scan on 24 September 2002, 22:07 UTC at 46.1◦N/0.6◦E (Best co-incidence with MIPAS-B: Table 3 and Fig. 2).
Here we assume that the content of the a-priori information in the better resolved correlative profiles is negligibly small (von Clarmann and Grabowski, 2006).
As some of the correlative measurements were not ob-tained during dedicated validation campaigns with exact matches in time and space we have performed a correction for the profile coincidence error by use of the KASIMA (Karlsruhe Simulation model of the Middle Atmosphere) CTM (Chemical Transport Model) (Kouker et al., 1999). From a multi-annual run with a horizontal resolution of ap-proximately 2.6×2.6◦(T42), a vertical resolution of 0.75 km from 7 to 22 km and an exponential increase above with a resolution of about 2 km in the upper stratosphere, and a model time step of 6 min ClONO2profiles were interpolated
to the time and position of the measurements of the correla-tive instruments and of MIPAS: xCTMref and xCTMMIPAS. For the intercomparison, the original MIPAS profiles xMIPAS were
transformed to the time and position of the correlative mea-surements by adding the difference between the two model results:
xtransMIPAS= xMIPAS+ xCTMref − x CTM
MIPAS. (7)
The difference profiles xMIPAS− ˜xref and xtransMIPAS− ˜xref are
analysed with regard to systematic altitude dependent biases and the validity of the combined estimated errors.
Below, each instrument (see Table 2 for an overview) and the results of single measurement campaigns will be de-scribed in detail. This is followed by a summary of the mean difference profiles per instrument.
Table 1. Error budget at selected altitudes for the retrieval of ClONO2from MIPAS limb-scan on 24 September 2002, 22:07 UTC at 46.1◦N/0.6◦E. The absolute errors in pptv are given outside and the relative errors (%) inside the brackets.
Height Total Instrument Interf. Temp. Spectro. Spect.
[km] Errora Noise gasesb Temp.c gradientd Pointinge dataf Gaing ILSh shifti Non-LTEj
11 18(321) 17(300) <1(10) 2(41) <1(7) 5(92) 3(53) <1(7) 1(23) <1(<1) <1(<1) 14 24(118) 24(116) <1(4) 2(10) <1(1) 2(9) 3(15) <1(1) <1(<1) <1(<1) <1(<1) 17 34(32) 33(31) <1(<1) 2(2) <1(<1) 8(7) 1(<1) <1(<1) 1(1) <1(<1) <1(<1) 20 45(13) 41(12) 1(<1) <1(<1) <1(<1) 12(3) 14(4) 2(<1) 5(1) 3(<1) <1(<1) 23 61(7) 49(6) 3(<1) 5(<1) <1(<1) 3(<1) 34(4) <1(<1) 10(1) 6(<1) <1(<1) 26 75(7) 55(5) 3(<1) 8(<1) <1(<1) 7(<1) 47(5) <1(<1) 13(1) 10(<1) <1(<1) 29 89(7) 60(5) 5(<1) 12(<1) 1(<1) 23(2) 55(4) 2(<1) 15(1) 17(1) 1(<1) 32 97(10) 68(7) 5(<1) 13(1) 1(<1) 34(3) 51(5) 3(<1) 16(2) 22(2) <1(<1) 35 91(12) 73(9) 10(1) 7(<1) <1(<1) 28(4) 44(6) 1(<1) 7(<1) 4(<1) <1(<1) 38 89(21) 78(19) 10(2) 1(<1) 2(<1) 10(2) 34(8) <1(<1) 3(<1) 21(5) <1(<1) 41 103(26) 95(24) 5(1) 9(2) 4(<1) 9(2) 22(5) 2(<1) 14(3) 28(7) <1(<1)
aDefined as quadratic sum of all individual errors. bThe variability of the interfering gases which where not jointly fitted is assumed on basis of their climatological variability.cBased on temperature uncertainty of 1 K.dEstimated errors due to horizontal inhomogeneities of temperature of 0.01 K/km. For standard processing horizontal inhomogeneities were neglected in ClONO2retrievals. eBased on tangent altitude uncertainty of 150 m. fBased on uncertainty of spectroscopic data of 5% (worst case) for ClONO2(Wagner and Birk, 2003) and information by J. M. Flaud, personal communication, 2003).gBased on gain calibration error of 1%. hBased on an error of the assumed instrumental line-shape of 3%.iBased on a residual spectral shift error of 0.0005 cm−1.jModel error based on radiative transfer calculations including local thermodynamic equilibrium (LTE) versus calculations without considering LTE. For standard processing non-LTE was neglected in ClONO2retrievals.
Table 2. Comparison of instrumental and data processing details of measurement systems of ClONO2vertical profiles addressed in this study.
Instrument MIPAS MIPAS-B Mark IV FIRS2 MIPAS-STR ACE-FTS
Platform Satellite Balloon Balloon Balloon Aircraft Satellite
Observation geometry limb limb limb limb limb+upward limb
Observation mode emission emission solar occultation emission emission solar occultation
Vertical resolution [km] 3–4 2–3 2 3 2 3
Spectral resolution
(unapodised) [cm−1] 0.025 0.035 0.009 0.004 0.035 0.02
ClONO2window:
ν5Q-branch at 563 cm−1 no no no yes no no
ν4Q-branch at 780.2 cm−1 yes yes yes yes yes yes
ν2Q-branch at 1292.6 cm−1 no no yes no no yes
Spectroscopy:
Johnson et al. (1996) no no no yes no no
Wagner and Birk (2003) yes yes yes yes yes yes
3.1 MIPAS-B
MIPAS-B (Table 2) is a balloon-borne limb emission sounder with a similar spectral coverage (4–14 µm), a slightly lower spectral resolution (14.5 cm OPD) and a slightly better ver-tical resolution (2–3 km below the flight level) compared to MIPAS (Friedl-Vallon et al., 2004). The retrieval of ClONO2
vertical profiles from MIPAS-B calibrated spectra is per-formed with an inversion code based on the same line-by-line radiative transfer model, (KOPRA, Karlsruhe Optimized
and Precise Radiative transfer Algorithm, Stiller, 2000) as used in case of MIPAS data evaluation. For inversion of ClONO2profiles an equivalent scheme as for MIPAS/Envisat
with height-constant zero a-priori profile and the same spec-troscopic database has been applied (Wetzel et al., 2006; H¨opfner et al., 2004).
Table 3. Details for profile intercomparison during MIPAS-B campaigns on 24 September 2002, 20/21 March 2003, and 3 July 2003.
MIPAS-B MIPAS
Date/time lat/lon lat/lon date/time lat/lon lat/lon 1t 1d[km] 1d[km] 1PV 1PV
UTC @20 km @30 km UTC @20 km @30 km [h] @20 km @30 km @475 K @850 K 24SEP/22:25 47.5/0.6 46.2/0.8 24SEP/22:07 46.8/0.6 46.1/0.6 –0.3 72 10 0 3 24SEP/21:45 38.9/1.1 40.2/1.0 24SEP/22:05 37.4/2.5 36.7/2.6 0.3 208 405 –2 –7 24SEP/22:06 42.1/1.5 41.4/1.6 0.4 355 149 3 12 20MAR/20:55 65.7/13.9 66.6/19.7 20MAR/21:08 61.7/15.1 61.0/15.2 0.2 448 657 –2 171 20MAR/21:10 66.4/14.1 65.7/14.1 0.3 80 268 1 205 20MAR/21:11 71.2/14.1 70.5/14.1 0.3 617 496 2 96 21MAR/08:47 64.8/16.7 67.2/18.7 21MAR/09:06 69.8/18.4 70.5/18.8 0.3 560 368 4 70 21MAR/09:08 65.0/16.7 65.7/17.0 0.3 25 179 0 71 21MAR/09:09 60.3/15.3 60.9/15.6 0.4 511 709 –2 184 03JUL/00:33 70.6/28.5 69.6/25.6 03JUL/09:38 69.9/10.5 70.5/10.9 9.1 681 565 -1 3 03JUL/09:39 65.1/8.8 65.8/9.1 9.1 1020 815 –1 12 03JUL/19:31 71.2/39.3 70.5/39.3 19.0 396 523 1 –9 03JUL/01:06 69.7/8.1 69.1/12.0 03JUL/09:38 69.9/10.5 70.5/10.9 8.5 93 161 0 –4 03JUL/09:39 65.1/8.8 65.8/9.1 8.6 508 392 0 6 03JUL/19:31 71.2/39.3 70.5/39.3 18.4 1158 1048 3 -16 3.1.1 MIPAS-B: 24 September 2002
During the night 24–25 September 2002 a MIPAS-B balloon flight took place from Aire sur l’Adour in southern France (Oelhaf et al., 2003). This flight was part of the Envisat vali-dation activities and perfectly coincident in time and location to MIPAS measurements of Envisat orbit 2975. Table 3 and Fig. 2 show that the northward-looking MIPAS-B limb scan matches nearly perfectly with the MIPAS profile at 22:07 UT. The southward-looking balloon profile coincides not as per-fectly as the northward-looking one with two MIPAS scans: the MIPAS limb-scan at 22:05 is closer below about 24 km altitude while 22:06 is closer above. The bottom panels of Fig. 2 show the comparison of the MIPAS-B and MIPAS pro-files. For MIPAS-B, both, the original profile and the profile smoothed with the MIPAS averaging kernel are given. The comparison of MIPAS with the northward-looking MIPAS-B measurement gives the best agreement with maximum differ-ences of 0.12 ppbv at 26 km altitude where MIPAS ClONO2
values are smaller than those of MIPAS-B by about twice the estimated combined total errors. With smaller excep-tions at 18 km and at 38 km, the differences are within the estimated error bars. The southern profile of MIPAS-B is within the combined estimated error bounds of either MI-PAS scan 22:05 or scan 22:06 almost over the whole altitude region. Only at around 27 km there exist slightly larger abso-lute differences. At these altitudes the vmr values of MIPAS-B are between those of the two MIPAS limb-scans 22:05 and 22:06. -5 0 5 35 40 45 50 MIPAS-B: 24 September 2002 05 37 21 69 08 32 0.0 0.5 1.0 vmr [ppb] 10 15 20 25 30 35 40 Altitude [km] -0.5 0.0 0.5 difference [ppb] 10 15 20 25 30 35 40 MB24Sep22:25 MI24Sep22:07 MB24Sep22:25 MI24Sep22:07 -5 0 5 35 40 45 50 08 38 23 69 08 32 69 08 32 0.0 0.5 1.0 vmr [ppb] 10 15 20 25 30 35 40 -0.5 0.0 0.5 difference [ppb] 10 15 20 25 30 35 40 MB24Sep21:45 MI24Sep22:05 MI24Sep22:06 MB24Sep21:45 MI24Sep22:05 MI24Sep22:06
Fig. 2. Top: location of MIPAS-B (red) and MIPAS (other colours) limb scans for the validation campaign on 24 September 2002. The numbers indicate the positions of selected tangent points. Bot-tom panels left part: Retrieved altitude profiles of ClONO2from MIPAS-B (dotted, red, xref in Eq. 6) and MIPAS (solid, other colours, xMIPAS). The solid red lines are the MIPAS-B observa-tions smoothed by the MIPAS averaging kernel ( ˜xref). Bars indicate estimated total random errors. Bottom panels right part: Difference profiles xMIPAS− ˜xrefand combined total errors for each MIPAS scan.
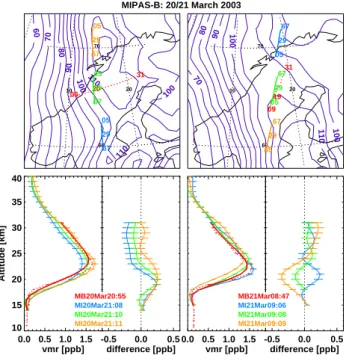
10 20 60 70 MIPAS-B: 20/21 March 2003 60 70 80 90 100 100 110 110 06 31 20 67 05 29 67 05 29 67 05 29 0.0 0.5 1.0 1.5 vmr [ppb] 10 15 20 25 30 35 40 Altitude [km] -0.5 0.0 0.5 difference [ppb] 10 15 20 25 30 35 40 MB20Mar20:55 MI20Mar21:08 MI20Mar21:10 MI20Mar21:11 MB20Mar20:55 MI20Mar21:08 MI20Mar21:10 MI20Mar21:11 10 20 60 70 70 80 90 100 100 110 09 31 19 67 05 29 67 05 29 67 05 29 0.0 0.5 1.0 1.5 vmr [ppb] 10 15 20 25 30 35 40 -0.5 0.0 0.5 difference [ppb] 10 15 20 25 30 35 40 MB21Mar08:47 MI21Mar09:06 MI21Mar09:08 MI21Mar09:09 MB21Mar08:47 MI21Mar09:06 MI21Mar09:08 MI21Mar09:09
Fig. 3. Same as Fig. 2 but for the validation campaign on 20/21 March 2003. Blue contour lines in the maps show the fields of potential vorticity (PV) (units: K m2kg−1s−1) at 550 K potential temperature. Using the criterion by Nash et al. (1996) the vortex boundary is located at 70 K m2kg−1s−1.
3.1.2 MIPAS-B: 20/21 March 2003
A further dedicated Envisat validation campaign with MIPAS-B took place above northern Scandinavia on 20/21 March 2003. In the evening of 20 March a coincidence with Envisat orbit 5508 and in the morning of 21 March with or-bit 5515 was achieved. MIPAS and MIPAS-B tangent points at and above about 23 km (550 K potential temperature) are located inside the polar vortex while at and below 20 km (475 K) the measurements are located in the vortex edge re-gion. For the evening observation the upper part of the bal-loon profile (26–31 km) is within the estimated errors of the northern MIPAS scan 21:11, though this is at 30 km altitude about 230 km farther away than scan 21:10 (Fig. 3 and Ta-ble 3). We attribute this to sampling of different airmasses by MIPAS-B which are more similar to scan 21:11 as indi-cated by the difference in PV values at 850 K (about 30 km altitude). The PV difference is smallest between balloon and the northern MIPAS scan (Table 3). We cannot prove this as-sumption by application of the CTM model correction Eq. (7) since this does not change the resulting differences signifi-cantly. This might be due to the limited horizontal resolution of the CTM model (2.6×2.6◦) which does not sufficiently resolve the gradients close to the vortex boundary.
From 25 to 22 km scan 21:10 fits the balloon observation within the combined errors. However, between 18 and 21 km the balloon values are up to 0.25 ppbv lower than those of
0 10 20 30 60 70 80 MIPAS-B: 3 July 2003 11 38 24 66 04 28 66 05 28 66 04 28 0.0 0.5 vmr [ppb] 10 15 20 25 30 35 40 Altitude [km] -0.5 0.0 0.5 difference [ppb] 10 15 20 25 30 35 40 MB03Jul00:33 MI03Jul09:38 MI03Jul09:39 MI03Jul19:31 MB03Jul00:33 MI03Jul09:38 MI03Jul09:39 MI03Jul19:31 0.0 0.5 vmr [ppb] 10 15 20 25 30 35 40 Altitude [km] -0.5 0.0 0.5 difference [ppb] 10 15 20 25 30 35 40 MB03Jul00:33 MI-mo03Jul09:38 MI-mo03Jul09:39 MI-mo03Jul19:31 MB03Jul00:33 MI-mo03Jul09:38 MI-mo03Jul09:39 MI-mo03Jul19:31 0 10 20 30 60 70 80 07 38 23 66 04 28 66 05 28 66 04 28 0.0 0.5 vmr [ppb] 10 15 20 25 30 35 40 -0.5 0.0 0.5 difference [ppb] 10 15 20 25 30 35 40 MB03Jul01:06 MI03Jul09:38 MI03Jul09:39 MI03Jul19:31 MB03Jul01:06 MI03Jul09:38 MI03Jul09:39 MI03Jul19:31 0.0 0.5 vmr [ppb] 10 15 20 25 30 35 40 -0.5 0.0 0.5 difference [ppb] 10 15 20 25 30 35 40 MB03Jul01:06 MI-mo03Jul09:38 MI-mo03Jul09:39 MI-mo03Jul19:31 MB03Jul01:06 MI-mo03Jul09:38 MI-mo03Jul09:39 MI-mo03Jul19:31
Fig. 4. Top and middle panel: same as Fig. 2 but for the valida-tion campaign on 2/3 July 2003. The bottom panels show the CTM transformed (see Eq. 7) MIPAS vmr profiles xtransMIPAS(labelled MI-mo in the legend) in their right parts and the related difference pro-files xtransMIPAS− ˜xrefin their left parts.
MIPAS. The reason for this is not clear but might be due to the different direction of the limb-observations at the vortex boundary at these altitudes: while MIPAS looked parallel to the boundary, MIPAS-B looked nearly orthogonal and thus, across stronger gradients in ClONO2.
The comparison on 21 March gives reasonable agreement between the balloon and the nearest MIPAS scan 09:08 above about 22 km. From 19–21 km the maximum difference of 0.14 ppbv is about twice the estimated error. However, in this altitude region a strong south-north gradient of the vmrs is visible in the three MIPAS observations and while MIPAS looked from south to north the viewing direction of MIPAS-B was vice versa. We suppose that this could be the reason for the observed deviations.
3.1.3 MIPAS-B: 3 July 2003
Another MIPAS-B flight above northern Scandinavia was on 2/3 July. Figure 4 shows the results for two limb-scans mea-sured in different directions with a time delay of about half an hour shortly after mid-night UTC. Both profiles are very similar since, compared to wintertime, there is not much ge-ographical variability of ClONO2 in Arctic summer.
Un-fortunately there have been no exact matches with MIPAS as shown in Table 3. Best coincidences are in the morn-ing (09:38, 09:39) and in the evenmorn-ing (19:31) of 3 July. In-terestingly, MIPAS-B ClONO2agrees best with the evening
scan with differences very close to the combined total errors (Fig. 4, middle). Especially above about 26 km the MIPAS-B and MIPAS evening profiles are systematically higher than the morning measurements. This can be explained by a dif-ferent exposure to sunlight, thus leading to a difdif-ferent degree of photolysis of ClONO2. While the solar zenith angle
dur-ing the two MIPAS-B and the MIPAS scan 19:31 was nearly equal with 84–86◦, it was 50◦and 46◦for 09:38 and 09:39, respectively.
Application of the CTM correction led to a significant im-provement of the comparison with the MIPAS morning scans (bottom panel of Fig. 4): above about 25 km the large differ-ences have disappeared and the agreement of MIPAS profiles 09:38 and 09:39 with the MIPAS-B observations has become nearly perfect. This result proves our assumption on the ef-fect of ClONO2photolysis on the comparison.
3.2 Mark IV
The Jet Propulsion Laboratory Mark IV instrument (Toon, 1991) is a balloon-borne Fourier transform infrared interfer-ometer with a very high spectral resolution (57 cm OPD). During sunrise or sunset it measures solar occultation spectra in limb geometry yielding a vertical resolution of about 2 km. Retrieval of trace gas profiles from Mark IV measurements is described by Sen et al. (1998). The Mark IV ClONO2
pro-files in the present study have been retrieved from the ν4
Q-branch at 780.2 cm−1and the ν2Q-branch at 1292.6 cm−1.
This is different from the MIPAS, MIPAS-B, MIPAS-STR and FIRS2 data evaluation where only the ν4 Q-branch
re-gion is used. Based on the commonly applied spectroscopic dataset by Wagner and Birk (2003), Oelhaf et al. (2001) have shown that MIPAS-B ClONO2profiles retrieved from the
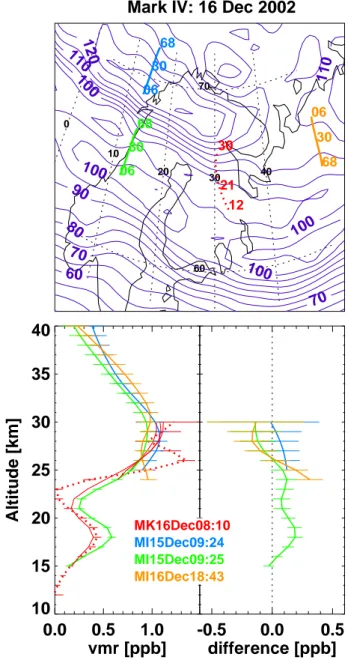
in-dividual bands agree to within 10%. 3.2.1 Mark IV: 16 December 2002
During the Mark IV flight on 16 December a ClONO2
pro-file has been obtained during sunrise. The location was in-side the polar vortex at each tangent altitude. As shown in Table 4 there was no exact coincidence with MIPAS. Near-est MIPAS profiles have been obtained also inside the vor-tex in the morning of 15 December (09:24, 09:25) and in
0 10 20 30 40 60 70
Mark IV: 16 Dec 2002
60 70 70 80 90 100 100 100 100 110 110 120 12 30 21 68 06 30 68 06 30 68 06 30
0.0
0.5
1.0
vmr [ppb]
10
15
20
25
30
35
40
Altitude [km]
-0.5
0.0
0.5
difference [ppb]
10 15 20 25 30 35 40 MK16Dec08:10 MI15Dec09:24 MI15Dec09:25 MI16Dec18:43 MK16Dec08:10 MI15Dec09:24 MI15Dec09:25 MI16Dec18:43Fig. 5. Same as Fig. 2 but for the Mark IV flight on 16 December 2002. Blue contour lines in the maps show the fields of potential vorticity (PV) (units: K m2kg−1s−1) at 550 K potential tempera-ture. Using the criterion by Nash et al. (1996) the vortex boundary is located at 86 K m2kg−1s−1.
the evening of 16 December (18:43). As shown in Fig. 5 the balloon profile is strongly structured with a minimum at around 23 km altitude. This was caused by chlorine activa-tion at polar stratospheric clouds (PSCs) which were abun-dant in the cold stratosphere in December 2002. Because of PSCs below 24 km MIPAS profiles stop at that altitude for scans 09:24 and 18:43 due to the fact that spectra of PSC-contaminated tangent altitudes are excluded from the data analysis. However, scan 09:25 was PSC free. This scan also shows a ClONO2minimum similar to Mark IV, which,
how-Table 4. Details for profile intercomparison during Mark IV campaigns on 16 December 2002, 1 April 2003, and 20 September 2003.
Mark IV MIPAS
Date/time lat/lon lat/lon date/time lat/lon lat/lon 1t 1d[km] 1d[km] 1PV 1PV
UTC @20 km @30 km UTC @20 km @30 km [h] @20 km @30 km @475 K @850 K 16DEC/08:10 64.4/31.2 66.7/30.7 15DEC/09:24 69.7/14.0 70.4/14.4 –22.8 944 774 2 149 15DEC/09:25 65.0/12.3 65.6/12.7 –22.7 894 815 –2 12 16DEC/18:43 66.5/50.7 65.8/50.8 10.6 929 901 2 –36 01APR/02:58 68.3/35.3 67.7/30.7 31MAR/20:24 66.4/25.6 65.7/25.6 –6.6 467 312 2 35 31MAR/20:25 71.2/25.6 70.5/25.6 –6.6 492 380 –1 –57 01APR/08:20 69.8/29.9 70.5/30.3 5.4 273 314 1 –68 01APR/08:22 65.0/28.2 65.7/28.5 5.4 477 237 2 –26 20SEP/01:28 34.3/-113.3 34.2/-111.3 20SEP/16:47 35.5/-98.2 36.2/–98.0 15.3 1381 1225 –2 38 20SEP/16:49 30.7/–99.5 31.4/–99.3 15.3 1359 1169 –2 –21 20SEP/18:28 35.5/–123.4 36.2/–123.2 17.0 926 1098 1 –9 20SEP/18:29 30.7/–124.6 31.4/–124.4 17.0 1129 1262 –2 –8 21SEP/05:40 31.4/–112.6 30.7/–112.5 28.2 325 401 0 –22 21SEP/05:42 37.3/–111.7 36.6/–111.6 28.2 369 272 4 42
ever, is not as deep due to the worse altitude resolution of MIPAS. This can be seen from the balloon profile convolved with the averaging MIPAS kernel which is much closer to the satellite observation. Somewhat larger differences exist in the regions between 17 and 20 km and 28–30 km. The latter one might be due to some instability of the Mark IV profile which is indicated by comparatively large error bars there. The differences below the minimum are likely due to the complex situation of chlorine activation in the polar vor-tex. Similar to the comparison with MIPAS-B in March 2003 near the vortex boundary, application of the CTM correction in this case had no significant effect on the comparison. 3.2.2 Mark IV: 1 April 2003
On 1 April 2003 Mark IV measured above northern Scan-dinavia outside the polar vortex during sunrise at about 03:00 UT. The polar vortex boundary was located about 10◦ further north. We compare this observation with four closely located MIPAS scans: two in the evening of 31 March (20:24, 20:25) and two in the morning of 1 April (08:20, 08:22) (see Table 4 and Fig. 6). The solar zenith angles were 106◦ and 102◦ for the evening observations and 68◦ and 64◦for the morning observations of MIPAS. Photolysis of ClONO2during daytime is the reason for the better
agree-ment of the balloon measureagree-ments with the evening obser-vation (20:24) of MIPAS above about 26 km (middle panel in Fig. 5). This is demonstrated by application of the CTM transformation (bottom panel in Fig. 6). The model cor-rection reduces the differences between the MIPAS morning scans and the Mark IV observation such that the agreement is within the combined error estimates.
3.2.3 Mark IV: 19/20 September 2003
The last Mark IV ClONO2profile which has been compared
to MIPAS was obtained during sunset over the United States on 20 September 2003, 01:28 UT. We compare this with the results from six surrounding limb-scans by MIPAS (Fig. 7) which have been measured 15–17 h (16:47, 16:49, 18:28, 18:29) and 28 h (05:40, 05:42) later. While the profiles closer in time have been obtained during day (SZA: 39–42◦) the later ones were measured during night (SZA: 136–140◦). General features of the MIPAS profiles are, first, the day-night differences above about 26 km and, second, a north-ward gradient in the region around the profile maximum dur-ing day (16:49 and 18:29 versus 16:47 and 18:28) and night (05:40 versus 05:42) (middle panel in Fig. 7). This gradient and the strong diurnal variations together with the fact that there is no good match make the use of the CTM correction necessary. It results in a much more compact comparison which does not show indications of significant biases (bot-tom panel of Fig. 7).
3.3 FIRS2
The FIRS-2 instrument is a thermal emission Fourier trans-form spectrometer operating in the far- (80–340 cm−1) and mid-infrared (330–1220 cm−1) spectral region. Interfero-grams are recorded with 120 cm OPD. (Johnson et al., 1995). Vertical profiles of ClONO2volume mixing ratios with an
al-titude resolution of about 3 km have been derived from FIRS observations using the ν5 Q-branch at 563 cm−1 (Johnson
et al., 1996) and the ν4 Q-branch at 780.2 cm−1
20
30 40
65 70 75
Mark IV: 01 Apr 2003
07 33 20 67 05 29 67 05 29 67 05 29 67 05 29 0.0 0.5 1.0 vmr [ppb] 10 15 20 25 30 35 40 Altitude [km] -0.5 0.0 0.5 difference [ppb] 10 15 20 25 30 35 40 MK01Apr02:58 MI31Mar20:24 MI31Mar20:25 MI01Apr08:20 MI01Apr08:22 MK01Apr02:58 MI31Mar20:24 MI31Mar20:25 MI01Apr08:20 MI01Apr08:22 0.0 0.5 1.0 vmr [ppb] 10 15 20 25 30 35 40 Altitude [km] -0.5 0.0 0.5 difference [ppb] 10 15 20 25 30 35 40 MK01Apr02:58 MI-mo31Mar20:24 MI-mo31Mar20:25 MI-mo01Apr08:20 MI-mo01Apr08:22 MK01Apr02:58 MI-mo31Mar20:24 MI-mo31Mar20:25 MI-mo01Apr08:20 MI-mo01Apr08:22
Fig. 6. Top and middle panels: same as Fig. 2 but for the Mark IV flight on 1 April 2003. The bottom panel shows the CTM trans-formed (see Eq. 7) MIPAS vmr profiles xtransMIPASin the right part (labelled MI-mo in the legend) and the related difference profiles xtransMIPAS− ˜xrefin the left part.
-130 -120 -110 -100 -90 30 35 40
Mark IV: 20 Sep 2003
0521 37 68 08 31 68 08 31 68 08 31 68 08 31 68 08 31 68 07 31 0.0 0.5 1.0 vmr [ppb] 10 15 20 25 30 35 40 Altitude [km] -0.5 0.0 0.5 difference [ppb] 10 15 20 25 30 35 40 MK20Sep01:28 MI20Sep16:47 MI20Sep16:49 MI20Sep18:28 MI20Sep18:29 MI21Sep05:40 MI21Sep05:42 MK20Sep01:28 MI20Sep16:47 MI20Sep16:49 MI20Sep18:28 MI20Sep18:29 MI21Sep05:40 MI21Sep05:42 0.0 0.5 1.0 vmr [ppb] 10 15 20 25 30 35 40 Altitude [km] -0.5 0.0 0.5 difference [ppb] 10 15 20 25 30 35 40 MK20Sep01:28 MI-mo20Sep16:47 MI-mo20Sep16:49 MI-mo20Sep18:28 MI-mo20Sep18:29 MI-mo21Sep05:40 MI-mo21Sep05:42 MK20Sep01:28 MI-mo20Sep16:47 MI-mo20Sep16:49 MI-mo20Sep18:28 MI-mo20Sep18:29 MI-mo21Sep05:40 MI-mo21Sep05:42
Fig. 7. Top and middle panels: same as Fig. 2 but for the Mark IV flight on 20 September 2003. The bottom panel shows the CTM transformed (see Eq. 7) MIPAS vmr profiles xtransMIPASin the left part (labelled MI-mo in the legend) and the related difference profiles xtransMIPAS− ˜xrefin the right part.
Table 5. Details of FIRS2 profile locations 19/20 September 2003.
FIRS2
Date/time lat/lon lat/lon
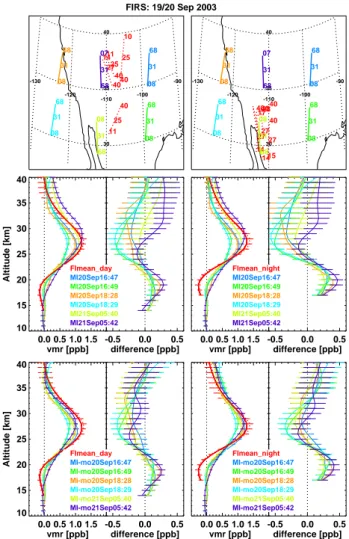
UTC 20 km 30 km 19SEP/18:00 31.6/–108.6 32.4/–107.5 19SEP/20:22 37.5/–109.4 36.7/–108.4 19SEP/22:08 38.2/–105.2 37.1/–105.6 19SEP/23:49 37.3/–110.5 36.5/–109.6 20SEP/02:49 32.7/–112.8 33.2/–111.3 20SEP/04:56 29.5/–110.2 25.8/–147.2 20SEP/07:18 32.6/–113.9 22.3/–178.1 20SEP/09:22 29.8/–113.2 31.1/–113.0 3.3.1 FIRS2: 19/20 September 2003
On 19/20 September 2003 the FIRS limb-emission instru-ment provided day- and nighttime profiles of ClONO2. The
time and location of these measurements are given in Table 5 and plotted in the top row of Fig. 8. The single balloon re-sults (not shown here) reveal a strong scatter and, especially around 20 km, tend to show negative values. To illustrate the comparison with MIPAS we used the mean day- and night-time balloon result (red curves in middle row of Fig. 8) which leads to a large scatter of the differences with respect to the single MIPAS profiles. This scatter is reduced by application of the CTM correction (bottom row of Fig. 8). Now, differ-ences are often within the estimated error bars, however, a positive MIPAS bias at 20 km, caused by negative FIRS val-ues there, and a negative bias between 25 and 30 km remain. 3.4 MIPAS-STR
MIPAS-STR is a Fourier transform emission instrument op-erating in the middle infrared spectral region with similar in-strumental specifications as MIPAS-B (see Table 2). During MIPAS validation campaigns MIPAS-STR has been operated from the high-altitude aircraft M55-Geophysica (Keim et al., 2004). One scan of MIPAS-STR consists of limb measure-ments to get profiles with high vertical resolution below the aircraft and upward observations to obtain limited informa-tion about the profile above. Retrieval of ClONO2profiles
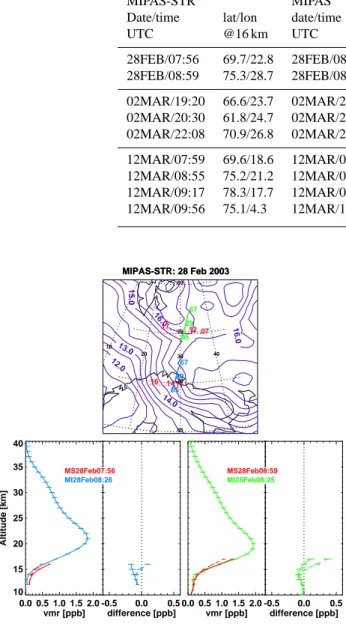
from MIPAS-STR calibrated spectra is performed with the same inversion tool and radiative transfer model as used for MIPAS-B data analysis (see above) (H¨opfner et al., 2001). 3.4.1 MIPAS-STR: 28 February, 2 and 12 March 2003 During end of February/beginning of March 2003 an Envisat validation campaign with the Geophysica high-altitude aircraft took place from Kiruna in northern Sweden. The MIPAS-STR instrument on-board Geophysica provided measurements of ClONO2 below the aircraft in close
coin--130 -120 -110 -100 -90 30 35 40 FIRS: 19/20 Sep 2003 11 40 25 11 40 25 10 40 25 14 40 27 68 08 31 68 08 31 68 08 31 68 08 31 68 08 31 68 07 31 0.0 0.5 1.0 1.5 vmr [ppb] 10 15 20 25 30 35 40 Altitude [km] -0.5 0.0 0.5 difference [ppb] 10 15 20 25 30 35 40 FImean_day MI20Sep16:47 MI20Sep16:49 MI20Sep18:28 MI20Sep18:29 MI21Sep05:40 MI21Sep05:42 FImean_day MI20Sep16:47 MI20Sep16:49 MI20Sep18:28 MI20Sep18:29 MI21Sep05:40 MI21Sep05:42 0.0 0.5 1.0 1.5 vmr [ppb] 10 15 20 25 30 35 40 Altitude [km] -0.5 0.0 0.5 difference [ppb] 10 15 20 25 30 35 40 FImean_day MI-mo20Sep16:47 MI-mo20Sep16:49 MI-mo20Sep18:28 MI-mo20Sep18:29 MI-mo21Sep05:40 MI-mo21Sep05:42 FImean_day MI-mo20Sep16:47 MI-mo20Sep16:49 MI-mo20Sep18:28 MI-mo20Sep18:29 MI-mo21Sep05:40 MI-mo21Sep05:42 -130 -120 -110 -100 -90 30 35 40 17 40 28 15 40 27 14 40 27 14 40 27 68 08 31 68 08 31 68 08 31 68 08 31 68 08 31 68 07 31 0.0 0.5 1.0 1.5 vmr [ppb] 10 15 20 25 30 35 40 -0.5 0.0 0.5 difference [ppb] 10 15 20 25 30 35 40 FImean_night MI20Sep16:47 MI20Sep16:49 MI20Sep18:28 MI20Sep18:29 MI21Sep05:40 MI21Sep05:42 FImean_night MI20Sep16:47 MI20Sep16:49 MI20Sep18:28 MI20Sep18:29 MI21Sep05:40 MI21Sep05:42 0.0 0.5 1.0 1.5 vmr [ppb] 10 15 20 25 30 35 40 -0.5 0.0 0.5 difference [ppb] 10 15 20 25 30 35 40 FImean_night MI-mo20Sep16:47 MI-mo20Sep16:49 MI-mo20Sep18:28 MI-mo20Sep18:29 MI-mo21Sep05:40 MI-mo21Sep05:42 FImean_night MI-mo20Sep16:47 MI-mo20Sep16:49 MI-mo20Sep18:28 MI-mo20Sep18:29 MI-mo21Sep05:40 MI-mo21Sep05:42
Fig. 8. Top left: location of FIRS2 daytime (red) and all MIPAS (other colours) limb scans for the balloon flight on 19/20 September 2003. Top right: location of FIRS2 nighttime (red) and all MIPAS (other colours) scans. Numbers indicate the positions of selected tangent points. Middle left column: Mean daytime altitude profiles of ClONO2 from FIRS2 (dotted, red, xrefin Eq. 6) and MIPAS (solid, other colours, xMIPAS). Middle right column: Same as the left column but for the nighttime mean FIRS2 profile. Bars indicate estimated total random errors. Bottom panels right part: Difference profiles xMIPAS− ˜xrefand combined errors for each MIPAS scan. The bottom panel shows the CTM transformed (see Eq. 7) MIPAS vmr profiles xtransMIPASin the left part (labelled MI-mo in the legend) and the related difference profiles xtransMIPAS− ˜xrefin the right part.
cidence with MIPAS on Envisat during three flights: on 28 February, 2 and 12 March (see Table 6).
The locations of MIPAS-STR and MIPAS observations are given in the top of Figs. 9–11 together with potential vorticity at the 400 K potential temperature level (≈16 km). Follow-ing the criterion by Nash et al. (1996), the vortex boundary at this level is about 14 pvu during the three days. Thus, on 28 February the Geophysica measurement corresponding to MIPAS scan 08:25 was inside, while 08:26 was at the
in-Table 6. Details for profile intercomparison during MIPAS-STR campaigns on 28 February, 2 March, and 12 March 2003.
MIPAS-STR MIPAS
Date/time lat/lon date/time lat/lon 1t 1d[km] 1PV
UTC @16 km UTC @16 km [h] @16 km @400 K 28FEB/07:56 69.7/22.8 28FEB/08:26 69.6/28.3 0.5 212 1 28FEB/08:59 75.3/28.7 28FEB/08:25 74.9/30.9 –0.6 79 0 02MAR/19:20 66.6/23.7 02MAR/20:35 66.6/22.7 1.2 42 0 02MAR/20:30 61.8/24.7 02MAR/20:34 61.9/23.7 0.1 52 0 02MAR/22:08 70.9/26.8 02MAR/20:37 71.5/22.8 –1.5 157 –1 12MAR/07:59 69.6/18.6 12MAR/08:49 69.6/22.5 0.8 151 –1 12MAR/08:55 75.2/21.2 12MAR/08:48 74.9/25.1 –0.1 114 0 12MAR/09:17 78.3/17.7 12MAR/08:46 79.6/22.8 –0.5 179 0 12MAR/09:56 75.1/4.3 12MAR/10:28 74.9/-0.0 0.5 126 –2 10 20 30 40 65 70 75 80 MIPAS-STR: 28 Feb 2003 12.0 13.0 14.0 15.0 16.0 16.0 16 1411 67 05 29 MIPAS-STR: 28 Feb 2003 17 07 12 67 05 29 0.0 0.5 1.0 1.5 2.0 vmr [ppb] 10 15 20 25 30 35 40 Altitude [km] -0.5 0.0 0.5 difference [ppb] 10 15 20 25 30 35 40 MS28Feb07:56 MI28Feb08:26 MS28Feb07:56 MI28Feb08:26 0.0 0.5 1.0 1.5 2.0 vmr [ppb] 10 15 20 25 30 35 40 -0.5 0.0 0.5 difference [ppb] 10 15 20 25 30 35 40 MS28Feb08:59 MI28Feb08:25 MS28Feb08:59 MI28Feb08:25
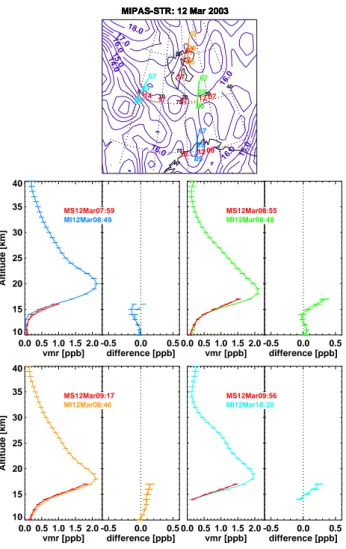
Fig. 9. Top: location of MIPAS-STR (red) and coincident MIPAS (other colours) limb scans during the Geophysica Envisat valida-tion campaign on 28 February 2003. Below: MIPAS-STR ClONO2 profiles retrieved with standard (red solid) and with MIPAS results (red dashed) as a-priori profiles in comparison with ClONO2from MIPAS.
ner vortex boundary at 400 K. On 2 March the two southern scans 20:34 and 20:35 were outside, while 20:37 was at the boundary and on 12 March all observations have been inside the polar vortex.
Since a major error source in the MIPAS-STR data analy-sis is the assumption on the a-priori profile above the aircraft flight level, we show the comparison with MIPAS in Figs. 9– 11 for the retrieval with a standard a-priori profile (solid
10 20 30 40 55 60 65 70 75 MIPAS-STR: 02 Mar 2003 10.0 10.0 11.0 11.0 12.0 12.0 12.0 13.014.015.016.0 17.018.0 171614 67 05 29 MIPAS-STR: 02 Mar 2003 16 1214 67 05 29 MIPAS-STR: 02 Mar 2003 181614 67 05 29 0.0 0.5 1.0 1.5 2.0 vmr [ppb] 10 15 20 25 30 35 40 Altitude [km] -0.5 0.0 0.5 difference [ppb] 10 15 20 25 30 35 40 MS02Mar20:30 MI02Mar20:34 MS02Mar20:30 MI02Mar20:34 0.0 0.5 1.0 1.5 2.0 vmr [ppb] 10 15 20 25 30 35 40 -0.5 0.0 0.5 difference [ppb] 10 15 20 25 30 35 40 MS02Mar19:20 MI02Mar20:35 MS02Mar19:20 MI02Mar20:35 0.0 0.5 1.0 1.5 2.0 vmr [ppb] 10 15 20 25 30 35 40 Altitude [km] -0.5 0.0 0.5 difference [ppb] 10 15 20 25 30 35 40 MS02Mar22:08 MI02Mar20:37 MS02Mar22:08 MI02Mar20:37
Fig. 10. Same as in Fig. 9 but for 2 March 2003.
lines) and also with the coincident MIPAS ClONO2profile
0 10 20 30 40 70 75 80 MIPAS-STR: 12 Mar 2003 14.015.0 15.0 16.0 16.0 16.0 16.0 17.018.0 16 1208 67 05 29 MIPAS-STR: 12 Mar 2003 17 1207 67 05 29 MIPAS-STR: 12 Mar 2003 17 07 12 67 05 29 MIPAS-STR: 12 Mar 2003 17 1114 67 05 29 0.0 0.5 1.0 1.5 2.0 vmr [ppb] 10 15 20 25 30 35 40 Altitude [km] -0.5 0.0 0.5 difference [ppb] 10 15 20 25 30 35 40 MS12Mar07:59 MI12Mar08:49 MS12Mar07:59 MI12Mar08:49 0.0 0.5 1.0 1.5 2.0 vmr [ppb] 10 15 20 25 30 35 40 -0.5 0.0 0.5 difference [ppb] 10 15 20 25 30 35 40 MS12Mar08:55 MI12Mar08:48 MS12Mar08:55 MI12Mar08:48 0.0 0.5 1.0 1.5 2.0 vmr [ppb] 10 15 20 25 30 35 40 Altitude [km] -0.5 0.0 0.5 difference [ppb] 10 15 20 25 30 35 40 MS12Mar09:17 MI12Mar08:46 MS12Mar09:17 MI12Mar08:46 0.0 0.5 1.0 1.5 2.0 vmr [ppb] 10 15 20 25 30 35 40 -0.5 0.0 0.5 difference [ppb] 10 15 20 25 30 35 40 MS12Mar09:56 MI12Mar10:28 MS12Mar09:56 MI12Mar10:28
Fig. 11. Same as in Fig. 9 but for 12 March 2003.
leads to a large improvement of the comparison in 4 cases (28 Feb 08:26, 02 Mar 20:34, 02 Mar 20:35, 12 Mar 08:49), a degradation in one case (28 Feb 08:25) and no clear change in the other four observations.
3.5 Summary of balloon and airborne profile comparisons In this section we analyse for each instrument the previously described set of comparisons. For that purpose, mean ence profiles ¯δ have been determined from K single differ-ence profiles:1 ¯δ = 1 K K X k=1 δk, (8)
1Mind that all variables here are vectors with as many elements as altitude grid points and that the expressions are given per altitude grid point. Thus, K in general is also altitude dependent. Introduc-tion of a further index indicating the altitude dependence is omitted for clarity.
where δk=xMIPAS,k− ˜xref,k in case of exactly matching
ob-servations and δk=xtransMIPAS,k− ˜xref,kin case the CTM model
correction has been applied. ¯δ for each instrument is given as solid black curves in the first column of Fig. 12.
For diagnostics, we have calculated the altitude dependent 95% confidence interval of these mean values by
±2σδ,std¯ = ± v u u t 1 K(K − 1) K X k=1 (δk− ¯δ)2 tcdf−1(0.975, K − 1) (9) where tcdf−1(0.975, K−1) is the inverse of the cumulative
Stu-dent’s t -distribution function for K−1 degrees of freedom at a value of 97.5% probability.
We have called this interval ±2σδ,std¯ since for large sam-ple sizes its limit is ±2 times the standard deviation of the sample divided by the square root of the number of sample elements. The results are shown as dotted black curves in first column of Fig. 12. Green dotted curves in Fig. 12 indi-cate the range of the estimated total random error of the mean differences (±2σδ,err¯ ) calculated from the combined error es-timation of the single difference profiles σ¯δ,err,k which have already been shown in the discussion of the single profile comparison: σδ,err¯ = 1 K v u u t K X k=1 σ2err,k. (10)
Here also the 95% interval is given. In the following we call a bias significant when it is outside these 95% confidence intervals.
For determination of an altitude dependent bias we com-pare the mean differences to ±2σδ,std¯ and ±2σδ,err¯ . The mean differences between MIPAS and the two instruments MIPAS-B and Mark IV are consistent up to about 32 km alti-tude: at 15 km MIPAS overestimates ClONO2vmrs by 0.02–
0.03 ppb (up to 100%) and at 20 km by about 0.04–0.05 ppb (up to 15%). From 25 to 32 km there is a slight underesti-mation of about 0.03 pb (3–4%) for MIPAS-B and a larger one (0.08 ppb, up to 10%) in case of Mark IV. Above, there is a tendency for an overestimation in case of MIPAS-B, but still a clear underestimation (up to 0.1 ppb or 25%) compared to Mark IV. For the MIPAS-B comparisons differences are, however, all within the ±2σδ,std¯ interval and, thus, statisti-cally not significant while compared to the estimated errors
±2σδ,err¯ the positive MIPAS bias at 15 and 20 km might be real. In case of Mark IV the deviation at high altitudes is clearly significant and the 15 and 20 km differences are just at the limits of the confidence intervals.
Large biases exist in case of the MIPAS-FIRS comparison: from 15–22 km an overestimation of MIPAS up to 0.25 ppb and an underestimation of up to 0.3 ppb in the altitude region 25–31 km. The deviations around 20 km are significant with respect to ±2σδ,std¯ and ±2σδ,err¯ while at higher altitudes it is
MIPAS-B
-0.4 -0.2 0.0 0.2 0.4 MIPAS - MIPAS-B [ppbv] 10 15 20 25 30 35 40 Altitude [km] 0.0 0.5 1.0 vmr [ppb] 10 15 20 25 30 35 40 MIPAS-B MIPAS -30 -20 -10 0 10 20 30 (MIPAS - MIPAS-B)/MIPAS-B [%] 10 15 20 25 30 35 40 0 2 4 6 8 10 chi^2 10 15 20 25 30 35 40Mark IV
-0.4 -0.2 0.0 0.2 0.4 MIPAS - MarkIV [ppbv] 10 15 20 25 30 35 40 Altitude [km] 0.0 0.5 1.0 vmr [ppbv] 10 15 20 25 30 35 40 Mark IV MIPAS -30 -20 -10 0 10 20 30 (MIPAS - MarkIV)/MarkIV [%] 10 15 20 25 30 35 40 0 2 4 6 8 10 chi^2 10 15 20 25 30 35 40FIRS
-0.4 -0.2 0.0 0.2 0.4 MIPAS - FIRS [ppbv] 10 15 20 25 30 35 40 Altitude [km] 0.0 0.5 1.0 vmr [ppbv] 10 15 20 25 30 35 40 FIRS MIPAS -30 -20 -10 0 10 20 30 (MIPAS - FIRS)/FIRS [%] 10 15 20 25 30 35 40 0 2 4 6 8 10 chi^2 10 15 20 25 30 35 40MIPAS-STR
-0.4 -0.2 0.0 0.2 0.4 MIPAS - MIPAS-STR [ppbv] 10 15 20 25 30 35 40 Altitude [km] 0.0 0.5 1.0 vmr [ppbv] 10 15 20 25 30 35 40 MIPAS-STR MIPAS -30 -20 -10 0 10 20 30 (MIPAS - MIPAS-STR)/MIPAS-STR [%] 10 15 20 25 30 35 40 0 2 4 6 8 10 chi^2 10 15 20 25 30 35 40Fig. 12. Summary of MIPAS-B, Mark IV, FIRS and MIPAS-STR comparisons with MIPAS. First column: mean difference profiles ¯δ (black solid), 95% confidence interval (±2σδ,std¯ ) (black dotted), and estimated total errors ±2σδ,err¯ (green dotted) of the mean difference profiles.
Second column: mean profiles. Third column: relative difference profiles. Fourth column: χ2profile (black solid) and 95% confidence interval for χ2(black dotted).
Table 7. NDACC stations used for comparisons with MIPAS.
Station Latitude Longitude Altitude [km]
Spitsbergen 78.92◦N 11.93◦E 0.02 Thule 76.53◦N 68.74◦W 0.03 Kiruna 67.84◦N 20.41◦E 0.42 Harestua 60.21◦N 10.75◦E 0.60 Jungfraujoch 46.55◦N 7.98◦E 3.58 Iza˜na 28.3◦N 16.48◦W 2.37 Wollongong 34.4◦S 150.9◦E 0.03 Lauder 45.04◦S 169.68◦E 0.37
within the ±2σδ,std¯ interval. We attribute these differences to the FIRS data (1) since these show negative vmrs in the order of 0.2 ppb around 20 km, (2) since during the same measure-ment campaign in September 2003 the agreemeasure-ment between MIPAS ClONO2profiles from the same limb scans and the
Mark IV observation is much better (see Sect. 3.2.3), and (3) since there is no indication from any other instrument that these deviations might be due to erroneous MIPAS data.
For the comparison with MIPAS-STR we have chosen those MIPAS-STR retrievals where MIPAS results have been used as a-priori since this seems to reduce the error due to unknown profile shape above the airplane (see Sect. 3.4.1). Results are shown in the bottom row of Fig. 12. Largest dif-ferences of about 0.15 ppbv are found at 17 km altitude which are, however, not significant in terms of ±2σδ,std¯ . The differ-ences are in absolute units larger than in case of the compari-son with MIPAS-B or Mark IV. However, in relative units the maximum positive bias is only 13% due to the large values of ClONO2 encountered in the lowermost stratosphere
dur-ing the MIPAS-STR validation campaign in February/March 2003.
To evaluate the given estimated precision of the measure-ments without depending on error covariances in the altitude domain, we have calculated χ2values of the differences in-dividually per altitude (von Clarmann, 2006):
χ2= K X k=1 (δk− ¯δ)2 σerr,k2 . (11)
This is compared to the 95% confidence interval of the χ2 distribution function in the last column of Fig. 12. In this figure all χ2 values have been divided by K−1. In case of MIPAS-B the combined error seems to be underestimated from 16 to 24 km while at higher and lower altitudes it is within the 95% confidence interval. The combined Mark IV-MIPAS error estimation is, with an exception at around 15 km, always at the lower edge of the confidence interval, thus, indicating a slight overestimation of the combined er-rors. For the comparison with FIRS there is an overestima-tion of the precision above 32 km and below 15 km while in a large region around 25 km errors seem underestimated.
Fi-nally in case of MIPAS-STR the combined random errors are underestimated at 16–17 km altitude while below actual χ2 values lie inside the 95% confidence interval.
4 Comparison with ground-based measurements:
FTIR
We have compared MIPAS ClONO2 observations with
ground-based solar absorption FTIR measurements from var-ious stations operating within the Network for the Detec-tion of Atmospheric ComposiDetec-tion Change (NDACC, for-merly Network for the Detection of Stratospheric Change, NDSC) (see Table 7). From these instruments total column amounts of ClONO2 are available. These data have been
derived on the basis of different forward models/inversion schemes (Rinsland et al., 2003; Mellqvist et al., 2002). In the case of Thule observations, the retrieval code SFIT2 (Rins-land et al., 2003) and a two-microwindow approach similar to Reisinger et al. (1995) has been applied. For Iza˜na mea-surements PROFFIT (Hase et al., 2004) has been used. In contrast to the scheme described in Rinsland et al. (2003), for Kiruna the approach by Reisinger et al. (1995) has been adopted for the data shown in the present work. Common to the MIPAS data analysis, all FTIR retrievals are performed in the region of the ν4 Q-branch at 780.2 cm−1, using the
spectroscopic data from Wagner and Birk (2003).
For the comparison we have calculated ClONO2column
amounts from the MIPAS profiles using the pressures and temperatures which have been derived from the same spec-tra in a previous step of the retrieval chain (von Clarmann et al., 2003). These abundances are determined within the available altitude range of MIPAS, i.e. with a maximum cov-erage of 6–70 km. In the presence of clouds the lower limit is the cloud top derived from MIPAS. Thus, a part of the tro-pospheric ClONO2column is missing in the MIPAS derived
data but present in the FTIR total columns. In standard pro-files of ClONO2the tropospheric column (0–12 km) is about
1–3% of the total column. Further, some of the FTIR sta-tions used in this intercomparison also derived tropospheric column amount of ClONO2. Mean tropospheric values from
these stations lie in the range 0.3%(Wollongong)–2%(Thule) of the total column amount.
The comparisons cover most of the time period of the MI-PAS operation discussed in this paper and range from 78.9◦N to 45◦S (see Fig. 13). The collocated scans of MIPAS with the FTIR measurements have been selected on the basis of a maximum distance 1dmax, time 1tmax, and potential
vortic-ity (PV) 1pvmaxcriterion. These criteria have been applied
to the locations where the line-of-sight of the FTIRs inter-sected the altitude of 20 km or the 475 K potential tempera-ture level in case of the PV-criterion, respectively.
Figure 13 shows the comparison of daily mean values for 1dmax=800 km, 1tmax=8 h, and
01-Jan-2003 01-Jan-2004 0 1 2 3 MIPAS FTIR Spitsbergen 78.9o N/11.9o E 01-Jan-2003 01-Jan-2004 0 1 2 3 Thule 76.5oN/68.7oW 01-Jan-2003 01-Jan-2004 0 1 2 3 Kiruna 67.8oN/20.4oE 01-Jan-2003 01-Jan-2004 0 1 2 3 ClONO 2 (10 15 cm -2) Harestua 60.2o N/10.8o E 01-Jan-2003 01-Jan-2004 0 1 2 3 Jungfraujoch 46.6o N/8.0o E 01-Jan-2003 01-Jan-2004 0 1 2 3 Izana 28.3o N/16.5o W 01-Jan-2003 01-Jan-2004 0 1 2 3 Wollongong 34.4o S/150.9o E 01-Jan-2003 01-Jan-2004 0 1 2 3 Lauder 45.0oS/169.7oE
Fig. 13. Comparison between MIPAS (red) and FTIR (green) daily mean column amounts versus time for the collocation criterion
1dmax=800 km, 1tmax=8 h, and 1pvmax=3×10⁻⁶Km2kg−1s−1at 475 K.
the annual variation of ClONO2column amounts with large
amplitudes at high-latitude stations (Spitsbergen, Thule, Kiruna, Harestua) in spring. These are due to the chlorine deactivation in stratospheric vortex airmasses, which is even visible at mid-latitudes (Jungfraujoch) on distinct days when vortex air extended far south. Also the annual variation
at stations which are rarely affected by vortex air, like Jungfraujoch, Iza˜na or Lauder, is well met.
For a more detailed investigation, Fig. 14 shows scatter plots for each station and Fig. 15 the his-togram of the differences between MIPAS and FTIR. In these Figures black symbols/bars denote
Spitsbergen 0 1 2 3 4 FTIR (1015 cm-2 ) 0 1 2 3 4 MIPAS (10 15 cm -2) Thule 0 1 2 3 4 FTIR (1015 cm-2 ) 0 1 2 3 4 MIPAS (10 15 cm -2) Kiruna 0 1 2 3 4 FTIR (1015 cm-2 ) 0 1 2 3 4 MIPAS (10 15 cm -2) Harestua 0 1 2 3 4 FTIR (1015 cm-2 ) 0 1 2 3 4 MIPAS (10 15 cm -2) Jungfraujoch 0 1 2 3 4 FTIR (1015 cm-2 ) 0 1 2 3 4 MIPAS (10 15 cm -2) Izana 0 1 2 3 4 FTIR (1015 cm-2 ) 0 1 2 3 4 MIPAS (10 15 cm -2) Wollongong 0 1 2 3 4 FTIR (1015 cm-2 ) 0 1 2 3 4 MIPAS (10 15 cm -2) Lauder 0 1 2 3 4 FTIR (1015 cm-2 ) 0 1 2 3 4 MIPAS (10 15 cm -2)
Fig. 14. Scatterplots between MIPAS and FTIR daily mean column amounts for the collocation criterion 1dmax=800 km, 1tmax=8 h, and
1pvmax=3×10⁻⁶Km2kg−1s−1at 475 K (black stars) and 1dmax=400 km, 1tmax=4 h, and 1pvmax=3×10⁻⁶Km2kg−1s−1at 475 K
(red crosses).
the selection for 1dmax=800 km, 1tmax=8 h, and
1pvmax=3×10⁻⁶Km2kg−1s−1 and red symbols/bars the
more stringent selection with 1dmax=400 km, 1tmax=4 h,
and 1pvmax=3×10⁻⁶Km2kg−1s−1. Additionally in
Table 8 and Table 9 some statistical quantities are listed for the two match cases.
In the following we first analyse the data for any signifi-cant bias by comparing the mean difference with their stan-dard deviations. Then estimated errors are discussed with re-spect to the mean differences and with rere-spect to the derived precision via a χ2test.
-10 -5 0 5 10 0.0 0.5 1.0 1.5 2.0 Spitsbergen 78.9oN/11.9oE Spitsbergen 78.9oN/11.9oE -10 -5 0 5 10 0 1 2 3 4 5 Thule 76.5o N/68.7o W Thule 76.5o N/68.7o W -10 -5 0 5 10 0 2 4 6 8 10 12 Kiruna 67.8oN/20.4oE Kiruna 67.8oN/20.4oE -10 -5 0 5 10 0 2 4 6 8 Number of counts Harestua 60.2o N/10.8o E Harestua 60.2o N/10.8o E -10 -5 0 5 10 0 2 4 6 8 Jungfraujoch 46.6Jungfraujoch 46.6ooN/8.0N/8.0ooEE -10 -5 0 5 10 0 2 4 6 8 10 Izana 28.3o N/16.5o W Izana 28.3o N/16.5o W -10 -5 0 5 10 0 1 2 3 4 Wollongong 34.4Wollongong 34.4ooS/150.9S/150.9ooEE -10 -5 0 5 10 MIPAS-FTIR (1014 cm-2 ) 0 2 4 6 8 10 12 Lauder 45.0o S/169.7o E Lauder 45.0o S/169.7o E
Fig. 15. Histograms of the column amounts daily differences for the collocation criterion 1dmax=800 km, 1tmax=8 h, and 1pvmax=3 × 10⁻⁶Km2kg−1s−1at 475 K (black solid) and 1dmax=400 km, 1tmax=4 h, and 1pvmax=3×10⁻⁶Km2kg−1s−1at 475 K (red dotted).
To decide whether the mean difference δ between MI-PAS and FTIR at each station is significant and, thus, might indicate some systematic error, we compare it to the 68% significance interval of the mean difference ±σ¯δ,std from the measurements in Tables 8 and 9. For 1dmax=800 km,
1tmax=8 h, and 1pvmax=3×10⁻⁶Km2kg−1s−1 one
sta-tion is within 1σ¯δ,std (Spitsbergen: −0.37σ¯δ,std), two are within or near 1–2σ¯δ,std (Jungfraujoch: 1.75σ¯δ,std, Wollon-gong: −2.08σδ,std¯ ), four within or near 2–3σ¯δ,std (Lauder: