Low-load blood flow restriction training induces similar morphological and
mechanical Achilles tendon adaptations compared with high-load resistance
training
XChristoph Centner,1 Benedikt Lauber,1,2 Olivier R. Seynnes,3 Simon Jerger,1 Tim Sohnius,1 Albert Gollhofer,1and Daniel König1
1Department of Sport and Sport Science, University of Freiburg, Freiburg, Germany; 2Department of Neurosciences and
Movement Sciences, Université de Fribourg, Fribourg, Switzerland; and 3Department of Physical Performance, Norwegian
School of Sport Sciences, Oslo, Norway
Centner C, Lauber B, Seynnes OR, Jerger S, Sohnius T, Gollhofer A, König D. Low-load blood flow restriction training induces similar morphological and mechanical Achilles tendon adaptations compared with high-load resistance training. J Appl Physiol 127: 1660 –1667, 2019. First published November 14, 2019; doi:10.1152/japplphysiol.00602. 2019.—Low-load blood flow restriction (LL-BFR) training has gained increasing interest in the scientific community by demonstrating that increases in muscle mass and strength are comparable to conventional high-load (HL) resistance training. Although adaptations on the mus-cular level are well documented, there is little evidence on how LL-BFR training affects human myotendinous properties. Therefore, the aim of the present study was to investigate morphological and mechanical Achilles tendon adaptations after 14 wk of strength training. Fifty-five male volunteers (27.9⫾ 5.1 yr) were randomly allocated into the following three groups: LL-BFR [20 –35% of one-repetition maximum (1RM)], HL (70 – 85% 1RM), or a nonexer-cising control (CON) group. The LL-BFR and HL groups completed a resistance training program for 14 wk, and tendon morphology, mechanical as well as material properties, and muscle cross-sectional area (CSA) and isometric strength were assessed before and after the intervention. Both HL (⫹40.7%) and LL-BFR (⫹36.1%) training induced significant increases in tendon stiffness (P⬍ 0.05) as well as tendon CSA (HL: ⫹4.6%, LL-BFR: ⫹7.8%, P ⬍ 0.001). These changes were comparable between groups without significant changes in Young’s modulus. Furthermore, gastrocnemius medialis muscle CSA and plantar flexor strength significantly increased in both train-ing groups (P ⬍ 0.05), whereas the CON group did not show significant changes in any of the evaluated parameters. In conclusion, the adaptive change in Achilles tendon properties following low-load resistance training with partial vascular occlusion appears comparable to that evoked by high-load resistance training.
NEW & NOTEWORTHY Low-load blood flow restriction (LL-BFR) training has been shown to induce beneficial adaptations at the muscular level. However, studies examining the effects on human tendon properties are rare. The findings provide first evidence that LL-BFR can increase Achilles tendon mechanical and morphological properties to a similar extent as conventional high-load resistance training. This is of particular importance for individuals who may not tolerate heavy training loads but still aim for improvements in myo-tendinous function.
blood flow restriction; muscle mass; muscular strength; tendon stiff-ness; Young’s modulus
INTRODUCTION
Although muscles are responsible for the generation of force, the transmission of these forces to the skeletal system is accom-plished by tendinous structures that connect the muscles with the bony structures (9). The interaction of the muscle-tendon unit complex with the skeletal system is therefore crucial for human locomotion and all other types of movements (11).
It is well known that both muscle and tendon tissues dem-onstrate a remarkable degree of plasticity with training (46). For promoting increases in muscle mass and strength, it has generally been recommended to apply training loads of 70 – 85% of each individual’s one-repetition maximum (1RM) (4). Furthermore, it was demonstrated that mechanical stress and strain (~4%) induced by resistance training can enhance mor-phological and functional properties of tendons (5, 58). Evi-dence from a recent meta-analysis (11) indicates that also in this context training loads⬎ 70% of the 1RM are superior in promoting optimal adaptive responses in mechanical (stiffness) and material (Young’s modulus) tendon properties compared with low-load (LL) training. With regard to the magnitude of these adaptations, significant increases of ~20 – 40% (33, 36, 52) in tendon stiffness as well as changes in tendon hypertro-phy of ~3–10% (13, 33, 52) were observed.
Interestingly, a compelling number of studies have revealed that the addition of partial vascular occlusion [i.e., blood flow restriction (BFR)] during LL resistance training (20 – 40% 1RM) induces substantial muscle growth (18, 25, 40, 47) and strength gains (37) comparable to adaptations seen with con-ventional high-load (HL) training (14, 39). However, it is largely unknown to what extent training with BFR facilitates changes in human tendon properties. Although one study was conducted to investigate the effects of LL-BFR training on patellar tendon properties (35), the interpretation of the results is difficult because of unstandardized load progressions be-tween groups.
Accordingly, the main purpose of the present study was to investigate the effects of LL-BFR training (20 –35% 1RM) on in vivo tendon properties and compare these effects with
Address for reprint requests and other correspondence: C. Centner, Schwar-zwaldstraße 175, 79117 Freiburg, Germany (e-mail: christoph.centner@sport. uni-freiburg.de).
http://doc.rero.ch
Published in "Journal of Applied Physiology 127(6): 1660–1667, 2019"
which should be cited to refer to this work.
conventional HL (70 – 85% 1RM) resistance training. On the basis of the findings of previous studies (5, 11), we hypothe-sized that the stress and strain (being ~1/3 of conventional HL resistance exercise) during LL-BFR would not be sufficient to elicit adaptations in mechanical, morphological, as well as material properties of the Achilles tendon. Given that LL-BFR training is frequently applied in clinical rehabilitation (28, 45), it is necessary to investigate tendon adaptive responses to this regimen since adaptations at the muscular level without con-comitant changes of tendon properties might lead to increased risks of myotendinous injuries (44).
METHODS
Subjects
Based on the findings of a recent study investigating the chronic effects of resistance training on Achilles tendon stiffness (56), an a priori power analysis (G*Power 3.1.9.2) was conducted. The results indicated that a total of n⫽ 36 participants were needed to identify the observed effect sizes as statistically significant (f⫽ 0.28, power ⫽ 0.8, ␣ ⫽ 0.05). Considering a potential dropout rate of 20–25%, a total of 55 healthy men between the age of 18 and 40 yr were recruited. All subjects were untrained (according to the Freiburg Questionnaire of Physical Activity) and had a maximum of 1–2 h of physical activity per week. Participants diagnosed with acute or chronic injuries of the Achilles tendon, uncontrolled hypertension, or any other chronic disease were excluded from the trial. Moreover, smokers and subjects with a history of deep vein thrombosis or a body mass index exceed-ing 30 kg/m2were not included.
Approval of the study was obtained from the local ethics commit-tee, and all procedures were in accordance with the latest revision of the Declaration of Helsinki. The trial was registered at the German Clinical Trials Register (DRKS00018884). Before commencing the trial, all subjects gave written informed consent.
Study Design
A between-group repeated-measures design was implemented to as-sess tendon properties, muscle cross-sectional area (CSA), and muscular strength in young men before and after 14 wk of either LL-BFR or HL. One week before the intervention, subjects underwent a prelimi-nary screening, which comprised a medical anamnesis and physical examination to confirm agreement with the abovementioned inclusion criteria. If subjects were eligible, they were randomly allocated (without identification to assessors) into one of the following exper-imental groups: HL resistance training (70 – 85% 1RM), LL (20 –35% 1RM) resistance training with BFR (LL-BFR), and a control (CON) group without any training. A random number generator was used for allocation sequence generation. Subsequently, muscle CSA of the gastrocnemius medialis muscle was assessed. Additionally, Achilles tendon properties and unilateral maximal plantar flexion torque were determined. All testing was conducted at the Department of Sport and Sport Science at the University of Freiburg before and after the 14-wk intervention period. A total training duration of⬎12 wk has previ-ously been suggested to efficiently induce tendon adaptive responses (11). All measurements and training procedures were supervised and completed at the Department of Sport and Sport Science of the University of Freiburg, and all outcome assessors were blinded to participants’ group assignments.
Training Procedures
The training consisted of three weekly sessions for 14 wk. Training days were separated by at least 1-day rest between two consecutive sessions to ensure adequate recovery. Each training session was preceded by a 10-min standardized warm-up on a stationary cycle ergometer at ~50 W.
High-load training. The HL protocol consisted of three sets of
6 –12 repetitions of dynamic standing (Multipress Genius Eco; FREI, Kirchzarten, Germany) and sitting (Body-Solid Seated Calf Raise Machine, GSCR349) calf raises with the load being progressively increased every 4 wk from 70% to 85% 1RM. On these occasions, dynamic 1RM testings were implemented to adjust the load for the current strength level of each individual. All exercises were performed in full range of motion (full plantar flexion to full dorsal extension) (34), with an interset rest period of 1 min. Three minutes of rest was provided between exercises.
Low-load blood flow restriction training. Participants in the
LL-BFR group performed the same exercises as the HL group but with a training load of 20% 1RM being progressively increased by 5% every 4 wk until 35% 1RM in the last 2 wk was reached. Similar to the HL group, dynamic strength testings were implemented to reevaluate the current strength level and adequately adjust the load. For each exer-cise, four sets with 30 repetitions in the first set and 15 repetitions in the remaining three sets were completed. This protocol was chosen because this has been frequently applied in the BFR literature (38, 54). During each exercise, a 12-cm-wide pneumatic nylon tourniquet (Zimmer Biomet, Warsaw, IN) was proximally positioned with a snug fit on each thigh. Before each training, arterial occlusion pressure (AOP) was determined in a standing position for each participant. The cuff was gradually increased until the arterial pulse at the posterior tibial artery was no longer detected by Doppler ultrasound (Handy-dop; Kranzbühler, Solingen, Germany). This point was defined as 100% of arterial occlusion. For training routines, cuff pressure was set to 50% (38, 54) of each individual’s AOP (A.T.S. 3000; Zimmer Biomet, Warsaw, IN) and kept inflated during the entire session including the 60-s interset rest periods. Between the two exercises, the cuff was deflated for 3 min.
To increase compliance with the training program, all participants were afforded a brief cooldown consisting of front and side planks as well as bridging exercises. All routines were supervised by specially trained sport scientists to ensure proper exercise technique.
One-Repetition Maximum Assessment
Dynamic 1RM testings for sitting and standing calf raises were conducted at the beginning and every 4 wk during the training intervention. Before commencing the assessment, participants com-pleted a specific warm-up of two sets with 10 repetitions with a submaximal load. Subsequently, two additional warm-up sets allow-ing three to five repetitions were performed (8). For the actual 1RM test, the correct technique implied lifting the weight in a full range of motion reaching from maximum dorsal extension to maximum plantar flexion. Additionally, no movement was allowed in the knee joint, which was fully extended (but not locked) during all trials. After each successful lift the load was increased by 5–10% until the participants failed to lift the weight through the full range of motion with a proper technique (8, 48). Each trial was separated by a 4-min resting period to ensure recovery. All final 1RMs were achieved within five at-tempts.
Maximum Voluntary Torque
Unilateral isometric maximum voluntary contraction (MVC) torque at 90° plantar flexion was measured with an isokinetic dynamometer (ISOMED 2000; Ferstl, Germany). Subjects were placed in supine position with restricted shoulders and hips. During the entire proce-dure knee and hips were fully extended. The highest MVC was used for data analysis.
Muscle Cross-Sectional Area
Panoramic ultrasound (US) images (Aplio 400; Toshiba, Tokyo, Japan) were taken with a 9-MHz transducer (6-mm width) by an experienced sonographer. Recent studies have repeatedly confirmed
panoramic US imaging to be a valid and reliable tool for monitoring changes in muscle mass (3, 51). For assessing muscle CSA of the right gastrocnemius medialis muscle, transversal images were acquired with participants lying in a ventral position with their legs hanging down from the table, being fully extended. To ensure a standardized 90° ankle position, a custom-build orthosis was placed at the ankle during the time of the measurements. After a resting period of 20 min in this exact position, which was implemented to account for fluid shifts (10), measurements were conducted at 30% of tibia length (from popliteal crease to lateral malleolus) (15, 31), with participants being instructed to relax their muscles as much as possible. During the entire assessment, a sufficient amount of transmission gel was applied in order to obviate pressure of the probe on the skin (51). To ensure that there was no compression of the muscle, each acquired image was manually checked for an identifiable layer of transmission gel be-tween the transducer and the skin.
Three images were obtained and subsequently transferred to a personal computer. Digitizing analysis software (ImageJ 1.51; NIH, Bethesda, MD) was used to manually trace the images and calculate muscle CSA. To get a stable mean, each image was evaluated three times and the mean of all three images was used for calculations. This technique has recently been identified as highly reliable with a coefficient of variation (CV) of 2.4 – 4.1% (51).
Achilles Tendon Properties
Tendon cross-sectional area. Achilles tendon CSA was determined
by acquiring time series of several transversal US images (8 MHz, ArtUs EXT-1H; Telemed, Vilnius, Lithuania) at 25% of Achilles tendon length measured from tuberositas calcanei to the most distal aspect of the gastrocnemius muscle (7). Images were transferred to a personal computer and analyzed with ImageJ (1.51; NIH), and the average of three images was used for further calculations. To assess CV of repeated measurements, the same assessment was repeated after a 72-h time period in a group of 10 subjects. The respective CV was 4.8% and thus in an acceptable range (58).
Tendon mechanical and material properties. To assess tendon
stiff-ness, elongation of the Achilles tendon was determined during ramped isometric contractions by B-mode US scans at 100 Hz at the gastroc-nemius medialis myotendinous junction. Additionally, plantar flexion torque recordings (1,000 Hz) and two-dimensional (2D) kinematic data (100 Hz) were simultaneously sampled. A hypoechoic marker was placed at the myotendinous junction and kept in line with a marker at the US transducer to correct for potential probe movements. To optimize US image quality during the ramped isometric protocol, a gel pad was positioned between the skin and the transducer. Changes in ankle angle were tracked with 2D motion analysis cameras (Simi Motion, Munich, Germany) with three LED markers placed at the tibia, malleolus medialis, and first metatarsal bone of the right leg.
After familiarization with the procedure and preconditioning of the tendon with five trials at 80% of MVC (41), participants were instructed to steadily exert torque to their individual maximum with a standardized loading rate of 50 Nm/s. This loading rate was chosen because it resulted in a ramped isometric plantar-flexion contraction lasting between 3 and 5 s for all subjects (7, 56). During this process, visual online feedback of the torque signal was provided. Achilles tendon force was calculated by dividing plantar flexion torque by the tendon moment arm with a subsequent correction for ankle joint rotation by kinematic data.
Tendon moment arm was calculated by measuring the perpendic-ular distance from the inferior tip of both medial (L1) and lateral (L2) malleolus (center of rotation) to the posterior part of the Achilles tendon (32, 50). For this purpose pictures were taken from the medial and lateral sagittal planes (Sony Cyber-shot DSC-RX100 Digital Camera). In accordance with previous studies, the mean of these two measurements (L1,2) was used for further calculations (32, 50).
Sub-sequently, the intersection of L1 and L2 was indicated with a needle
and the perpendicular distance (M) from the needle to the tendon’s line of action was measured (32). Tendon moment arm was then determined by subtracting M from L1,2(for detailed descriptions see
Refs. 32 and 50). All analyses were conducted with ImageJ (1.51; NIH).
All acquired position and displacement data were filtered with a second-order low-pass Butterworth filter with a cutoff frequency of 15 Hz. Subsequently, Achilles tendon elongation was analyzed off-line with semiautomatic tracker software (Tracker, V 4.95) by tracking the closest visible fascicle insertion at the myotendinous junction of the gastrocnemius (56). Tendon stiffness was then calculated as the slope of the force-elongation curve between 50% and 80% MVC. This procedure has previously been used in the scientific literature (56). Young’s modulus was calculated as the slope of the stress-strain curve between 50% and 80% MVC.
Lifestyle Parameters
To control nutritional behavior as a potential confounding variable, participants were advised to maintain their nutritional regimen during the study. Additionally, macronutrient status was tracked with Nutri-guide 4.6 software (Nutri Science, Hausach, Germany). Subjects were instructed to record their food intake as precisely as possible during 3 days of the week (2 weekdays and 1 weekend day) before and after the intervention.
Furthermore, the level of self-reported physical activity was eval-uated with the Freiburg Questionnaire of Physical Activity at the beginning and the end of the intervention period (26).
Statistics
Normal distribution and homogeneity of variances were checked for all variables. To detect changes over time and respective differ-ences between the groups, a repeated-measures ANOVA (rmANOVA) with factors time (pre, post)⫻ group (LL-BFR, HL, CON) was performed to test for interaction effects. Furthermore, within-group differences were evaluated with a paired Student’s t test. In the case of significant interaction effects from the rmANOVA, Bonferroni-corrected Student’s t tests were calculated to test for within- and between group differences. In addition, we performed an intention-to-treat (ITT) analysis for all n⫽ 55 participants by using a multiple imputation approach (22). Outliers in main outcome criteria were excluded from the analysis if their values exceeded the mean⫾ 3 standard deviations (SDs).
All statistical analyses were done with SPSS 24.0 (IBM, Armonk, NY). Data are presented as means⫾ SD if not otherwise indicated. The level of significance was set to P⬍ 0.05 for all tests.
RESULTS
A total of 38 participants (HL: n ⫽ 14, LL-BFR: n ⫽ 11; CON: n⫽ 13) successfully completed the study, with n ⫽ 6 dropouts in the HL group, n ⫽ 9 dropouts in the LL-BFR group, and n ⫽ 2 dropouts in the CON group. None of the dropouts was related to side effects of the training (see Fig. 1). Baseline characteristics of the participants are presented in Table 1. At the pretest, there was no significant difference between the groups either in anthropometric variables or in any of the main outcome variables (P⬎ 0.05).
Achilles Tendon CSA
The results of the rmANOVA showed significant time (F1,35⫽ 16.06, P ⬍ 0.01, p2⫽ 0.315) and interaction (F2,35⫽
4.42, P ⬍ 0.05, p2⫽ 0.202) effects, with greater changes in CSA in the HL and LL-BFR groups compared with CON. Achilles tendon CSA at 25% of tendon length increased from
70.3⫾ 17.7 mm2 to 73.5⫾ 17.2 mm2 (⫹4.6%) in the HL
group (P⬍ 0.01) and from 68.2 ⫾ 11.4 mm2to 73.5⫾ 14.4
mm2(⫹7.8%) in the LL-BFR group (P ⬍ 0.05). Tendon CSA
of the CON group did not change (P ⫽ 0.962; 68.8 ⫾ 14.7 mm2to 68.9⫾ 15.5 mm2; Fig. 2). After calculation of an ITT
analysis, similar results were found, with a significantly higher increase in tendon CSA in both training groups compared with CON (time⫻ group interaction: P ⬍ 0.05, p2⫽ 0.157).
Achilles Tendon Properties
Evaluation of changes in tendon stiffness revealed signifi-cant time (F1,33⫽ 19.32, P ⬍ 0.01, p2⫽ 0.369) and
interac-tion (F2,33⫽ 3.52, P ⬍ 0.05, p2⫽ 0.176) effects. After the
14-wk training program, both HL and LL-BFR groups in-creased their Achilles tendon stiffness from 401.5⫾ 102.6 N/mm to 564.8⫾ 157.6 N/mm (⫹40.7%) (P ⬍ 0.05) and from 388.7⫾ 76.9 N/mm to 529.2 ⫾ 142.8 N/mm (⫹36.1%) (P ⬍ 0.05), respectively (Fig. 3). No significant changes were ob-served in the CON group (pre: 442.6⫾ 96.3 N/mm; post: 458.6⫾ 86.5 N/mm). The ITT analysis demonstrated a signif-icant main effect of time (P⬍ 0.01, p2⫽ 0.339) and a significant
time⫻ group interaction (P ⬍ 0.01, p2⫽ 0.213). In contrast to the mechanical properties, material properties (assessed with the Young’s modulus) remained unchanged, with no signifi-cant time effect (F1,32⫽ 0.874, P ⫽ 0.357, p2⫽ 0.027) or
interaction effect (F2,32⫽ 1.46, P ⫽ 0.248, p2⫽ 0.083). After
14 wk, Young’s modulus changed from 1,539.5⫾ 491.6 MPa to 1,847.6⫾ 481.4 MPa and from 1,638.5 ⫾ 696.9 MPa to 1,495.1⫾ 425.2 MPa in the HL and LL-BFR groups, respec-tively.
Assessed for eligibility (n = 61)
Excluded (n = 6)
Not meeting inclusion criteria (n = 4) Declined to participate (n = 0) Other reasons (n = 2)
Randomized (n = 55)
Allocated to intervention (HL) (n = 20) Allocated to intervention (LL-BFR) (n = 20) Received allocated intervention (n = 20)
Lost to follow-up (n = 6) Lost to follow-up (n = 9) Lost to follow-up (n = 2)
Analysed (n = 13)
No further exclusions from analysis unavailability (n = 1)
non-compliance with study protocol (n = 1) non-compliance with study protocol (n = 3) non-compliance with study protocol (n = 4)
personal reasons (n = 3)
personal reasons (n = 4) injury not related to the study (n = 1)
Analysed (n = 14) Analysed (n = 11)
No further exclusions from analysis
Analysis
Follow-Up
Allocation
Enrollment
No further exclusions from analysis Received allocated intervention (n = 20)
Allocated to intervention (CON) (n = 15) Received allocated intervention (n = 15)
Fig. 1. Flowchart of subject recruitment. CON, control; HL, high load; LL-BFR, low load with blood flow restriction.
Table 1. Descriptive and anthropometric characteristics
Variable HL (n⫽ 14) LL-BFR (n⫽ 11) CON (n⫽ 13) Age, yr 26.1⫾ 4.2 27.1⫾ 4.7 30.5⫾ 5.7 Height, cm 179.7⫾ 9.2 180.1⫾ 8.3 178.4⫾ 5.6 Weight, kg 76.4⫾ 15.4 85.0⫾ 9.3 77.9⫾ 10.7 BMI, kg/m2 23.5⫾ 3.5 26.3⫾ 3.5 24.5⫾ 3.1
Values are means⫾ SD for n subjects. BMI, body mass index; CON, control group; HL, high-load group; LL-BFR, low-load blood flow restriction group.
Fig. 2. Pre- and posttraining values of Achilles tendon cross-sectional area (CSA) in the high-load (HL), low-load blood flow restriction (LL-BFR), and nonexer-cising control (CON) groups. Data are means⫾ 95% confidence interval. Black dots represent individual data points. *Significantly different (P ⬍ 0.05) by repeated-measures ANOVA (time⫻ group interaction).
Muscle CSA
The rmANOVA revealed significant time (F1,34⫽ 30.55, P ⬍ 0.01, p2⫽ 0.473) and time ⫻ group (F2,34⫽ 7.19, P ⬍
0.01,p2⫽ 0.297) effects, with the HL (P ⬍ 0.01) and LL-BFR (P ⬍ 0.05) groups showing a significantly higher increase in muscle CSA compared with CON. Gastrocnemius medialis CSA increased from 14.3⫾ 4.5 cm2 to 15.4⫾ 4.5 cm2
(⫹7.7%) and from 16.5 ⫾ 3.2 cm2to 18.0⫾ 4.5 cm2(⫹9.1%)
in the HL and LL-BFR groups, respectively (Fig. 4). The muscle CSA of the CON group did not change significantly (from 14.2⫾ 1.6 cm2 to 14.3⫾ 1.6 cm2). The ITT analysis
revealed similar results, with a significant main effect of time (P ⬍ 0.01, p2⫽ 0.235) and time ⫻ group interaction (P ⬍ 0.05,p2⫽ 0.163).
Maximal Voluntary Torque
The rmANOVA showed a significant main effect of time (F1,33⫽ 20.64, P ⬍ 0.01, p2⫽ 0.385) as well as a time ⫻ group
interaction (F2,33⫽ 7.39, P ⬍ 0.01, p2⫽ 0.309). After 14 wk
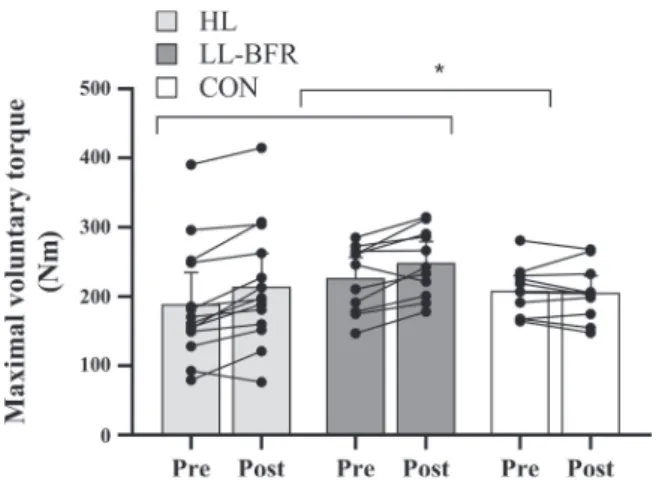
of resistance training, both training groups significantly in-creased their maximal isometric voluntary contraction torque [HL: from 189.0⫾ 83.1 Nm to 214.6 ⫾ 86.1 Nm (P ⬍ 0.05); LL-BFR: from 226.7⫾ 47.6 Nm to 248.9 ⫾ 48.5 Nm (P ⬍ 0.05)] whereas maximal voluntary torque remained unchanged in the CON group (pre: 208.5⫾ 35.4 Nm, post: 205.5 ⫾ 38.9 Nm, P ⫽ 0.52; Fig. 5). Relative changes were ⫹13.5% and ⫹9.8% for the HL and LL-BFR groups, with ⫺1.4% in the CON group. After calculation of an ITT analysis, a significant main effect of time (P ⬍ 0.01, p2⫽ 0.196) and a significant time⫻ group interaction (P ⬍ 0.01, p2⫽ 0.170) were found.
Lifestyle Parameters
At baseline, the groups did not show significant differences in the level of physical activity or nutritional status (P⬎ 0.05). After the intervention, no significant interaction effect was identified for either physical activity (P⫽ 0.330, p2⫽ 0.06) or protein (P⫽ 0.262, p2⫽ 0.074), fat (P ⫽ 0.426, p2⫽ 0.048), or carbohydrate (P⫽ 0.801, p2⫽ 0.013) intake.
DISCUSSION
To the best of our knowledge, this is the first study that evaluated the effects of LL-BFR training on functional and structural Achilles tendon properties. The overall findings revealed that, despite a much smaller training load, LL-BFR caused adaptions in Achilles tendon CSA and mechanical properties as well as in muscle mass and strength comparable to HL.
Tendon Properties
The results of our study showed that 14 wk of progressive LL-BFR and HL training serves as a potent stimulus for causing tendon hypertrophy compared with a nonexercising control group. Typically, morphological changes at the tendon
Fig. 5. Pre- and posttraining values of maximal voluntary contraction torque in the high-load (HL), low-load blood flow restriction (LL-BFR), and nonexer-cising control (CON) groups. Data are means⫾ 95% confidence interval. Black dots represent individual data points. *Significantly different (P⬍ 0.05) by repeated-measures ANOVA (time⫻ group interaction).
Fig. 3. Pre- and posttraining values of Achilles tendon stiffness in the high-load (HL), low-load blood flow restriction (LL-BFR), and nonexercising control (CON) groups. Data are means⫾ 95% confidence interval. Black dots repre-sent individual data points. *Significantly different (P⬍ 0.05) by repeated-measures ANOVA (time⫻ group interaction).
Fig. 4. Pre- and posttraining values of gastrocnemius medialis muscle cross-sectional area (CSA) in the high-load (HL), low-load blood flow restriction (LL-BFR), and nonexercising control (CON) groups. Data are means⫾ 95% confidence interval. Black dots represent individual data points. *Significantly different (P⬍ 0.05) by repeated-measures ANOVA (time ⫻ group interac-tion).
level have been reported to occur as a result of long-term or habitual loading (58). However, several studies show that structural adaptations can also be detected as early as 9 –12 wk after heavy-load resistance training (5, 33, 52). The observed increases in Achilles tendon CSA in the present study in the HL group (⫹4.6%) greatly mirrored results from earlier inves-tigations reporting changes in tendon CSA between ~4% and 7% following several weeks of exercise training (5, 33, 52). Interestingly, not only the HL but also the LL-BFR group displayed a significant increase in Achilles tendon CSA (⫹7.8%) with training loads well below those that have been used previously (33, 52). To date, only a single previous study has investigated the effects of BFR training on human tendon properties (35). The study of Kubo and colleagues (35) re-vealed that LL-BFR (20% 1RM) and HL (80% 1RM) training for the knee extensors failed to elicit substantial patellar tendon hypertrophy after 12 wk of resistance training. Potential rea-sons for this inconsistency might lie within the methodological approach. In their study, Kubo et al. (35) used an average of three tendon CSA values (25%, 50%, and 75% of tendon length) to assess tendon hypertrophy even though it was shown that exercise-induced changes in tendon CSA primarily occur at the proximal and distal sites of the tendon, with only minor or no changes in the midsection (33, 52). Averaging the values of the different assessment regions might therefore underesti-mate the actual increase in tendon size. Although our results indicate that LL-BFR and HL training are equally effective in facilitating tendon hypertrophy, our study design does not allow us to answer the question of the extent to which the hypoxic condition itself contributed to the increased tendon CSA. Although a previous animal experiment in horses showed that 2 wk of walking with BFR did not induce significant changes in tendon thickness compared with walking without BFR (1), there is evidence that indicates that a hypoxic milieu (as induced with BFR) stimulates the proliferation of tendon stem cells (30), potentially enhancing tendon repair (2). Furthermore, one study demonstrated that the addition of BFR to exercise increases the secretion of basic fibroblast growth factor (53), which is known to enhance fibroblast proliferation (29, 42) and thus might lead to increased collagen synthesis rates (59).
Besides the morphological changes, the results of the present study show that Achilles tendon stiffness was substantially improved after HL (⫹40.7%) and LL-BFR (⫹36.1%) training, with no changes in the CON group (⫹3.6%). This magnitude of increased Achilles tendon stiffness is comparable to what has previously been reported after 14 wk of resistance training with a load of 90% MVC (13). At first sight, the increased stiffness following LL-BFR training with loads of only 20 – 35% 1RM seems surprising given that a previous meta-analysis indicates that training loads of ⬎70% MVC are needed to induce adaptations in tendon stiffness (11). Although previous research groups suggest that strain (~4%) is essential for adequate adaptations (5, 6), we suggest that strain and stress are not the only factors influencing mechanical tendon adap-tations and that the number of loading cycles (52) and/or concurrent tissue hypoxia might mediate this response. In contrast to Kubo et al. (35), we did find an increase in tendon stiffness not only in the HL group but also in the LL-BFR group. Apart from the fact that Kubo et al. (35) investigated patellar tendon adaptations and we looked at the Achilles tendon, differences in the overall loading of the tendon might
also explain the different results. Whereas Kubo and coworkers (35) only adjusted the load for the HL group, we also progres-sively increased the load in the LL-BFR in the present study. When focusing on material tendon properties, Young’s mod-ulus of the Achilles tendon did not significantly change be-tween the groups. Even though this lack of statistical signifi-cance is not in accordance with earlier studies (5, 13, 52), it is consistent with findings from Kongsgaard et al. (33), who reported that 12 wk of neither low-load nor high-load resis-tance training significantly affected patellar tendon modulus in young men. The contrast of the results to other studies might be related to differences in methodology and age. Comparably to Kongsgaard et al. (33), Couppé and coworkers (21) confirmed that in young men changes in tendon stiffness are largely explained by alterations in tendon size rather than material properties. This notion, however, needs to be further investi-gated. Another important point in this regard is that current in vivo techniques frequently may lack sensitivity to detect changes in tendon properties (24, 58).
Muscle Properties
The findings of the present study show that the addition of BFR to LL resistance training increases muscle CSA compa-rable to what is seen after conventional HL resistance training, in line with previous investigations (35, 43, 54). Kubo and coworkers (35), for example, found that muscle mass increased by ~7% in both HL and LL-BFR groups after a 12-wk resis-tance training period in young men. The slightly higher degree of muscle hypertrophy in the present study (HL: ~8%; LL-BFR: ~9%) might be attributed to the length of the interven-tion, which was 2 wk longer than that in the study of Kubo et al. (35).
At first sight, our results do not appear to corroborate previously published meta-analyses indicating that HL resis-tance training induces greater strength gains compared with LL-BFR resistance training (14, 39). However, the relative strength increases in the HL group (~14%) in the present study showed descriptively larger changes compared with the LL-BFR group (~10%). When examining potential reasons for these slightly inferior muscle strength adaptations following LL-BFR, evidence from a recent study suggests that parame-ters of neural drive seem to differ between the two training regimens (19). Cook and colleagues (19) infer that this might be related to a greater degree of motor unit recruitment and/or firing rates with HL. However, the interpretation of electro-myography (EMG) regarding both factors is difficult since various variables including motor unit synchronization, fa-tigue, and motor unit cycling contribute to changes in EMG amplitude (23, 55, 57). Another frequently used method to investigate neural drive is the twitch interpolation technique (27). Studies comparing long-term HL and LL-BFR training state that the muscle activation level (assessed with superim-posed electrical stimuli) significantly increased after 12 wk of heavy-load training (⫹3%), with no changes in LL-BFR (35). Similar findings were reported by Colomer-Poveda et al. (16), who demonstrated that 4 wk of LL training with and without BFR did not lead to changes in neural drive or motoneuronal excitability measured with V-wave and H-reflex stimulation. These results, however, contrast with recent findings from Cook and colleagues (20), who did not identify significant
changes in muscle activation following 6 weeks of HL and LL-BFR training. Besides physiological determinants, test specificity has been speculated to play a crucial role in this context (17). The phenomenon of specificity postulates that the closer the test mimics the trained movement, the better is the transfer from the training to this test (49). Consequently, it might be assumed that the HL training regimen is technically closer to the maximal voluntary torque testing compared with the LL resistance training with BFR.
Limitations
The present study design did not allow us to answer the question to what extent the BFR stimulus alone might be responsible for the muscular and tendinous adaptations because we did not include a group that trained with loads similar to the LL-BFR group but without vascular occlusion. Additionally, tendon stiffness was calculated at maximal individual torque level. Since the linear portion of the force-elongation curve is not always reached in vivo, this approach is sometimes biased by the maximal torque reached by the subjects. In this case, however, we observed up to 300% interindividual differences in torque (see Fig. 5), which would have resulted in the analysis of the toe region of the strongest subjects if we used a method based on a common force level. The bias induced by this approach would have been larger than with the method based on individual maximal torque, which at least guarantees that we consider the region closest to the linear portion of the curve. Furthermore, the US-based assessment of tendon CSA has been reported to lack sensitivity and high accuracy (12), indicating that further research is needed to evaluate these changes with more precise techniques such as MRI. With regard to the study population, it needs to be mentioned that our findings were obtained from young men and must therefore not necessarily be valid for female subjects or individuals of different ages. Additionally, further research is warranted be-fore any clinical recommendations can be made.
Conclusions
The present study demonstrated that low-load (20 –35% 1RM) blood flow restriction training can induce muscular and tendi-nous adaptations that are similar to high-load (70 – 85% 1RM) resistance training. These results are of high relevance for both sports and rehabilitation settings when the lifting of high training loads is contraindicated. Future studies, however, are required to further investigate potential adaptive mechanisms and strengthen the evidence for LL-BFR training in various populations including clinical patients.
ACKNOWLEDGMENTS
We thank all participants who volunteered for this study.
DISCLOSURES
No conflicts of interest, financial or otherwise, are declared by the authors.
AUTHOR CONTRIBUTIONS
C.C., B.L., O.R.S., S.J., T.S., A.G., and D.K. conceived and designed research; C.C., S.J., and T.S. performed experiments; C.C., B.L., S.J., and T.S. analyzed data; C.C., B.L., O.R.S., S.J., T.S., A.G., and D.K. interpreted results of experiments; C.C. prepared figures; C.C. and B.L. drafted manuscript; C.C., B.L., O.R.S., S.J., T.S., A.G., and D.K. edited and revised manuscript; C.C., B.L., O.R.S., S.J., T.S., A.G., and D.K. approved final version of manuscript.
REFERENCES
1. Abe T, Kearns CF, Manso Filho HC, Sato Y, McKeever KH. Muscle, tendon, and somatotropin responses to the restriction of muscle blood flow induced by KAATSU-walk training. Equine Vet J Suppl 38: 345–348, 2006. doi:10.1111/j.2042-3306.2006.tb05566.x.
2. Ahmad Z, Wardale J, Brooks R, Henson F, Noorani A, Rushton N. Exploring the application of stem cells in tendon repair and regeneration.
Arthroscopy 28: 1018 –1029, 2012. doi:10.1016/j.arthro.2011.12.009. 3. Ahtiainen JP, Hoffren M, Hulmi JJ, Pietikäinen M, Mero AA, Avela
J, Häkkinen K. Panoramic ultrasonography is a valid method to measure
changes in skeletal muscle cross-sectional area. Eur J Appl Physiol 108: 273–279, 2010. doi:10.1007/s00421-009-1211-6.
4. American College of Sports Medicine. American College of Sports Medicine position stand. Progression models in resistance training for healthy adults. Med
Sci Sports Exerc 41: 687–708, 2009. doi:10.1249/MSS.0b013e3181915670. 5. Arampatzis A, Karamanidis K, Albracht K. Adaptational responses of
the human Achilles tendon by modulation of the applied cyclic strain magnitude. J Exp Biol 210: 2743–2753, 2007. doi:10.1242/jeb.003814. 6. Arampatzis A, Peper A, Bierbaum S, Albracht K. Plasticity of human
Achilles tendon mechanical and morphological properties in response to cyclic strain. J Biomech 43: 3073–3079, 2010. doi:10.1016/j.jbiomech. 2010.08.014.
7. Arya S, Kulig K. Tendinopathy alters mechanical and material properties of the Achilles tendon. J Appl Physiol (1985) 108: 670 –675, 2010. doi:10.1152/japplphysiol.00259.2009.
8. Baechle TR, Earle RW. Essentials of Strength Training and
Condition-ing. Champaign, IL: Human Kinetics, 2000.
9. Benjamin M, Toumi H, Ralphs JR, Bydder G, Best TM, Milz S. Where tendons and ligaments meet bone: attachment sites (“entheses”) in relation to exercise and/or mechanical load. J Anat 208: 471–490, 2006. doi:10. 1111/j.1469-7580.2006.00540.x.
10. Berg HE, Tedner B, Tesch PA. Changes in lower limb muscle cross-sectional area and tissue fluid volume after transition from standing to supine. Acta Physiol
Scand 148: 379–385, 1993. doi:10.1111/j.1748-1716.1993.tb09573.x. 11. Bohm S, Mersmann F, Arampatzis A. Human tendon adaptation in
response to mechanical loading: a systematic review and meta-analysis of exercise intervention studies on healthy adults. Sports Med Open 1: 7, 2015. doi:10.1186/s40798-015-0009-9.
12. Bohm S, Mersmann F, Schroll A, Mäkitalo N, Arampatzis A. Insuf-ficient accuracy of the ultrasound-based determination of Achilles tendon cross-sectional area. J Biomech 49: 2932–2937, 2016. doi:10.1016/j. jbiomech.2016.07.002.
13. Bohm S, Mersmann F, Tettke M, Kraft M, Arampatzis A. Human Achilles tendon plasticity in response to cyclic strain: effect of rate and duration. J Exp Biol 217: 4010 –4017, 2014. doi:10.1242/jeb.112268. 14. Centner C, Wiegel P, Gollhofer A, König D. Effects of blood flow
restriction training on muscular strength and hypertrophy in older individuals: a systematic review and meta-analysis. Sports Med 49: 95–108, 2019. [Erra-tum in Sports Med 49: 109, 2019.] doi:10.1007/s40279-018-0994-1. 15. Cho KH, Lee HJ, Lee WH. Reliability of rehabilitative ultrasound
imaging for the medial gastrocnemius muscle in poststroke patients. Clin
Physiol Funct Imaging 34: 26 –31, 2014. doi:10.1111/cpf.12060. 16. Colomer-Poveda D, Romero-Arenas S, Vera-Ibáñez A, Viñuela-García
M, Márquez G. Effects of 4 weeks of low-load unilateral resistance training,
with and without blood flow restriction, on strength, thickness, V wave, and H reflex of the soleus muscle in men. Eur J Appl Physiol 117: 1339 –1347, 2017. doi:10.1007/s00421-017-3622-0.
17. Cook SB, Cleary CJ. Progression of blood flow restricted resistance training in older adults at risk of mobility limitations. Front Physiol 10: 738, 2019. doi:10.3389/fphys.2019.00738.
18. Cook SB, LaRoche DP, Villa MR, Barile H, Manini TM. Blood flow restricted resistance training in older adults at risk of mobility limitations.
Exp Gerontol 99: 138 –145, 2017. doi:10.1016/j.exger.2017.10.004. 19. Cook SB, Murphy BG, Labarbera KE. Neuromuscular function after a
bout of low-load blood flow-restricted exercise. Med Sci Sports Exerc 45: 67–74, 2013. doi:10.1249/MSS.0b013e31826c6fa8.
20. Cook SB, Scott BR, Hayes KL, Murphy BG. Neuromuscular adapta-tions to low-load blood flow restricted resistance training. J Sports Sci
Med 17: 66 –73, 2018.
21. Couppé C, Kongsgaard M, Aagaard P, Hansen P, Bojsen-Moller J,
Kjaer M, Magnusson SP. Habitual loading results in tendon hypertrophy
and increased stiffness of the human patellar tendon. J Appl Physiol (1985) 105: 805–810, 2008. doi:10.1152/japplphysiol.90361.2008.
22. Del Re AC, Maisel NC, Blodgett JC, Finney JW. Intention-to-treat analyses and missing data approaches in pharmacotherapy trials for alcohol use disorders.
BMJ Open 3: e003464, 2013. doi:10.1136/bmjopen-2013-003464.
23. Dideriksen JL, Farina D, Enoka RM. Influence of fatigue on the simulated relation between the amplitude of the surface electromyogram and muscle force. Philos Trans A Math Phys Eng Sci 368: 2765–2781, 2010. doi:10.1098/rsta.2010.0094.
24. Ekizos A, Papatzika F, Charcharis G, Bohm S, Mersmann F,
Aram-patzis A. Ultrasound does not provide reliable results for the measurement
of the patellar tendon cross sectional area. J Electromyogr Kinesiol 23: 1278 –1282, 2013. doi:10.1016/j.jelekin.2013.08.004.
25. Farup J, de Paoli F, Bjerg K, Riis S, Ringgard S, Vissing K. Blood flow restricted and traditional resistance training performed to fatigue produce equal muscle hypertrophy. Scand J Med Sci Sports 25: 754 –763, 2015. doi:10.1111/sms.12396.
26. Frey I, Berg A, Grathwohl D, Keul J. Freiburger Fragebogen zur körperlichen Aktivität—Entwicklung, Prüfung und Anwendung [Freiburg Questionnaire of physical activity— development, evaluation and applica-tion]. Soz Praventivmed 44: 55–64, 1999. doi:10.1007/BF01667127. 27. Herbert RD, Gandevia SC. Twitch interpolation in human muscles:
mechanisms and implications for measurement of voluntary activation. J
Neurophysiol 82: 2271–2283, 1999. doi:10.1152/jn.1999.82.5.2271. 28. Hughes L, Paton B, Rosenblatt B, Gissane C, Patterson SD. Blood flow
restriction training in clinical musculoskeletal rehabilitation: a systematic review and meta-analysis. Br J Sports Med 51: 1003–1011, 2017. doi:10. 1136/bjsports-2016-097071.
29. Jia YY, Zhou JY, Chang Y, An F, Li XW, Xu XY, Sun XL, Xiong CY,
Wang JL. Effect of optimized concentrations of basic fibroblast growth
factor and epidermal growth factor on proliferation of fibroblasts and expression of collagen: related to pelvic floor tissue regeneration. Chin
Med J (Engl) 131: 2089 –2096, 2018. doi:10.4103/0366-6999.239301. 30. Jiang D, Jiang Z, Zhang Y, Wang S, Yang S, Xu B, Yang M, Li Z.
Effect of young extrinsic environment stimulated by hypoxia on the function of aged tendon stem cell. Cell Biochem Biophys 70: 967–973, 2014. doi:10.1007/s12013-014-0004-7.
31. Kobayashi Y, Ueyasu Y, Yamashita Y, Akagi R. Effects of 4 weeks of explosive-type strength training for the plantar flexors on the rate of torque development and postural stability in elderly individuals. Int J Sports Med 37: 470 –475, 2016. doi:10.1055/s-0035-1569367.
32. Kongsgaard M, Nielsen CH, Hegnsvad S, Aagaard P, Magnusson SP. Mechanical properties of the human Achilles tendon, in vivo. Clin
Bio-mech (Bristol, Avon) 26: 772–777, 2011. doi:10.1016/j.clinbiomech.2011. 02.011.
33. Kongsgaard M, Reitelseder S, Pedersen TG, Holm L, Aagaard P,
Kjaer M, Magnusson SP. Region specific patellar tendon hypertrophy in
humans following resistance training. Acta Physiol (Oxf) 191: 111–121, 2007. doi:10.1111/j.1748-1716.2007.01714.x.
34. Kubo K, Kanehisa H, Fukunaga T. Effects of resistance and stretching training programmes on the viscoelastic properties of human tendon structures in vivo. J Physiol 538: 219 –226, 2002. doi:10.1113/jphysiol.2001.012703. 35. Kubo K, Komuro T, Ishiguro N, Tsunoda N, Sato Y, Ishii N, Kanehisa
H, Fukunaga T. Effects of low-load resistance training with vascular
occlusion on the mechanical properties of muscle and tendon. J Appl
Biomech 22: 112–119, 2006. doi:10.1123/jab.22.2.112.
36. Kubo K, Morimoto M, Komuro T, Yata H, Tsunoda N, Kanehisa H,
Fukunaga T. Effects of plyometric and weight training on muscle-tendon
complex and jump performance. Med Sci Sports Exerc 39: 1801–1810, 2007. doi:10.1249/mss.0b013e31813e630a.
37. Laurentino GC, Ugrinowitsch C, Roschel H, Aoki MS, Soares AG,
Neves M Jr, Aihara AY, Fernandes AR, Tricoli V. Strength training
with blood flow restriction diminishes myostatin gene expression. Med Sci
Sports Exerc 44: 406 –412, 2012. doi:10.1249/MSS.0b013e318233b4bc. 38. Libardi CA, Chacon-Mikahil MP, Cavaglieri CR, Tricoli V, Roschel
H, Vechin FC, Conceição MS, Ugrinowitsch C. Effect of concurrent
training with blood flow restriction in the elderly. Int J Sports Med 36: 395–399, 2015. doi:10.1055/s-0034-1390496.
39. Lixandrão ME, Ugrinowitsch C, Berton R, Vechin FC, Conceição MS,
Damas F, Libardi CA, Roschel H. Magnitude of muscle strength and mass
adaptations between high-load resistance training versus low-load resistance training associated with blood-flow restriction: a systematic review and meta-analysis. Sports Med 48: 361–378, 2018. doi:10.1007/s40279-017-0795-y. 40. Madarame H, Neya M, Ochi E, Nakazato K, Sato Y, Ishii N.
Cross-transfer effects of resistance training with blood flow restriction. Med Sci
Sports Exerc 40: 258 –263, 2008. doi:10.1249/mss.0b013e31815c6d7e.
41. Maganaris CN. Tendon conditioning: artefact or property? Proc Biol Sci 270, Suppl 1: S39 –S42, 2003. doi:10.1098/rsbl.2003.0004.
42. Makino T, Jinnin M, Muchemwa FC, Fukushima S, Kogushi-Nishi H,
Moriya C, Igata T, Fujisawa A, Johno T, Ihn H. Basic fibroblast growth
factor stimulates the proliferation of human dermal fibroblasts via the ERK1/2 and JNK pathways. Br J Dermatol 162: 717–723, 2010. doi:10. 1111/j.1365-2133.2009.09581.x.
43. Martín-Hernández J, Marín PJ, Menéndez H, Ferrero C, Loenneke
JP, Herrero AJ. Muscular adaptations after two different volumes of
blood flow-restricted training. Scand J Med Sci Sports 23: e114 –e120, 2013. doi:10.1111/sms.12036.
44. Mersmann F, Bohm S, Arampatzis A. Imbalances in the development of muscle and tendon as risk factor for tendinopathies in youth athletes: a review of current evidence and concepts of prevention. Front Physiol 8: 987, 2017. doi:10.3389/fphys.2017.00987.
45. Nakajima T, Kurano M, Iida H, Takano H, Oonuma H, Morita T,
Meguro K, Sato Y, Nagata T; KAATSU Training Group. Use and
safety of KAATSU training: results of a national survey. Int J KAATSU
Training Res 2: 5–13, 2006. doi:10.3806/ijktr.2.5.
46. Narici MV, Maganaris CN. Plasticity of the muscle-tendon complex with disuse and aging. Exerc Sport Sci Rev 35: 126 –134, 2007. doi:10.1097/ jes.0b013e3180a030ec.
47. Nielsen JL, Aagaard P, Bech RD, Nygaard T, Hvid LG, Wernbom M, Suetta
C, Frandsen U. Proliferation of myogenic stem cells in human skeletal muscle in
response to low-load resistance training with blood flow restriction. J Physiol 590: 4351–4361, 2012. doi:10.1113/jphysiol.2012.237008.
48. Patterson SD, Ferguson RA. Enhancing strength and postocclusive calf blood flow in older people with training with blood-flow restriction. J
Aging Phys Act 19: 201–213, 2011. doi:10.1123/japa.19.3.201. 49. Schoenfeld BJ, Grgic J, Ogborn D, Krieger JW. Strength and hypertrophy
adaptations between low- vs. high-load resistance training: a systematic review and meta-analysis. J Strength Cond Res 31: 3508 –3523, 2017. doi:
10.1519/JSC.0000000000002200.
50. Scholz MN, Bobbert MF, van Soest AJ, Clark JR, van Heerden J. Running biomechanics: shorter heels, better economy. J Exp Biol 211: 3266 –3271, 2008. doi:10.1242/jeb.018812.
51. Scott JM, Martin DS, Ploutz-Snyder R, Matz T, Caine T, Downs M,
Hackney K, Buxton R, Ryder JW, Ploutz-Snyder L. Panoramic
ultra-sound: a novel and valid tool for monitoring change in muscle mass. J
Cachexia Sarcopenia Muscle 8: 475–481, 2017. doi:10.1002/jcsm.12172. 52. Seynnes OR, Erskine RM, Maganaris CN, Longo S, Simoneau EM,
Grosset JF, Narici MV. Training-induced changes in structural and
mechan-ical properties of the patellar tendon are related to muscle hypertrophy but not to strength gains. J Appl Physiol (1985) 107: 523–530, 2009. doi:10.1152/ japplphysiol.00213.2009.
53. Shill DD, Polley KR, Willingham TB, Call JA, Murrow JR, McCully
KK, Jenkins NT. Experimental intermittent ischemia augments
exercise-induced inflammatory cytokine production. J Appl Physiol (1985) 123: 434 –441, 2017. doi:10.1152/japplphysiol.01006.2016.
54. Vechin FC, Libardi CA, Conceição MS, Damas FR, Lixandrão ME,
Berton RP, Tricoli VA, Roschel HA, Cavaglieri CR, Chacon-Mikahil MP, Ugrinowitsch C. Comparisons between low-intensity resistance training
with blood flow restriction and high-intensity resistance training on quadri-ceps muscle mass and strength in elderly. J Strength Cond Res 29: 1071– 1076, 2015. doi:10.1519/JSC.0000000000000703.
55. Vigotsky AD, Halperin I, Lehman GJ, Trajano GS, Vieira TM. Interpreting signal amplitudes in surface electromyography studies in sport and rehabilitation sciences. Front Physiol 8: 985, 2018. doi:10.3389/fphys.2017.00985. 56. Werkhausen A, Albracht K, Cronin NJ, Paulsen G, Bojsen-Møller J,
Seynnes OR. Effect of training-induced changes in Achilles tendon stiffness
on muscle-tendon behavior during landing. Front Physiol 9: 794, 2018. doi:10.3389/fphys.2018.00794.
57. Westad C, Westgaard RH, De Luca CJ. Motor unit recruitment and derecruitment induced by brief increase in contraction amplitude of the human trapezius muscle. J Physiol 552: 645–656, 2003. doi:10.1113/jphysiol.2003. 044990.
58. Wiesinger HP, Kösters A, Müller E, Seynnes OR. Effects of increased loading on in vivo tendon properties: a systematic review. Med Sci Sports
Exerc 47: 1885–1895, 2015. doi:10.1249/MSS.0000000000000603. 59. Yang G, Crawford RC, Wang JH. Proliferation and collagen production
of human patellar tendon fibroblasts in response to cyclic uniaxial stretch-ing in serum-free conditions. J Biomech 37: 1543–1550, 2004. doi:10. 1016/j.jbiomech.2004.01.005.