Early Regional Hypometabolism in Presymptomatic
MAPT carriers: A GENFI Sub-Study
Mémoire
Frédéric St-Onge
Maîtrise en neurobiologie - avec mémoire
Maître ès sciences (M. Sc.)
Early Regional Hypometabolism in Presymptomatic
MAPT carriers
A GENFI Sub-Study
Mémoire de maîtrise (Maîtrise en neuroscience, M.Sc.)
Frédéric St-Onge, B.A.
Sous la direction de :
Résumé
Presqu’un tier des cas de démence frontotemporale est causé par une mutation sur les gènes progranulin (GRN), microtubule-associated protein tau (MAPT) ou chromosome 9 open reading frame 72 (C9ORF72). Plusieurs années avant le début de la maladie, plusieurs études montrent déjà des changements au niveau cérébral chez les porteurs pré-symptomatiques de ces mutations. En utilisant la TEP-FDG, nous posons l’hypothèse que les changements cérébraux de ces porteurs de mutations apparaîtront de façon plus précoce qu’en utilisant des techniques d’imagerie traditionnelles. Nous avons recruté 18 participants venant de familles à risque de DFT (6 porteurs de mutations MAPT et 12 non-porteurs) de l’étude GENFI. Un examen clinique et neuropsychologique complet a été effectué. Une TEP-FDG a été effectuée chez tous nos participants. Les images ont été segmentées et analysées par le logiciel MIMNeuro. Les porteurs et non-porteurs ne diffèrent pas significativement entre les groupes quant au métabolisme cérébral peu importe la région. L’évaluation visuelle par un médecin nucléiste expert ne semble pas non-plus être en mesure de différencier les porteurs des non-porteurs. L’observation qualitative des imageries des patients semble montrer des altérations médiales temporales chez la majorité des porteurs de mutation et chez quelques non-porteurs.
Abstract
About one third of frontotemporal dementia (FTD) are caused by mutations on the progranulin (GRN), microtubule-associated protein tau (MAPT) or chromosome 9 open reading frame 72 (C9ORF72) genes. Several studies show that there are cerebral changes many years prior to the actual onset of the disease in pre-symptomatic carriers. Using fluorodeoxyglucose-positron emission tomography (FDG-PET), we expected to observe cerebral changes in carriers earlier than other traditional imaging techniques. We recruited 18 participants from families at risk of FTD (6 carriers and 12 non-carriers) from the GENFI study. A complete clinical and neuropsychological examination was performed. FDG-PET scan was done in all participants. Carriers and non-carriers did not differ significantly regarding brain metabolism (regardless of the region). Visual inspection by an expert nuclear medicine specialist could not differentiate carriers from non-carriers. Qualitative analyses of imaging of patients showed medial temporal alterations in most carriers and in some non-carriers.
Table of contents
Résumé ... ii
Abstract ... iii
Table of contents ... iv
List of figures, tables and illustrations ... vi
List of abbreviations, initials and acronyms... vii
Acknowledgements ... viii
Introduction ... 1
0.1 – Epidemiology of Frontotemporal Dementia ... 1
0.2 – Clinical and neuropathological presentation of FTD ... 2
0.2.1 – Behavioural variant FTD... 2
0.2.2 – Semantic variant FTD ... 4
0.2.3 – Non-fluent variant FTD ... 5
0.3 – Current challenges in the clinical and research fields of FTD: Diagnostic delay and lack of treatment . 6 0.4 – Genetics of FTD ... 9
0.5 – Existing biomarkers for FTD ... 11
0.6 – Genetic carriers of FTD: Clinical and brain imaging presentation ... 12
0.6.1 – GRN mutation carriers ... 12
0.6.2 – C9ORF72 mutation carriers ... 15
0.6.3 – MAPT mutation carriers ... 17
0.7 – Current gaps in the literature ... 20
0.8 – Study objectives and hypotheses ... 22
Chapter 1 – Methods ... 23
1.1 - Study participants ... 23
1.2 - Genetic status of participants ... 23
1.3 - Measures and procedure ... 24
1.3.1 - Clinical and cognitive measures ... 24
1.3.2 - Neuroimaging acquisition and segmentation ... 24
1.3.4 - Visual analysis of FDG-PET images ... 27
1.4 - Statistical analyses ... 27
Chapter 2 - Results ... 29
2.2 - Quantitative Brain Imaging ... 29
2.3 - Qualitative analysis of individual scores ... 30
2.4 - Visual inspection ... 31
Chapter 3 - Discussion ... 32
3.1 – Main findings and discussion ... 32
3.2 - Strengths and limitation of this study ... 36
3.3 - Future research ... 37
Conclusion ... 39
Annex A – Figure 1 – Recruitment procedures for the MAPT Sub-Study ... 41
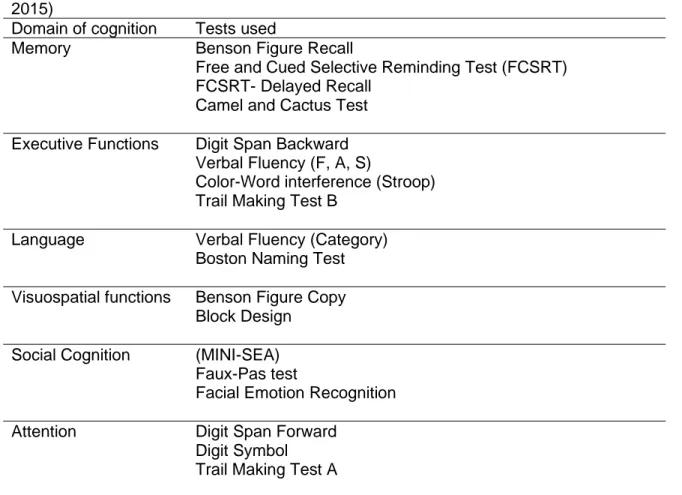
Annex B – Table 1 – Neuropsychological tests used in the GENFI study... 42
Annex C – Table 2 – Neuropsychiatric tests used in the GENFI study ... 43
Annex D – Table 3 – Neuropsychiatric tests used in the MAPT Sub-Study ... 44
Annex E – Figure 2 – Sensitivity and specificity of the visual inspection analysis ... 45
Annex F – Table 4 – Demographic Information ... 46
Annex G – Table 5 – Qualitative observation of FDG-PET Z-scores ... 49
Annex H – Table 6 – Sensitivity and specificity analyses ... 51
List of figures, tables and illustrations
Figure 1 – Recruitment procedures for the MAPT Sub-StudyFigure 2 – Sensitivity and specificity of the visual inspection analysis Table 1 – Neuropsychological tests used in the GENFI study Table 2 – Neuropsychiatric tests used in the GENFI study Table 3 – Neuropsychiatric tests used in the MAPT Sub-Study Table 4 – Demographic Information
Table 5 – Qualitative observation of FDG-PET Z-scores Table 6 – Sensitivity and specificity analyses
List of abbreviations, initials and acronyms
AD: Alzheimer’s diseaseALS: Amyotrophic Lateral Sclerosis ASL: Arterial Spin Labelling
bvFTD: Behavioural variant of frontotemporal dementia C9ORF72: Chromosome 9 open reading frame 72 CSF: Cerebrospinal Fluid
CT: Computed tomography DTI: Diffusion Tensor Imaging
FDG-PET: Fluorodeoxyglucose positron emission tomography FTD: Frontotemporal dementia
FTLD: Frontotemporal Lobar Degeneration GENFI: Genetic Frontotemporal Initiative GRN: Progranulin gene
MAPT: Microtubule-associated protein tau MMSE: Mini Mental State Examination MRI: Magnetic Resonance Imaging
nfvPPA: Non-fluent variant of Primary Progressive Aphasia PPA: Primary Progressive Aphasia
svPPA: Semantic variant of primary progressive aphasia SPECT: Single-photon emission computed tomography
Acknowledgements
A lot of people contributed to this thesis by near or by far. First, I would like to thank the team at the Clinique de la Mémoire of the l’Enfant-Jésus Hospital (CHU de Québec-Université Laval) for helping with the data collection and their support (Audrey Paradis, Nancy Parent, Mélanie Harvey, Dr. Louis Verret, Synthia Meilleur-Durand). I would also like to thank the team at the Hotel-Dieu de Québec Hospital (CHU de Québec-Université Laval) for their help in scheduling and administering the TEP scans. Second, I would like to thank my family (particularly my parents and my brothers) for their support through this endeavor. Third, I would also like to thank my supervisor. Through his guidance, I have gained a lot of autonomy and skills to pursue my career in research. He also provided me with opportunities not otherwise available for my future, for which I am eternally grateful. Finally, I would like to thank my husband for his unwavering support in my work. Many hours of my time were consecrated to this paper, through which he never complained and lent incredible moral support.
Introduction
0.1 – Epidemiology of Frontotemporal Dementia
Dementia is a major disease of aging and a current major public health issue, looming to take even larger proportions in the upcoming years. Between 1990 and 2016, there has been a rise of 117% in case prevalence, from 20.2 million to 43.8 million worldwide, while dementia was also the 2nd largest cause of death in 2016 in individuals aged over 70.
(Nichols et al., 2019) In Canada, more than 340,000 cases were identified in 2011, costing more than 527 million in direct health care costs; mainly through long-term nursing facilities. Both numbers are expected to double by 2031, (Government of Canada & Neurological Health Charities Canada, 2014) mostly explained by the rapid growth in population and aging. (Government of Canada & Neurological Health Charities Canada, 2014; Nichols et al., 2019) Considering that the population of Canada will grow to 40 million by 2031 with almost a quarter over the age of 65 (Government of Canada & Neurological Health Charities Canada, 2014), there is a great sense of urgency in finding a cure. Frontotemporal dementia (FTD) is a major subtype of dementia where behavioural and/or language disturbances present as the hallmark of the disorder (Ghosh & Lippa, 2015). With a prevalence of between 0.01 and 4.61 per 1000 persons, with an incidence rate of 0.00 to 0.33 per 1000 person per year, FTD is a relatively rare disorder, (Hogan et al., 2016) although it is the most prevalent type of dementia before 65 years of age. (Coyle-Glichrist et al., 2016; Galvin, Howard, Denny, Dickinson, & Tatton, 2017). As such, FTD occurs mostly in working-age individuals, where the patient and/or the caregiver might still be working or have dependants. Epidemiologic research has indeed shown that this diagnostic results in a major reduction of household income, loss of workdays and heightened caregiver burden. (Galvin et al., 2017) Furthermore, FTD-related disorders often have relatively short life expectancy, with as low as 2.50 mean years from symptom onset in FTD-Amyotrophic Lateral Sclerosis (ALS)
to approximately 8 years in the behavioural variant of FTD (bvFTD). (Kansal et al., 2016) However, survival following diagnosis is much lower, at 4.5 years in bvFTD, indicating an important delay between the moment symptoms first appear and where an actual diagnosis is made. (Coyle-Glichrist et al., 2016)
0.2 – Clinical and neuropathological presentation of FTD
0.2.1 – Behavioural variant FTD
Among the reasons why a diagnosis is posed much later than the actual symptom onset lies the complexity and heterogeneity of the disorder. In clinical settings, patients will often present atypical symptoms, not classically associated with “typical” diagnoses such as Alzheimer’s disease. Phenotypically, FTD can be branched in three major subtypes: behavioural variant FTD (bvFTD), Primary Progressive Aphasia (PPA) (Ghosh & Lippa, 2015; Karageorgiou & Miller, 2014) and the Amyotrophic Lateral Sclerosis-Frontotemporal Lobar Degeneration spectrum (ALS-FTLD; Burrell et al. (2016)).
Patients with bvFTD usually present with personality, behavioural and/or executive functioning changes at the forefront of the clinical display. While apathy or inertia is usually the most prevalent feature, behavioural disinhibition, loss of sympathy or empathy, perseverative behaviour, hyperorality/dietary changes and a neuropsychological profile suggestive of executive deficits are all among the classical symptoms. (Ghosh & Lippa, 2015; Karageorgiou & Miller, 2014; Rascovsky et al., 2011) In addition to the progressive deterioration of the patient’s condition, at least three of the above symptoms must be present for a possible diagnosis of bvFTD to be made. The symptoms must also not be better explained by another neurodegenerative or medical disorder, including a psychiatric presentation. Finally, for a probable diagnosis of bvFTD, the patient must demonstrate significant functional decline and present imaging results consistent with the disorder. (Rascovsky et al., 2011) Temporally speaking, patients will usually start by presenting poor
personal regulation and/or social decorum (behaviour), and/or poor judgement and problem solving. As the disease progresses, more functional difficulties will emerge, leading to difficulties in managing community affairs, home chores and personal care. This intermediate stage might also see an emergence of stereotypies and eating disorders. Finally, in the advanced stage of the disease, other cognitive functions might start to be affected, such as episodic memory and orientation (Karageorgiou & Miller, 2014), although some reports suggest that episodic memory could be affected more frequently then thought but is less well detected due to the nature of the clinical tests used. (Hornberger & Piguet, 2012). bvFTD poses significant challenges in the clinic, since the early presentation of behavioural and personality changes might be confounded or intermingled with psychiatric disorders (Devenney et al., 2015; Galimberti, Dell'Osso, Altamura, & Scarpini, 2015), while atypical presentations are relatively frequent.
The common symptoms of bvFTD (i.e. behavioural, personality and executive functioning changes) are mirrored to specific brain regions associated with these functions. From a diagnostic point of view, structural anomalies in the frontal and anterior temporal brain regions are considered necessary to pose a diagnosis of probable bvFTD. (Rascovsky et al., 2011) While several studies confirm this frontal (Pan et al., 2012; Perry et al., 2017; Staffaroni et al., 2019; Vijverberg et al., 2016; Zhang et al., 2013) and anterior temporal pattern (Vijverberg et al., 2016; Zhang et al., 2013), several other regions have been identified as atrophied in subjects with bvFTD compared to normal controls. In particular, the striatum (Halabi et al., 2013; Möller et al., 2015; Pan et al., 2012; Perry et al., 2017) and the insula are often mentioned in the literature (Pan et al., 2012; Perry et al., 2017). Other, deeper, gray matter structures are also reported such as the hippocampus, the amygdala and the thalamus. (Möller et al., 2015). Functional abnormalities (using single-photon emission computed tomography (SPECT) or fluorodeoxyglucose positron emission tomography (FDG-PET) imaging) are also considered in diagnostic criteria of probable
bvFTD, again, involving a frontal and anterior temporal hypometabolism pattern (Rascovsky et al., 2011). Although less studied than structural imaging, FDG-PET or SPECT have indeed found a similar frontal and anterior temporal lobe hypometabolism and hypoperfusion in affected patients (Brown, Bohnen, Wong, Minoshima, & Frey, 2014; Diehl-Schmid et al., 2007; Vijverberg et al., 2016). Again, regions of the striatum are highlighted by some studies in bvFTD patients (Brown et al., 2014; Diehl-Schmid et al., 2007). Late in the disease, other regions are also affected, such as the posterior cingulate gyri, and more posterior regions such as the parietal lobe regions (Brown et al., 2014; Diehl-Schmid et al., 2007), which probably represent the progression of the neurodegeneration throughout the cortex or network alteration. (Filippi et al., 2013)
0.2.2 – Semantic variant FTD
Contrarily to bvFTD where behavior and executive changes are at the forefront of the presentation, patients with PPA will usually present with language deficits as the most prominent and initial clinical feature, which is causing impaired living activities. (Mesulam, 2001) PPA phenotypes can further be divided in three categories, mainly semantic variant (svPPA), non-fluent agrammatic variant (nfvPPA) and logopenic variant (lvPPA). (Gorno-Tempini et al., 2011; Karageorgiou & Miller, 2014) As the name implies, svPPA’s hallmark presentation is semantic difficulties. Patients will primarily display impaired confrontation naming and impaired single-word comprehension. (Gorno-Tempini et al., 2011) This lack of comprehension vis-à-vis certain objects, particularly objects with which the patient is less familiar (i.e. low-frequency), is usually at the forefront. (Ghosh & Lippa, 2015; Landin-Romero, Tan, Hodges, & Kumfor, 2016) svPPA is further divided in left svPPA (l-svPPA) and right svPPA (r-SVPPA). This is because the clinical profile of patients may differ according to the side of the brain on which the atrophy first starts to occur. The l-svPPA phenotype refers to the presentation above, where language deficits are overwhelming at
the early clinical presentation. Such cases will usually progress over time, where behavioural symptoms may appear, such as emotional distance, irritability and disinhibition. (Karageorgiou & Miller, 2014) Language deficits will usually also progress, where incomprehension of words will first affect low-frequency words and progress to more familiar words that may be used more frequently by patients. (Landin-Romero et al., 2016) In the r-svPPA form, languages deficits are usually less obvious, and may affect non-verbal aspects of language or other cognitive aspects. Indeed, prosopagnosia and phonagnosia are often seen. (Ghosh & Lippa, 2015) Early on, patients may also present behavioural symptoms, such as a lack of insight and emotional distance (Karageorgiou & Miller, 2014), making differential diagnosis with psychiatric difficulties and bvFTD more difficult in the early stages.
As mentioned above, one of the particularities with svPPA is the separation of the clinical phenotype in two, according to which side of the brain present the initial/the most atrophy. In the case of left-predominant svPPA, the grey matter loss is mostly restricted asymmetrically to temporal lobe (e.g. amygdala, hippocampus, temporal pole), limbic and frontal structures. Similar atrophy patterns are seen in right-predominant svPPA, with the difference that the atrophy pattern affect the right hemisphere instead of the
left-hemisphere. Right-predominant -atrophy is also distinct by its frequent behavioural presentation (Landin-Romero et al., 2016)
0.2.3 – Non-fluent variant FTD
Another PPA phenotype is nfvPPA. Contrary to the semantic variant, patients with nfvPPA usually preserve their comprehension of single words and knowledge of objects at the expense of slow, non-fluent speech and agrammatism in the production of language. Comprehension of complex sentences is also impaired. (Gorno-Tempini et al., 2011) Early presentation will often include slow speech, a decreased word output and sentence length with word finding difficulties, progressing to apraxia of speech, agrammatism, phonemic
paraphasia and mild dysexecutive symptoms. In the late stage of the disease, mutism and a worsening of executive, memory and language functions can be observed. Signs related to parkinsonism can also be observed. (Karageorgiou & Miller, 2014)
Structural neuroimaging in nfvPPA usually shows atrophy of the anterior cingulate gyrus, the frontoinsular cortex (asymmetric to the right) and the supplementary motor area. (Karageorgiou & Miller, 2014). Atrophy in the region of the uncinate fasciculus tract has also been reported in those patients (Catani et al., 2013).
0.3 – Current challenges in the clinical and research fields of FTD:
Diagnostic delay and lack of treatment
Among the problems for clinicians and researchers in the field of FTD is the important diagnostic delay between symptom onset and diagnosis (Ghosh & Lippa, 2015), and the lack of treatment for affected individuals (Tsai & Boxer, 2016).
These are intrinsically linked, as individuals whom are diagnosed present functionally incapacitating symptoms at diagnosis, as it is a diagnostic criterion in most cases (Gorno-Tempini et al., 2011; Mesulam, 2001; Rascovsky et al., 2011), indicating important brain damage originating before the diagnosis (Borroni et al., 2015), even before the symptoms appear (J. D. Rohrer et al., 2015). Since brain damage has occurred, even if the pathological element causing the disease is stopped, symptoms might not resolve as the affected brain regions may be too atrophied to counter the cognitive decline (Schuster, Elamin, Hardiman, & Bede, 2015). This was among the reasons evoked in the recent string of failures in Alzheimer’s disease clinical trials, where promising compounds could not produce meaningful clinical changes despite decades of research (Cummings, Morstorf, & Zhong, 2014). While clinical trials in FTD are still rare to this day, lessons could be learned from AD trials’ failures to obtain positive results from future clinical trials. This includes, earlier diagnosis of patients, i.e. before significant brain damage has occurred, which could in turn help provide potential future clinical trials in FTD to obtain positive results and retain function.
Diagnostic delay is defined as the time between the initial onset of symptoms and the correct attribution of FTD diagnosis (Schuster et al., 2015). This phenomenon has been estimated by a wide array of methodologies and differently defined populations, leading to a wide range of estimates. However, as of now, it has been estimated to be about 3 to 5 years (Ghosh & Lippa, 2015; Kansal et al., 2016). This delay leads to several consequences in clinical settings, including higher caregiver burden (Rasmussen, Hellzen, Stordal, & Enmarker, 2019), more so in the case of FTD where several family caregivers are still in the work force due to the earlier age where the disease is developed (Galvin et al., 2017), decreased patients’ and caregivers’ quality of life (Koskas et al., 2018), delayed interventions, as well as unnecessary interventions and investigations (Guimaraes et al., 2013; Schuster et al., 2015).
Several reasons may be at the origin of this delay. From a patients’ and caregivers’ point of view, lack of knowledge about symptoms of FTD and dementia (Devoy & Simpson, 2017; Rasmussen et al., 2019), fear and stigma regarding dementia diagnosis and inaccessible services are commonly reported (Devoy & Simpson, 2017). From a healthcare point of view, lack of knowledge about rarer dementia diagnoses (i.e. FTD) and their atypical presentations from general practitioner might lead to a late referral to memory clinic or neurology settings for diagnosis. Some healthcare settings may also suffer from the lack of technologies necessary to make the diagnosis (Guimaraes et al., 2013).
From a purely diagnostic point of view, previous diagnostic criteria (Mesulam, 2001; Neary et al., 1998) had mediocre sensitivity and specificity in detecting early presentation of FTD (Borroni et al., 2015; Rascovsky et al., 2011). While new criteria seem to present much better sensitivity and specificity (LaMarre et al., 2013), they are not perfect and still often miss early disease presentations (Borroni et al., 2015; Hogan et al., 2016). Borroni et al. (2015) in fact showed that in patients who developed bvFTD in an average of two years already presented a few symptoms at baseline (but not enough to fulfill core diagnostic
criteria) and already presented significant neuroimaging changes compared to controls. Further, current diagnostic criteria do not account for atypical presentation of FTD (e.g. memory impairment in the early course of the disease), which makes FTD diagnosis difficult to attribute when clinicians are presented which such situations and incurs frequent mislabeled diagnoses (LaMarre et al., 2013; Rascovsky et al., 2011). Patients also often present with psychiatric symptoms, which may be hard to differentiate from primary psychiatric diagnoses, or FTD mimics such as FTD phenocopy (Devenney et al., 2015). Further, lack of insight is often reported in patients, which complicate diagnosis and adds a degree of inference needed from the clinician (Hogan et al., 2016).
To counteract the caveats described above, biomarkers could lend aid to clinicians (both general practitioners and neurologists) by identifying concrete biological and pathological markers of degeneration at the earliest stage of the disease, regardless of the clinical presentation. This feat is hard to accomplish with the clinical population of FTD for the same reasons that lead to diagnostic delay. Particularly, recruitment on the basis of clinical diagnosis may induce a bias by excluding patients with atypical presentation as well as patients that do not completely fulfill diagnostic criteria but are in the prodromal phase of the disease (Borroni et al., 2015), and the patterns uncovered in each groups based on clinical diagnosis may not account for the underlying neuropathological process, which has been shown to be highly heterogenous even within the same clinical diagnoses (Mackenzie & Neumann, 2016). Neuropathological studies investigating patients’ pre-mortem and post-mortem status, from before disease onset to death, represent the gold standard to correctly associate clinical patterns seen in the life of the patients to the pathological processes observed in the brain. However, such studies are notoriously hard to conduct for numerous reasons, including the high cost of maintaining such studies until the death of patients, and obtaining enough patients that allow for brain donation to have meaningful sample sizes. This limit is even more significative in FTD, as it is a much rarer disorder than AD (Irwin et
al., 2018). Using retrospective clinical data might partially cover these flaws, but it comes with the cost of more missing data (Irwin et al., 2018). As such, other alternatives must be sought to be able to study biomarker changes in a reliable, easier and more economical way, including the study of pre-symptomatic carriers of mutations causing FTD.
0.4 –
Genetics of FTD
A few neurodegenerative diseases present an inherited form, where the disease is passed from parent to offspring. In the case of autosomal dominant disorders, parents may pass one copy a faulty gene to their children through conception. In cases where children carry this gene, they are at serious risk of developing the disease at a later age. Particularly in the case of diseases such as Huntington disease, penetrance of those mutations is complete, meaning that carriers of the faulty genetic mutation will develop the disease at a certain point in the future (Schuster et al., 2015). In the case of AD, contrarily to popular beliefs, the rate of autosomal dominant mutations is very low, at around 3% (Bateman et al., 2012). However, in the case of FTD, almost 30% of all cases are caused by autosomal dominant mutations (Rohrer & Warren, 2011). In fact, three genes seem responsible for most of those autosomal dominant FTD cases: microtubule associated protein tau (MAPT), granulin (GRN) and chromosome 9 open reading frame 72 (C9ORF72) (Pottier, Ravenscroft, Sanchez-Contreras, & Rademakers, 2016; R, C, & J, 2019; Rohrer et al., 2009). Further, these three categories of carriers seem to present specific mechanisms of disease. MAPT carriers seem to present identifiable tau pathology caused by phosphorylation of this protein within neurons (Bodea, Eckert, Ittner, Piguet, & Gotz, 2016; Olszewska, Lonergan, Fallon, & Lynch, 2016; Pottier et al., 2016; Sato et al., 2018). GRN usually present TDP-43 type A pathology at autopsy (Gan, Cookson, Petrucelli, & La Spada, 2018; Mackenzie & Neumann, 2016). Finally, most C9ORF72 present TDP-43 pathology as
well, but most predominantly of type B, although a number of cases seem to present type A or both types at autopsy. (Gan et al., 2018; Mackenzie & Neumann, 2016)
The population of pre-symptomatic carriers of mutations in the MAPT, GRN and C9ORF72 genes offer several advantages to study the development of FTD. From a purely logistic point of view, pre-symptomatic carriers are often still relatively young and still in the workforce; they are still in a relatively healthy state where they do not present cognitive and behavioral symptoms that could impact study participation. Further, from clinical experience, these participants often saw first degree relatives develop and succumb to the disease. As such, this population allow for limited attrition and maximum participation in study assessments due to health status and motivation (J. D. Rohrer et al., 2015; Schuster et al., 2015).
From a biological perspective this population is also ideal. Since autosomal dominant carriers will develop the disease in almost 100% of cases due to the disease’s high penetrance, participants can be followed several years before any symptoms are presented and allow to identify precisely what are the earliest biomarkers to change before disease onset. (Schuster et al., 2015) Further, since specific mutations are generally associated with specific brain pathologies, findings associated with MAPT mutation carriers could discern biomarker patterns specifically associated with tau pathology in the brain while findings associated with GRN mutations carriers could shed more light on biomarker patterns of TDP type A pathology, etc. (Mackenzie & Neumann, 2016) By discovering pathology-specific patterns of biomarkers pre-diagnosis, these patterns could be applied and validated to the sporadic FTD population to give concrete tools to clinicians and researchers to identify prodromal FTD, and, ultimately, reduce diagnostic delay.
It is important to note however, that one must be delicate when dealing with patients at risk of genetic FTD. Revealing the genetic status may have important impact in several spheres of the life of the patients, including access to insurance, medical care and
psychological well-being, particularly when included in the patient’s medical file. The utmost care must be given in studies including these participants to make sure access to genetic counselling may be available and that genetic status is not revealed inadvertently. (Roberts & Uhlmann, 2013)
0.5 – Existing biomarkers for FTD
As mentioned above, the pre-symptomatic carriers of autosomal dominant FTD represent the ideal population to study early changes occurring in FTD. However, the best tool to identify these disorders has yet to be identified.
A promising track for biomarkers in FTD is blood or CSF markers. By detecting specific protein levels’ alterations, a specific window into the pathological process of the disease can be opened. (L. H. Meeter, Kaat, Rohrer, & van Swieten, 2017; L. H. H. Meeter et al., 2018) CSF for one, has been shown in AD to be the first biomarker to decline in genetic pre-symptomatic participants. (Bateman et al., 2012) It is now used routinely in clinical settings to identify AD and differentiate AD patients from other potential pathologies. (L. H. Meeter et al., 2017) While several CSF markers are promising in FTD, there are currently none in the clinic that can identify FTD cases by themselves. Further, while the levels of the proteins can help track who has the disease and the progression of said disease, these markers do not allow for a comprehensive overview of the inside of the brain, i.e. the brain regions that are degenerated and their associated functions.
Neuropsychological tests also represent an important tool to identify dementia. After all, patients that are referred for clinical evaluation complain about cognitive impairment, and these complaints infer with their capacities to function in everyday living. (Gorno-Tempini et al., 2011; Rascovsky et al., 2011; Sellami et al., 2018) Social cognition in particular when considering FTD, is preferentially affected (Rankin, Kramer, Mychack, & Miller, 2003). However, even before a diagnosis is made, neuropsychological changes can be seen in
participants with autosomal dominant mutations. (Dopper et al., 2013; Hallam et al., 2014; J. D. Rohrer et al., 2015) While neuropsychological tests represent an important non-invasive tool, they are probably less sensitive to the very early changes seen in the brain of patients, as, theoretically, the cognitive changes result from the brain degeneration and its lack of ability to compensate for the decline in brain mass.
As of now, the most promising biomarker for genetic FTD is the use of neuroimaging. Brain imaging technologies are usually widely available in clinical settings worldwide. (World Health Organization, 2011) In Canadian clinical settings, guidelines have been set in place for the use of brain imaging technologies for the diagnosis of dementia (Gauthier et al., 2012) while the new diagnostic criteria for PPA and FTD require specific neuroimaging features to be present for a diagnosis of possible or probable PPA or FTD to be given (Gorno-Tempini et al., 2011; Rascovsky et al., 2011). Since these infrastructures are already in place in most clinical settings, it makes sense to investigate their use as potential pre-disease biomarkers. Furthermore, more so in the case of MRI, invasiveness and adverse effects of the procedures are null (compared to vein or lumbar puncture) (McMillan et al., 2014)
Considering the high proportion of cases with a genetic basis, the wide availability of imaging technologies worldwide, the wide use of imaging in diagnosing FTD, and the general non-invasiveness, using imaging in genetic mutation carriers may yield significant advancements in finding biomarkers indicative of FTD several years before symptom onset.
0.6 – Genetic carriers of FTD: Clinical and brain imaging
presentation
0.6.1 – GRN mutation carriers
0.6.1.1 – Symptomatic carriers: clinical and neuroimaging characteristics
Symptomatic carriers of GRN mutations tend to present a faster deterioration structural brain integrity than C9ORF72 or MAPT mutation carriers. More specifically, GRN carriers usually present a fronto-temporo-parietal pattern of atrophy. Within the frontal lobe,
studies report inferior frontal lobe (Fumagalli et al., 2018; Le Ber et al., 2008; Rohrer et al., 2010) as well as dorsolateral and ventromedial prefrontal cortex atrophy (Cash et al., 2018; Whitwell et al., 2015). General temporal lobe atrophy has been reported (Beck et al., 2008; Seelaar et al., 2011; Whitwell et al., 2012), with a focus on the superolateral temporal lobe (superior and middle temporal gyri) (Cash et al., 2018; Le Ber et al., 2008; Rohrer et al., 2010; Whitwell et al., 2015; Whitwell, Jack, Boeve, Senjem, Baker, Rademakers, et al., 2009). Parietal lobe atrophy is often reported (Beck et al., 2008; Fumagalli et al., 2018; Rohrer et al., 2010; Seelaar et al., 2011; Whitwell et al., 2015; Whitwell, Jack, Boeve, Senjem, Baker, Rademakers, et al., 2009; Whitwell et al., 2012), with the precuneus more specifically identified (Cash et al., 2018; Rohrer et al., 2010; Whitwell et al., 2015; Whitwell, Jack, Boeve, Senjem, Baker, Rademakers, et al., 2009). Other regions identified include the caudate nucleus (Cash et al., 2018; Premi et al., 2014), the insula (Cash et al., 2018; Fumagalli et al., 2018; Rohrer et al., 2010) and both the anterior (Cash et al., 2018; Fumagalli et al., 2018; Rohrer et al., 2010) and posterior (Whitwell et al., 2015; Whitwell, Jack, Boeve, Senjem, Baker, Rademakers, et al., 2009) cingulate gyri. Contrarily to other mutation groups, the cerebellum is usually spared in GRN carriers (Bocchetta et al., 2016). Finally, it is important to note that brain atrophy is usually highly asymmetric in GRN carriers compared to other mutation groups (Beck et al., 2008; Fumagalli et al., 2018; Le Ber et al., 2008; Rohrer et al., 2010; Whitwell, Jack, Boeve, Senjem, Baker, Rademakers, et al., 2009; Whitwell et al., 2012; Whitwell et al., 2013)
From a functional point of view, very few studies have been conducted on symptomatic GRN carriers but seem to somewhat reflect what is seen in MRI studies. SPECT studies describe a global pattern of blood flow reduction affecting the parietal, frontal, temporal and cingulate cortices. (Le Ber et al., 2008; Seelaar et al., 2011) The occipital lobe was also identified as affected in carriers in a single study. (Seelaar et al.,
2011) Suffice it to say that the small sample size and differing methodologies of both studies renders the generalization of functional brain anomalies to all GRN mutation carriers difficult.
0.6.1.2 – Pre-symptomatic carriers: clinical and neuroimaging characteristics
From a structural point of view, the fronto-tempo-parietal pattern of atrophy seems to be captured by MRI studies of pre-symptomatic participants (Alexander, Pisner, & Jacova, 2019; Cash et al., 2018; Jiskoot et al., 2019; J. D. Rohrer et al., 2015), as early as 10 to 11 years before expected onset in the case of temporal and parietal atrophy (Cash et al., 2018; J. D. Rohrer et al., 2015). Involvement of the insular cortex has, to date, been noted as the earliest change in the GRN mutation cohort, with one multi-center study identifying insular cortex atrophy as much as 15 years before expected onset of disease (J. D. Rohrer et al., 2015). Finally, involvement of the striatum has also been noted in pre-symptomatic carriers (Cash et al., 2018; J. D. Rohrer et al., 2015). However, several studies have noticed no structural changes in GRN pre-symptomatic carriers, both through visual inspection (Fumagalli et al., 2018; Jacova et al., 2013) and quantitative analyses (Alexander et al., 2019; Panman et al., 2019; Popuri et al., 2018). In the two studies reporting the estimated age of onset of pre-symptomatic participants (Jacova et al., 2013; Popuri et al., 2018), participants were at approximately 7 years before expected onset. This highlights the high variability between studies in terms of pre-symptomatic changes.
From a functional perspective, a few studies have looked at changes in GRN pre-symptomatic carriers. However, studies seem to mirror changes seen in structural imaging, with DTI imaging showing widespread reduced fractional anisotropy in the genu corpus callosum (Jiskoot et al., 2019), the anterior and superior corona radiata, the anterior thalamic radiation, the superior and inferior longitudinal fasciculus, the inferior fronto-occipital fasciculus and the anterior and posterior limb of the internal capsule (Dopper et al., 2013). Arterial spin labelling studies also found widespread reduction in blood flow throughout
frontal, parietal, sub-cortical (i.e. paracingulate gyrus, insula, thalamus) (Dopper et al., 2016; Mutsaerts et al., 2019) and occipital regions (Mutsaerts et al., 2019). One study conducted using FDG-PET showed a similar pattern of hypometabolism, where the frontal, temporal and occipital lobes showed hypometabolism, in addition to sub-cortical regions such as the insula and the caudate nucleus. This study also showed that the anterior-to-posterior ratio of hypometabolism was altered compared to non-carriers and carriers also had a lower left-right hypometabolism ratio than non-carriers. Interestingly, this study showed that these changes occurred at a mean of 7 years before expected onset and carriers did not show any visible atrophy on traditional structural imaging (Jacova et al., 2013).
0.6.2 – C9ORF72 mutation carriers
0.6.2.1 – Symptomatic carriers: clinical and neuroimaging characteristics
Carriers of C9ORF72 mutations are among the best studied in the literature, as they are often considered the most prevalent mutations causing FTD (Rohrer & Warren, 2011). Carriers of these mutations usually present relatively symmetric (Fumagalli et al., 2018; Mahoney et al., 2012; J. D. Rohrer et al., 2015; Whitwell et al., 2015; Whitwell et al., 2012), widespread patterns of atrophy (Fumagalli et al., 2018). Atrophy was seen in frontal (Cash et al., 2018; Floeter et al., 2016; Whitwell et al., 2012), temporal (Bocchetta, Iglesias, Cash, Warren, & Rohrer, 2019; Cash et al., 2018; Mahoney et al., 2012; Whitwell et al., 2012), parietal (Cash et al., 2018; Floeter et al., 2016; Fumagalli et al., 2018; Whitwell et al., 2012) and occipital regions (Whitwell et al., 2015; Whitwell et al., 2012). However, the most reported regions of atrophy are usually seen in the cerebellum (Bocchetta et al., 2016; Cash et al., 2018; Mahoney et al., 2012; Whitwell et al., 2015; Whitwell et al., 2012) and thalamus (Cash et al., 2018; Floeter et al., 2016; Mahoney et al., 2012). Interestingly, ventricular enlargement is also often reported in symptomatic patients (Floeter et al., 2016; Mahoney et al., 2012).
0.6.2.2 – Pre-symptomatic carriers: clinical and neuroimaging characteristics
Similar pattern of atrophy is seen in pre-symptomatic carriers of the C9ORF72 mutations. Particularly, the thalamus (Cash et al., 2018; Lee et al., 2017; Panman et al., 2019; Papma et al., 2017; Popuri et al., 2018; J. D. Rohrer et al., 2015) and the cerebellum (Cash et al., 2018; Panman et al., 2019; Papma et al., 2017; J. D. Rohrer et al., 2015). Still in line with observations from symptomatic patients, atrophy in the temporal (Cash et al., 2018; Lee et al., 2017; Panman et al., 2019; Papma et al., 2017; Popuri et al., 2018; J. D. Rohrer et al., 2015), frontal (Cash et al., 2018; Lee et al., 2017; Panman et al., 2019; Popuri et al., 2018; J. D. Rohrer et al., 2015), parietal (Cash et al., 2018; Lee et al., 2017; Panman et al., 2019; Papma et al., 2017; Popuri et al., 2018; J. D. Rohrer et al., 2015) and occipital lobes (Lee et al., 2017; Popuri et al., 2018). Other regions such as the anterior insula (Cash et al., 2018; Lee et al., 2017; J. D. Rohrer et al., 2015), the cingulate gyrus (Lee et al., 2017), striatum (Lee et al., 2017; Popuri et al., 2018). In studies measuring the expected age of onset before the disease, changes were observed as early as 25 years before expected onset (J. D. Rohrer et al., 2015). However, some studies were not able to observe any differences between asymptomatic carriers and non-carriers (Floeter et al., 2016; Fumagalli et al., 2018)
Few functional neuroimaging studies have been conducted on these carriers. FDG-PET study found that anterior regions and posterior regions presented significant hypometabolism compared to GRN carriers almost 10 years before the expected year of onset (Jacova et al., 2016). Widespread reduction in connectivity across brain networks was also observed (Lee et al., 2017). Finally, reduction in brain blood flow was also observed in several regions including the left mid-temporal gyrus, bilateral cingulate gyri, insula, orbitofrontal cortex and supramarginal and angular gyri. (Mutsaerts et al., 2019)
0.6.3 – MAPT mutation carriers
0.6.3.1 – Symptomatic carriers: clinical and neuroimaging characteristics
Symptomatic carriers of MAPT mutations tend to present a slower rate of global atrophy than GRN mutation carriers (Rohrer et al., 2010; Whitwell et al., 2015; Whitwell, Weigand, et al., 2011), which would suggest that carriers of MAPT have a slower disease progression and, conversely, could perhaps be identified earlier before the symptom onset than GRN carriers which usually appear to progress rapidly (Fumagalli et al., 2018; Rohrer et al., 2010; Whitwell et al., 2015; Whitwell, Weigand, et al., 2011).
Neuroimaging studies of symptomatic MAPT mutation carriers tend to show that patients present a symmetric atrophy pattern (J. D. Rohrer et al., 2015; Rohrer et al., 2010; Whitwell, Jack, Boeve, Senjem, Baker, Ivnik, et al., 2009; Whitwell et al., 2013), with a clear frontotemporal pattern of atrophy (Cash et al., 2018; Deters, Risacher, Farlow, Unverzagt, Kareken, Hutchins, Yoder, Murrell, et al., 2014; Seelaar et al., 2011; Whitwell et al., 2015; Whitwell, Jack, Boeve, Senjem, Baker, Ivnik, et al., 2009; Whitwell et al., 2013), a more targeted pattern than the widespread atrophy seen in GRN or C9ORF72 carriers (Cash et al., 2018; J. D. Rohrer et al., 2015). Studies investigating regions of interest within the frontal lobe have identified the orbitofrontal cortex as a structure presenting heightened atrophy (Cash et al., 2018; Rohrer et al., 2010). However, most studies identify the anterior and medial regions of the temporal lobe as the main regions of degeneration in these patients (Fumagalli et al., 2018; Panman et al., 2019; Rohrer et al., 2010; Seelaar et al., 2011; Whitwell et al., 2012), with the bilateral hippocampi, parahippocampal gyri and the amygdalas as the main structures atrophied. Other regions of degeneration include the insular cortex, common to the GRN and C9ORF72 mutation carriers, and the cerebellum, also common to C9ORF72 mutation carriers.
Functional neuroimaging studies are scarcer in symptomatic MAPT carriers’ patients but seem to mirror structural imaging studies’ frontotemporal pattern. Diffusion tensor
imaging studies for example exposed functional deficits in the uncinate fasciculus (Mahoney et al., 2014; Mahoney et al., 2015), which is corroborated by white matter structural studies (Rohrer et al., 2010). One study utilizing SPECT imaging found a pattern of hypoperfusion in the left temporal lobe and the left frontal gyrus, (Seelaar et al., 2011) in contradiction to the symmetric pattern of atrophy in these patients. Finally, one study using FDG-PET found a bilateral, symmetric pattern of hypometabolism in the medial temporal lobe (amygdala, hippocampus, etc.) of patients from a family known for multisystem atrophy carrying a MAPT mutation, (Deters, Risacher, Farlow, Unverzagt, Kareken, Hutchins, Yoder, Murrell, et al., 2014) consistent with the structural imaging studies.
0.6.3.2 – Pre-symptomatic carriers: clinical and neuroimaging characteristics
Interestingly, structural imaging studies investigating asymptomatic mutation carriers found a similar atrophy pattern several years before the expected onset of the disease. Specifically, atrophy in the medial temporal regions; the hippocampus (Cash et al., 2018; Deters, Risacher, Farlow, Unverzagt, Kareken, Hutchins, Yoder, Murrell, et al., 2014; Fumagalli et al., 2018; Miyoshi et al., 2010a; Panman et al., 2019; J. D. Rohrer et al., 2015) and the amygdala (Cash et al., 2018; Deters, Risacher, Farlow, Unverzagt, Kareken, Hutchins, Yoder, Murrell, et al., 2014; Fumagalli et al., 2018; J. D. Rohrer et al., 2015) are reported in most studies. Some atrophy in frontal lobe regions are also reported by a lesser number of studies (Cash et al., 2018; Deters, Risacher, Farlow, Unverzagt, Kareken, Hutchins, Yoder, Murrell, et al., 2014), as well as the insular cortex (Deters, Risacher, Farlow, Unverzagt, Kareken, Hutchins, Yoder, Murrell, et al., 2014; J. D. Rohrer et al., 2015). A lack of atrophy has also been reported in some asymptomatic patients (Whitwell, Josephs, et al., 2011), but the age of expected onset has not been reported. It is however hard to estimate how early those changes occur in pre-symptomatic mutation carriers as most studies do not estimate their expected age of onset. In MAPT carriers, only two studies have
reported the expected age of onset and the earliest changes observed. In J. D. Rohrer et al. (2015)’s first report of the GENFI study, the earliest changes reported in MAPT carriers was the atrophy of the hippocampus and the amygdala reported up to 15 years before the expected onset of disease. Further analyses using voxel-based morphometry in the GENFI study reported this consistent pattern of atrophy at 11 years before onset of the disease with concurrent atrophy in the orbitofrontal cortex. (Cash et al., 2018)
While functional imaging studies are scarce in symptomatic patients, they are more common in asymptomatic patients. In DTI studies, frontotemporal tracts appear to be preferentially affected (Dopper et al., 2013), particularly the uncinate fasciculus (Jiskoot et al., 2019; Panman et al., 2019). One study also found deficits in the left anterior thalamic radiation and the inferior fronto-occipital fasciculus. (Panman et al., 2019) Functional MRI studies have yielded conflicting results, ranging from no significant difference (Dopper et al., 2013) to a lessened connectivity in the default-mode network, in-phase connectivity in the lateral temporal lobe and in-phase connectivity in the medial prefrontal cortex, compared to a control group. (Whitwell, Josephs, et al., 2011) Two studies investigating ASL in pre-symptomatic patients also found conflicting results, ranging from no significant difference from controls (Dopper et al., 2016) to various hypoperfusion regions such the left mid temporal gyrus, the bilateral anterior cingulate gyri, the bilateral anterior insula and orbitofrontal gyri and the supramarginal and angular gyri (Mutsaerts et al., 2019). Very few studies investigated FDG-PET imaging patterns in asymptomatic patients. Two case reports presented conflicting results with one case not presenting any measurable alteration (He et al., 2018) while one case presented with temporal lobe hypometabolism, no observable MRI changes and no clinical symptoms, but subsequently developed FTLD. (Arvanitakis et al., 2007) To date, only one cohort study evaluated asymptomatic MAPT carriers using FDG-PET, in a single family known for multiple system atrophy. FDG-PET of asymptomatic mutation carriers in this family showed a medial temporal lobe pattern of hypometabolism,
to a lesser extent than symptomatic mutation carriers of the same family. Hypometabolism also showed considerable overlap with regions of atrophy in asymptomatic carriers. (Deters, Risacher, Farlow, Unverzagt, Kareken, Hutchins, Yoder, Murrell, et al., 2014)
0.7 – Current gaps in the literature
While the advances in the neuroimaging of pre-symptomatic mutation carriers have progressed in the past few years, several gaps remain. First, each imaging technique’s sensitivity and specificity for pre-symptomatic FTD mutation carriers have yet to be identified. MRI techniques and analyses are common and frequently investigated for their wide availability and ease to administer to patients. They have achieved relatively high accuracy in identifying different subtypes of FTD (McMillan et al., 2014). However, more and more studies seem to point to other imaging techniques as potential biomarkers, such as functional MRI, diffusion imaging and PET imaging (Schuster et al., 2015). Particularly in the case of PET imaging, it has been identified as the tool to detect very early changes in AD patients (Bateman et al., 2012) and is hypothesized to detect changes the earliest among other neurodegenerative disorders (Schuster et al., 2015). FDG-PET as already shown great sensitivity to identify disease-specific pathology (Bohnen, Djang, Herholz, Anzai, & Minoshima, 2012; Laforce et al., 2010; Schuster et al., 2015). In clinical settings, FDG-PET already show great usefulness in differentiating FTD from other clinical phenotypes (Bohnen et al., 2012; Brown et al., 2014; Foster et al., 2007; Laforce et al., 2015). When looking to other imaging techniques, FDG-PET seems to present higher sensitivity then arterial spin labelling (ASL) (Fallmar et al., 2017) and traditional MRI alone (Vijverberg et al., 2016) to detect dementia while FDG-PET present higher specificity and sensitivity compared to SPECT imaging (Davidson & O'Brien, 2014).
Another problem currently faced by researchers and clinicians in neuroscience is the lack of ability to translate findings from quantitative neuroimaging studies to concrete tools
for use by clinicians. Fundamentally, the clinic and research setting differ by several aspects. While researchers aim to find group differences between neurologically affected patients and controls, clinicians need to determine whether the single patient in front of them is affected by a specific disease. Researchers often use quantitative methods that are not readily available for clinicians who traditionally rely on visual observation to judge significant changes in neuroimaging. (Brown et al., 2014; Schleim & Roiser, 2009) Specifically, the manual segmentation process (i.e. determination of regions of interest) is highly time consuming and impossible to implement in a clinical setting for each individual patients due to the pace that patients are seen and to the lack of accessibility to segmentation software to non-initiated. (Nelson, Piper, Friedland, & Freeman, 2007) Some commercial software, such as MIMneuro software can alleviate this issue as it can automatically segment a patient’s brain imaging and compare it to a database of normal controls, allowing the generation of Z-score statistics which may be more sensitive to subtle changes than what would be possible through visual inspection alone. This also allows for individual scores to be generated for each patient for individual comparison, which is often not possible in group comparison studies where datapoints are often not given. (Schleim & Roiser, 2009)
In MAPT carriers, the best neuroimaging method to identify the earliest changes has yet to be identified. Currently, the estimates for the earliest changes in pre-symptomatic individuals comes from the study by J. D. Rohrer et al. (2015), where an estimated age of onset was calculated from the mean age of onset of symptomatic individuals within families. Although not a perfect estimate, the authors were able to determine that changes would occur almost 15 years before the expected age of onset in asymptomatic MAPT carriers using traditional MRI. However, other neuroimaging techniques such as FDG-PET might reveal earlier changes than MRI in MAPT carriers.
Neuroimaging using FDG-PET was studied in other genetic mutation carriers, indicating early metabolism changes in asymptomatic carriers of GRN and C9ORF72 mutations in the
absence of measurable atrophy at around seven years before expected onset. (Jacova et al., 2016; Jacova et al., 2013) As such, it can be hypothesized that FDG-PET may also identify measurable changes earlier than using other imaging techniques in MAPT carriers.
0.8 – Study objectives and hypotheses
Therefore, to cover the gaps in the neuroimaging characteristics of pre-symptomatic FTD, our study aimed to use clinically available tools to investigate pre-symptomatic MAPT mutation carriers compared to their unaffected family members. By using FDG-PET, this pilot study aimed to uncover neuroimaging characteristics associated with pre-symptomatic FTD using an automated segmentation and analysis software. Specifically, the objectives were to:
a) Compare quantitatively the patterns of glucose metabolism in the brain of pre-symptomatic MAPT carriers and non-carrier participants from a clinical perspective using FDG-PET
b) Compare qualitatively the patterns of glucose metabolism in the brain of pre-symptomatic MAPT carriers and non-carriers using individual FDG-PET Z-score and expert opinion
We hypothesized that:
a) Mutation carriers would significantly differ from non-carriers in term of hypometabolism, specifically in the medial temporal regions of the brain b) FDG uptake Z-scores from carriers will be significantly different from normal
subjects in the medial temporal regions of the brain, and visual inspection by an expert physician should not find any difference between groups
Chapter 1 – Methods
1.1 - Study participants
Participants included in this study (MAPT-PET sub-study) were recruited within the ongoing Genetic Frontotemporal Initiative (GENFI) study, Quebec City (Canada) site. Participants included in GENFI are at genetic risk of FTD due to a familial presence of an autosomal dominant mutation on the MAPT, GRN or C9ORF72 genes. In the MAPT-PET sub-study, we recruited 18 GENFI participants from 5 families known for a MAPT genetic mutation (P301L). Participants were seen three times by the site for the GENFI study, for a baseline and two follow-ups, one year apart. Procedures for the MAPT-PET sub-study were administered either at their first or second year of follow-up (see Figure 1 – Annex A). Included participants were to respect the inclusion and exclusion criteria of the GENFI study (J. D. Rohrer et al., 2015), and did not/were not 1) present any symptoms indicative of cognitive or behavioural decline indicative of early FTD or PPA (per Rascovsky (Rascovsky et al., 2011) and Gorno-Tempini (Gorno-Tempini et al., 2011) Criteria), 2) received radiation therapy or have participated in any research including radiation or 3) pregnant. The study was approved by the CHU de Québec-Université Laval research ethics board. Written informed consent was obtained from all subject before any study related procedures.
1.2 - Genetic status of participants
Subjects were screened for mutations on the MAPT gene and classified as carriers (MAPT+) or non-carriers (MAPT-). All carriers within the studied families were carriers of the P301L mutation. All throughout the GENFI study and this sub-study, participants and investigators were blinded to the genetic status of participants to avoid any biases. Genetic statuses of all participants were preserved by a genetic guardian external to the study site. Study data was anonymized by a study team external to the study site to preserve anonymity of the genetic statuses following data collection through communication with the genetic
counselor. Participants were presented with the option of receiving genetic counselling if they wanted to learn more about their own status.
1.3 - Measures and procedure
1.3.1 - Clinical and cognitive measures
During the GENFI study, participants undergo an interview to obtain demographic information and a complete medical history. Neurological examination is performed, which includes a physical exam and cognitive testing (i.e. MMSE). Blood samples were collected for genotyping purposes. A complete neuropsychological battery was administered including tests for attention, language, memory, executive functions and social cognition (see Table 1 – Annex B). Neuropsychiatric questionnaires are also administered to a study partner for each participant (see Table 2 – Annex C).
In the MAPT-PET sub-study, we also administered additional neuropsychiatric and cognitive tests to insure further that participants did not present cognitive and behavioural symptoms (see Table 3 – Annex D). Further, we administered the UPDRS-MDS scale to ensure that participants did not present parkinsonian symptoms, as it is a common presentation in patients carrying mutations on the MAPT gene. (Ikeda et al., 2019; Siuda, Fujioka, & Wszolek, 2014)
Finally, we also used an estimated age of onset calculated by the mean age of onset of family members who developed FTD. This data was gathered through the GENFI study (see J. D. Rohrer et al. (2015) for further details).
1.3.2 - Neuroimaging acquisition and segmentation
An FDG-PET/CT scan was administered to all participants at a maximum of 6 months prior or following the GENFI visit. Acquisition of imaging data was based on Jacova et al. (2013) and MIMNeuro software acquisition protocol for their normal subject database to insure for maximal comparability with both normal subjects from the database and to
previous studies of FDG-PET on autosomal dominant mutation carriers on the GRN gene. FDG-PET scanning was performed on a clinical tomograph. Subjects were asked to fast at least 6 hours prior to the scan. Plasma glucose levels were confirmed to be inferior to 180 mg/dL prior to scanning procedures. Patients were injected with 185MBq (total effective dose of 5mSv) of [18F]-2-fluoro-2-D-glucose intravenously and were then returned to a quiet dark room where they received instructions to remain awake, with eyes open for a duration of approximately 30 minutes. Patients then headed to the scan area where a thermoplastic mask was used to reduce motion as much as possible. A computed tomography (CT) scan was first executed to acquire the necessary data for attenuation correction. A PET scan of 30 minutes of duration was then undertaken for each subject. Reconstruction used Ordered Subset Expectation Maximization algorithm, and was corrected for attenuation, dead time, detector normalization and scatter.
FDG-PET and CT scan data were imported to the MIMNeuro software, version 6.6 (MIM Software Inc., 2016). MIMNeuro allows for a semi-automatic processing of PET scans and subsequent fusion to other imaging modalities (i.e. CT scan in this instance). It will first register individual PET and CT images to a standardized template space using linear and non-linear registration and will ask for human feedback to examine and correct the registration of the image. Following registration, MIM generates statistics for individual patients’ brain regions based on a probabilistic human atlas (i.e. percentage that a specific voxel examined belongs to a determined brain region compared to brain scans of the atlas), within the standardized template space, based on a subset of 10 healthy volunteers. (Nelson et al., 2007)
MIMNeuro can execute regional, voxel-based and cortical projection analyses when images are registered within the software. For this study, only region-based analyses were executed due to the more clinically applicable nature of the results. MIM generates its statistics based on its probabilistic atlas. Specifically, it measures whether a certain voxel
captured by the imaging procedure belongs to a pre-determined brain region in at least certain original scans of the atlas. To conserve an adequate specificity/sensitivity level, a 50% probability level was chosen for this study (Nelson et al., 2007). The specific brain regions examined were the amygdala, hippocampus, cerebellar hemisphere, medial temporal lobe, putamen, parahippocampal gyrus, caudate nuclei, posterior cingulate gyri, retrosplenial cortex and precuneus. The software calculates z-scores (i.e. number of standard deviations from the mean) for FDG uptake ratio in each pre-defined brain region. A zscore superior to 1.65 was considered as hypermetabolic while a zscore inferior to -1.65 was considered hypometabolic. These values are calculated from a set of normal controls, different from the controls constituting the atlas, provided with the software.
Healthy volunteers included in the MIM database were to meet eligibility criteria by an expert neurologist. Inclusion was determined by general good health, needed to be ambulatory and score within normal range of neuropsychiatric testing. Further, subjects could not present neurological (e.g. significant history of head trauma or stroke), psychiatric (e.g. drug or alcohol abuse or dependence), or other important health problems (e.g. cardiac, pulmonary, oncological). Medication affecting cerebral metabolism or previous radiation treatment in or near the head was also proscribed. All scans were subsequently verified by a radiologist to confirm normalcy and inclusion in the database. Our participants were subsequently screened for those criteria during the medical interview and did not present any symptoms that would have been cause for exclusion in the MIM database.
The final FDG-PET database provided by MIM included 43 individuals aged between 41 and 80 years of age (mean = 63.79; SD = 9.98). The breakdown into age ranges is as follows: between the ages of 40-49, 8 subjects between the ages of 50-59, 14 subjects between the ages of 60-69, 14 subjects between the ages of 70-79, and 1 subject between the ages of 80-89. The pons was chosen as the structure of normalization for the analyses. Individual participants were automatically matched to scans of individuals at ±20 years of
age. The software does allow for a restricted age matching (±5 years of age), but due to the young age of some of our subjects, the MIM database could not provide age-matched comparison for four of our participants.
1.3.4 - Visual analysis of FDG-PET images
The FDG-PET images were also analyzed by a nuclear physician with 9 years of experience in detecting neurodegenerative disorders, blind to the mutation status and the clinical information of participants but was made aware that participants’ images shown to him were from participants at risk of carrying a mutation causing FTD. The physician was given a forced choice where participants were either identified as having normal scans or abnormal scans.
1.4 - Statistical analyses
For all analyses, results were considered significant at a threshold of p > 0.05. For the first set of analyses, MAPT+ participants were compared to MAPT- participants on demographic, clinical and neuropsychological data using SPSS version 25 (IBM Corp., Released 2017). First, normality of each variable was verified through Shapiro-Wilk tests (Ghasemi & Zahediasl, 2012). T-Tests were used for continuous parametric data while Mann-Whitney tests were used for non-parametric continuous data. For categorical variables, chi-square tests were used. If the data violated chi-square assumption that less than 20% of the contingency cells have expected values <5, a Fisher’s exact test was used instead.
For the second set of analyses, MAPT+ participants were compared to MAPT- participants based on their brain imaging using MIMNeuro generated statistics. First, MIMNeuro generated a set of scores comparing FDG uptake in the brain of a specific subject compared to the software’s database for each of the participants of the study. Z-scores for each brain region are generated for the within-region FDG uptake in the left hemisphere, the
right hemisphere and both hemispheres combined. A percentage and standard difference score of FDG uptake differences between the left and right hemispheres are also generated for each brain region. These five scores were compared in all brain regions between MAPT+ and MAPT- participants. Shapiro-Wilks tests were conducted on all variable to verify for normality. T-test were used when the data was distributed normally, and Mann-Whitney U tests were used in the opposite case. Second, we qualitatively analyzed the Z-score generated by MIMNeuro for each MAPT+ and MAPT- participants to uncover potential tendencies and patterns. Finally, the visual interpretation by the physician of the FDG-PET was analyzed using sensitivity and specificity analyses. Since mutation carriers will develop the disease in all cases, the genetic status was used as the gold standard for comparison with the doctor’s visual interpretation. Sensitivity and specificity definitions used in this study are defined in figure 2 (Annex E).
Chapter 2 - Results
2.1 - Sample
Descriptive statistics and comparison between the demographic, clinical and neuropsychological variables are presented in Table 4 (Annex F). The sample for the MAPT Sub-study was composed of 18 participants (7 males). All our subjects had relatively high educational attainment, with a minimum of 11 years of education. Thirteen individuals had a first degree relative with a diagnosis of dementia. A total of 6 individuals were found to carry a P301L mutation on the MAPT gene. MAPT+ and MAPT- participants did not differ significantly on any demographic, clinical or neuropsychological variable, including gender, age, having a first degree relative with dementia, on the number of years before expected onset of dementia, on cognitive screening tests performance (i.e. MMSE, MoCA, DCQ indexes, FAB), on neuropsychiatric evaluation (i.e. FRS, MIRI, RSMS, CBI-R) or any neuropsychological tests performance. No participant was symptomatic as determined by the physical and neurological examination.
2.2 - Quantitative Brain Imaging
When studying all 18 participants (6 MAPT+ and 12 MAPT-), we obtained Z-scores from the whole normal MIM database without age-matched imposition. We used the z-scores from our participants for comparison in the analyses described below, where we compared z-scores from the MAPT+ to the MAPT- participants. No variables were revealed as normally distributed based on Shapiro-Wilks normality tests. Mann-Whitney U analyses did not reveal any significant differences between MAPT+ and MAPT- subjects’ Z-scores, indicating no discernable FDG uptake pattern differences.
We then restricted the analyses by matching our MAPT+ to MAPT- subjects according to the expected age of onset of the disease (±3 years; 6 MAPT+ and 6 MAPT-). No variables were normally distributed. Mann-Whitney U analyses did not reveal any
significant between MAPT+ and MAPT- subjects’ Z-scores, indicating no discernable FDG uptake pattern differences, despite the additional matching by years before expected onset. Finally, we used Z-scores restricted to age-matched controls (±5 years) from the MIM database, still normalized to the pons. Due to the young age of some of our participants, 2 MAPT+ and 2 MAPT- could not have Z-scores provided by MIM and were excluded from these sets of analyses. We compared Z-scores from the remaining 14 participants (4 MAPT+ and 10 MAPT-). Shapiro-Wilks tests revealed that only certain variables were normally distributed. Mann-Whitney U tests did not reveal any differences between groups on the non-parametric variables. The only significantly different result was a significant difference between MAPT+ (M= -0.20, SD= 0.77) and MAPT- (M= 0.53, SD= 0.45) groups on the putamen in both hemispheres (t(12) = 2.24, p = 0.45) and between MAPT+ (M= -0.11, SD= 0.55) and MAPT- (M= 0.54, SD= 0.42) in the right hemisphere (t(12) = 2.37, p = 0.35). However, it is important to note that the z-scores may not have attained significant clinical thresholds, as -1.65 is often used by clinicians analysing FDG-PET images.
2.3 - Qualitative analysis of individual scores
Table 5 (Annex G) presents Z-scores results from all MAPT+ and MAPT- participants for all regions of interest including the expected age of onset. Qualitative analyses refer here to the fact that we consider subjects individually based on their z-score and do not group them for the interpretation below. This is done in a clinical perspective, to better represent each individual. Hypometabolism Z-scores are by default considered significant within the MIM software at -1.65. Overall, when looking at the Z-scores of participants individually using the whole MIM database, 3 out of 6 several mutation carriers and 3 out of 12 non-carriers presented hypometabolism in the amygdala. One subject in particular, case 7ZIOG, found to be a carrier of the mutation at 12 years before the expected onset of the disease, presented hypometabolism in several brain regions including the hippocampus (both