Publisher’s version / Version de l'éditeur:
Journal of Microfabrication, Microlithography, and Micromachining, 5, 1, pp.
011005-1-011005-13, 2006-03-01
READ THESE TERMS AND CONDITIONS CAREFULLY BEFORE USING THIS WEBSITE. https://nrc-publications.canada.ca/eng/copyright
Vous avez des questions? Nous pouvons vous aider. Pour communiquer directement avec un auteur, consultez la première page de la revue dans laquelle son article a été publié afin de trouver ses coordonnées. Si vous n’arrivez pas à les repérer, communiquez avec nous à [email protected].
Questions? Contact the NRC Publications Archive team at
[email protected]. If you wish to email the authors directly, please see the first page of the publication for their contact information.
Archives des publications du CNRC
This publication could be one of several versions: author’s original, accepted manuscript or the publisher’s version. / La version de cette publication peut être l’une des suivantes : la version prépublication de l’auteur, la version acceptée du manuscrit ou la version de l’éditeur.
For the publisher’s version, please access the DOI link below./ Pour consulter la version de l’éditeur, utilisez le lien DOI ci-dessous.
https://doi.org/10.1117/1.2176729
Access and use of this website and the material on it are subject to the Terms and Conditions set forth at
Modeling and Optimization of the Hot Embossing Process for Micro
and Nanocomponent Fabrication
Worgull, M.; Heckele, M.; Hétu, J. F.; Kabanemi, K.
https://publications-cnrc.canada.ca/fra/droits
L’accès à ce site Web et l’utilisation de son contenu sont assujettis aux conditions présentées dans le site LISEZ CES CONDITIONS ATTENTIVEMENT AVANT D’UTILISER CE SITE WEB.
NRC Publications Record / Notice d'Archives des publications de CNRC:
https://nrc-publications.canada.ca/eng/view/object/?id=0ccc2015-3d62-4bc5-8836-f4bf92c7b874 https://publications-cnrc.canada.ca/fra/voir/objet/?id=0ccc2015-3d62-4bc5-8836-f4bf92c7b874Modeling and optimization of the hot embossing
process for micro- and nanocomponent
fabrication
M. Worgull M. Heckele Forschungszentrum Karlsruhe Institut für Mikrostrukturtechnik Postfach 36 40 76021 Karlsruhe, Germany E-mail: [email protected] J. F. Hétu K. K. KabanemiNational Research Council of Canada Industrial Materials Institute
1500 Montreal Rd. Ottowa, Ontario K1A 0R6 Canada
Abstract. Hot embossing and injection molding belong to the estab-lished plastic molding processes in microengineering. Based on experi-mental findings, a variety of microstructures have been replicated using these processes. However, with increasing requirements regarding the embossing surface, and the simultaneous decrease of the structure size down into the nanorange, increasing know-how is needed to adapt hot embossing to industrial standards. To reach this objective, a German-Canadian cooperation project has been launched to study hot emboss-ing theoretically by process simulation and experimentally. The present publication reports on the proceeding and present first results. © 2006
Society of Photo-Optical Instrumentation Engineers. 关DOI: 10.1117/1.2176729兴
Subject terms: hot embossing; injection molding; plastic molding; nanocomponents.
Paper NP-05 received Mar. 1, 2005; revised manuscript received Jul. 1, 2005; accepted for publication Sep. 1, 2005; published online Feb. 22, 2006.
1 Introduction
For the first time and independently of Ref. 1, embossing technology for replicating microstructures was applied by the Institute for Microstructure Technology of Forschung-szentrum Karlsruhe in the early 1990s as part of the LIGA process.2In the course of further development, hot emboss-ing has advanced to an independent process used apart from injection molding, injection embossing, and thermo-forming. All processes mentioned have specific advantages. Consequently, they hardly compete with, but complement, each other, thus covering a wide spectrum of replicated microstructures.3–5Above all, process selection depends on the geometry of the microstructures and the surface to be patterned.
Injection molding is one of the economically most effi-cient processes. It is characterized by short cycle times and a high degree of automation. Mold filling is based on the injection of a melt into a closed cavity. Due to the existing gate systems and long flow paths, high shear stresses are generated during filling. Injection-molded components therefore possess comparatively high inner stresses. As a result of the long flow paths, filling of the cavities with extreme aspect ratios and the manufacture of large-area thin-walled components are aggravated on the microscale. To counteract this effect, the microstructures are fabricated in the variothermal mode.6
Injection compression molding assumes the position be-tween injection molding and hot embossing, as it combines parts of both processes. Via a gap, a melt cake is injected into the tool. Then, the injection channel is sealed. The cavities are filled by a subsequent displacement- and force-controlled embossing process. Compared to injection mold-ing, flow paths are reduced, and the manufacture of
large-area thin-walled components is facilitated. One of the most popular examples is the manufacture of CDs. Cycle times in the order of a few seconds are state of the art.
Hot embossing is not based on an injection process, but uses semifinished products in the form of thin foils as the starting material for molding. The volume of the semifin-ished product is adapted to the surface area of the tool and height of the cavities. The advantage of the use of semifin-ished products is the homogeneous distribution of the melt directly over the complete surface area of the tool. Thus, cavities are filled with the shortest possible flow paths. A variothermal process conduct and small embossing rates result in comparatively small shear stresses, and hence, components with minimum stress. For this reason, hot em-bossing is predestined for large-area thin components and structures with extreme aspect ratios.7The modular design of a hot embossing facility ensures a relatively high degree of flexibility and short tool exchange times. It allows for the manufacture of a variety of structures from different materials. The process is suited for the fabrication of pro-totypes and small series.
Thermoforming also is an established process of plastic molding. One of the most popular examples is the manu-facture of PET bottles by blow molding. This process may also be used for replicating microstructures.8Its advantage consists in the possibility of patterning thinnest polymer foils 共about 2 m兲 that cannot be processed by previous methods. In contrast to the earlier methods, molding takes place in the entropy-elastic state of a polymer rather than in the molten state.
All processes mentioned are based on the use of thermo-plastic polymers as starting materials for the fabrication of microstructures. The only thing that differs is the type of material supply, which varies from granules to the use of semifinished products in the form of foils. Each process uses specific processing windows of the same polymer. 1537-1646/2006/$22.00 © 2006 SPIE
2 Hot Embossing 2.1 Process Steps
The hot embossing process is divided into four major steps: 1. heating of the semifinished product to molding
tem-perature
2. isothermal molding by embossing共displacement con-trolled and force concon-trolled兲
3. cooling of the molded part to demolding temperature, with the force being maintained
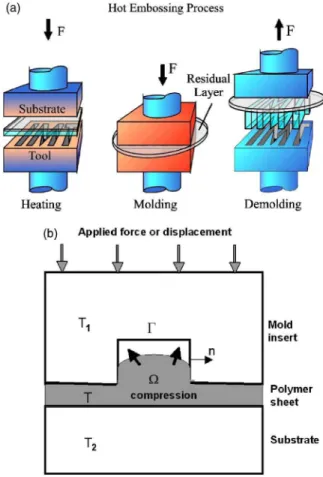
4. demolding of the component by opening the tool. One-sided embossing is represented schematically in Fig. 1.
Between the tool and substrate, a semifinished product, i.e., a polymer foil, is positioned. Thickness of the foil ex-ceeds the structural height of the tool. The surface area of the foil covers the structured part of the tool. The tool and substrate are heated to the polymer molding temperature under vacuum. When the constant molding temperature is reached, embossing starts. At a constant embossing rate共on the order of 1 mm/ min兲, tool and substrate are moved to-ward each other until the preset maximum embossing force is reached. Then, relative movement between the tool and substrate is controlled by the embossing force. The force is kept constant for an additional period共packing time,
hold-ing time兲, and the plastic material flows under constant force 共packing pressure兲. At the same time, tool and sub-strate move further toward each other, while the thickness of the residual layer decreases with packing time. During this molding process, temperature remains constant. This isothermal embossing under vacuum is required to com-pletely fill the cavities of the tool. Air inclusions or cooling during mold filling already may result in an incomplete molding of the microstructures, in particular at high aspect ratios. On the expiry of the packing time, cooling of the tool and substrate starts, while the embossing force is main-tained. Cooling is continued until the temperature of the molded part drops below the glass transition temperature or melting point of the plastic. When the demolding tempera-ture of the polymer is reached, the molded part is demolded from the tool by the opening movement, i.e., the relative movement between tool and substrate. Demolding only works in connection with an increased adhesion of the molded part on the substrate plate. Due to this adhesion, the demolding movement is transferred homogeneously and vertically to the molded part. Demolding is the most critical process step of hot embossing. Depending on the process parameters selected and the quality of the tool, demolding forces may vary by several factors. In extreme cases, demolding is no longer possible, and the structures are de-stroyed during demolding. Apart from the one-sided mold-ing described, the process is also used for double-sided positioned embossing. The principle of the process remains the same. However, instead of the substrate, another tool is applied. To demold the molded part from one of both tool halves, special demolding mechanisms, such as ejector pins or pressurized-air demolding, are used. For a better under-standing, the schematic representation of embossing in Fig. 1 is limited to the major process steps. Depending on the tool and polymer, the process and process parameters have to be adapted accordingly.
2.2 Process Parameters and Influencing Factors
In total, six groups of process parameters and factors influ-encing hot embossing can be distinguished. Process param-eters and influencing factors can be distinguished by defi-nition. Together, they influence the quality of the microstructured molded parts.9
Process parameters comprise those parameters that con-trol the conduct of the hot embossing process. They include the molding temperature, embossing rate, embossing force, packing time, demolding temperature, and demolding rate. Another group consists of material parameters. They largely determine the process parameters. From the mate-rial parameters, processing windows are obtained, from which the process parameters result.
The six process parameters and material parameters are complemented by a number of influencing factors. Four categories of influencing factors can be distinguished.
• Tool: Evenness of the tool is of particular importance to ensure homogeneous thickness of the molded part over the complete embossing surface. Depending on the type of tool patterning, surface quality may vary, which determines the forces needed for demolding. • Substrate: Like the tool, the substrate has to be
ex-tremely even over the complete surface area. Very
im-Fig. 1 共a兲 The hot embossing process: heating, molding, and
demolding are the characteristic process steps. The hot embossing process is characterized by a residual layer, which allows for easy handling of the molded part, and 共b兲 schematic view of the problem for mathematical description.
portant are favorable adhesion properties due to mi-crostructured surfaces共e.g., lapping of the surface兲. • Machine: Influences of hot embossing machines are
manifold. Heat- and force-induced strains and distor-tions, positioning accuracy of traverses, and the preci-sion of control have to be considered.
• Microstructures: The geometry, setup, and surface roughness of microstructures on the mold insert influ-ence the demolding behavior. In particular, the steep-ness of the flanks of the microstructures and the aspect ratios are decisive criteria of demoldability.
Material parameters, process parameters, and influencing factors influence the quality of the molded microstructures.
2.3 Quality of Molded Parts and Sources of Deformation
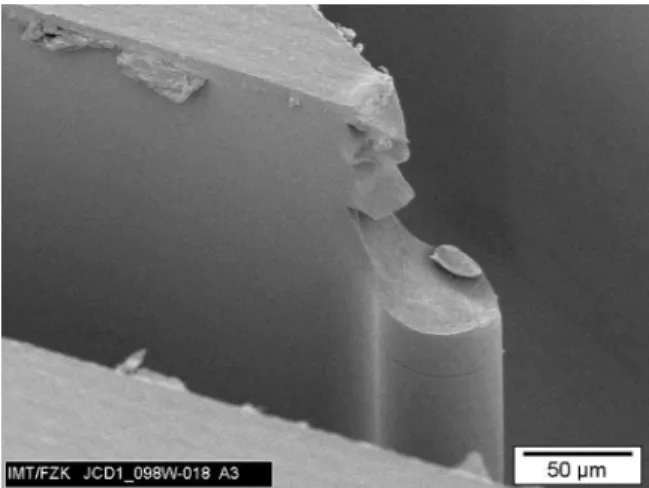
Due to the variety of tool designs and customer require-ments, the quality of molded parts has to be assessed indi-vidually. Irrespective of this, however, two criteria are of decisive importance, namely, contour accuracy and dimen-sional stability of the structures. Deviations from contour accuracy are defined by deformations that result from pro-cess control or mechanical defects of the tool, as illustrated in Figs. 2 and 3.
• Incomplete mold filling may be due to too little pres-sure or too small a temperature during embossing. In particular, structures with high aspect ratios and small cross sections may not be filled completely under cer-tain circumstances. Rounded edges of the microstruc-tures are characteristic of too little pressure.
• Sink marks are generated while cooling the molded parts. If the packing pressure is not sufficient to com-pensate temperature-induced shrinkage of the poly-mers, partial areas of increased shrinkage occur and detach from the tool wall.
• Distortions of microstructured or molded parts result from shrinkage differences in a molded part. Due to the pressure profile existing during embossing and the packing pressure phase, the peripheral areas of the molded part are subjected to less pressure. Shrinkage
is pressure-dependent, such that shrinkage differences occur, which result in a distortion of the molded part. • Overdrawn edges of structures are generated during demolding directly before the complete demolding of the structure. The shrinkage difference between poly-mer and tool results in forces that are directed to the center of the molded part. They may deform or de-stroy the upper edges of the microstructures.
• Overstretched and torn-off structures are also typical deformations caused during demolding. Due to fric-tion and the contact stress resulting from the shrinkage difference between tool and polymer, tension forces act on the structures during demolding, which cause structures or parts of the structures to be overstretched or torn off, depending on their cross section. Under-cuts drastically increase the risk of the structures being torn off.
3 Objective of the Project
So far, deformations have been reduced to a minimum by making use of the vast experience available. In the course of further development, however, there will be an increas-ing need for theoretically substantiated basic knowledge about the molding process.
Hot embossing may be analyzed theoretically by means of process simulation. Today, finite element method共FEM兲 simulation tools are state of the art in the field of plastic molding. However, no simulation tool exists that satisfac-torily reproduces the entire process chain of hot embossing. Complete FEM modeling of a typical LIGA mold insert using PC-based FEM systems is not yet possible due to excessively high computational resources required to per-form such analyses. Flow behavior of polymers during em-bossing has already been studied for a simple microstructure.10,11 However, not only the individual free-standing microstructure is of interest, but also the structural field, and the type of arrangement of the individual micro-structures. Modeling of structural fields allows statements to be made with respect to the arrangement and mutual influence of individual structures, and thus, a tool can be designed in advance.9,12,13
Fig. 2 Typical deformations of molded microstructures in the form of
overdrawn edges. This type of deformation is caused during demolding by shrinkage differences between tool and polymer.
Fig. 3 In filigree components, there is the risk of individual
struc-tures or structural parts being torn off. This form of deformation is also caused at the beginning of demolding.
The joint project covered here is aimed at analyzing the individual process steps of hot embossing, understanding related effects, and deriving improvement potentials from the findings obtained for simple structured tools. Theoreti-cal and practiTheoreti-cal analyses focus on the demolding process, as the risk of destroying microstructures is highest during this process step. Based on simulation models, parameter studies are performed, from which conclusions are drawn with respect to optimized process parameters, above all to reduce demolding forces.
The results of the simulation and accompanying experi-mental studies will pave the way for large-area embossing and the molding of nanostructures with high aspect ratios. These are requirements the hot embossing process will have to fulfill in the future.
4 Modeling and Simulation Tool
This section presents the mathematical model used for simulation of the decooling and demolding stages of the hot embossing process. First, we present the constitutive equa-tions describing the thermoviscoelastic relaxation behavior of the polymer during the cooling and demolding stages. Then, we present contact and friction formulation used to simulate friction during the demolding phase. Finally, nu-merical algorithms as well as simulation results are pre-sented.
4.1 Thermoviscoelastic Constitutive Equations
During the cooling of microstructures in the mold insert under an applied force, thermoviscoelastic stress calcula-tions are performed according to the model developed by Kabanemi and Crochet.7 We only briefly recall the basic assumptions of this model and refer the reader to the litera-ture cited earlier.
The setting of the problem is as follows. A viscoelastic body at temperature T occupies the domain ⍀, defined by the boundaries of the mold insert and the substrate, and is acted on by given forces, tractions, and thermal solicita-tions. A schematic view of the problem is shown in Fig. 1共b兲. We assume that a quasistatic process is valid. We further assume that during the hot embossing process, the polymer behaves as an isotropic thermorheologically simple material 共see Refs. 14–16兲 in such a manner that stress components are related to histories of strain compo-nents and temperature through appropriate relaxation func-tions. The latter are derived from isothermal relaxation functions by assuming time-temperature equivalence on the basis of the WLF17equation. Relaxation of the specific vol-ume is taken into account by introducing the concept of fictive temperature, i.e., the thermodynamic equilibrium temperature as a function of the polymer thermal history, introduced by Narayanaswamy.18The fictive temperature is calculated by introducing a volume relaxation function in the model. On that basis, one obtains the general form of the constitutive equations for thermorheologically simple materials.
Let us denote by s and sij the spherical and deviatoric components of the stress tensor, respectively, while e and
eij denote the spherical and deviatoric components of the strain tensor , respectively. For an isotropic material, we
use relaxation functions G1 and G2 in shear and dilatation,
respectively, together with a modified time scale. Hence, the stress-strain relation is expressed as:
sij共x,t兲 =
冕
−⬁ t G1共−⬘
兲eij共x,t⬘
兲 t⬘
dt⬘
, 共1兲 s共x,t兲 =冕
−⬁ t G2共−⬘
兲 t⬘
关e共x,t⬘
兲 − eth共x,t⬘
兲兴dt⬘
. 共2兲The thermal strain ethin Eq.共2兲 depends on the entire perature history of the material point and not on the tem-perature at time t alone. The modified time scale at a given point x共x , y , z兲 and at time t is given by
共x,t兲 =
冕
0
t
⌽关T共x,兲兴d. 共3兲
In Eq.共3兲, T is the temperature field and ⌽ the shift func-tion often characterized by the WLF equafunc-tion,18 written as follows
log ⌽ = c1共T − Tg兲 共c2+ T − Tg兲
, 共4兲
where c1and c2are material constants and Tris a reference temperature.
We wish to briefly comment on the relaxation functions
G1 and G2 in Eqs. 共1兲 and 共2兲. Let 2 and 3 denote the value of G1 and G2 at time t = 0, respectively. To simplify
the system of equations, we assume that
G1共t兲 = E
1 + v共t兲 = 2共t兲, 共5兲
G2共t兲 = E
1 − 2v共t兲 = 3共t兲, 共6兲
where both G1and G2depend on the same relaxation func-tion共t兲. In Eqs. 共5兲 and 共6兲 E and v are Young’s modulus and Poisson’s ratio, respectively, andandare the shear modulus and the modulus of hydrostatic compression, re-spectively. We further decompose below the function 共t兲 as a sum of m exponentials, i.e.,
共t兲 =
兺
r=1m
grexp共− t/r兲, 共7兲
in which r is relaxation times and gr material constants. The partial stress components sijr and sr associated with each relaxation timerare given by
sij=
兺
r=1 m grsij r , 共8兲s=
兺
r=1m
grsr. 共9兲
During the cooling stage, it is convenient to represent the nonequilibrium behavior of the polymer, or its structural 共volume兲 relaxation, in terms of two variables: the actual temperature T and a fictive or structural temperature Tf. We assume that, at initial time t0, the initial temperature Tf共x , t0兲 = T共x , t0兲 is above the glass transition temperature Tg, and that the specific volume v共t0兲 of the material is
given. Following Narayanaswamy,18 the specific volume
v共t兲 may be given by an integral equation of the type: eth共x,t兲 = 1 3 v共t兲 − v共t0兲 v共t0兲 =
冕
T共x,t0兲 Tf共x,t兲 ␣l共T⬘
兲dT⬘
+冕
Tf共x,t兲 T共x,t兲 ␣g共T⬘
兲dT⬘
, 共10兲 where ␣l and ␣g are the linear thermal expansion coeffi-cients in the liquid and glassy states, respectively.Finally, one needs a constitutive equation for the evolu-tion of the fictive temperature Tf, for which we use the following model Tf共x,t兲 = T共x,t兲 −
冕
0 t Mv共−⬘
兲 T共x,t⬘
兲 t⬘
dt⬘
, 共11兲where Mv is a volume relaxation function. In the liquid region, the relaxation is fast, and one obtains Tf共x , t兲 = T共x , t兲. On the other hand, when the material is quenched below the glass transition temperature from temperature
T共t = 0兲 = T0above Tg, the relaxation does not exist and one obtains Tf= T0. In this work, the same relaxation function is
used for both Mv and.
19
4.2 Contact and Friction Conditions
In the present formulation of the hot embossing process, it is assumed that the mold insert and the substrate behave as rigid bodies共see Fig. 1兲. We consider the case of an unilat-eral contact, which involves no penetration between the two bodies and is modeled with the Signorini conditions. We start our analysis by considering that a full contact zone ⌫is developed at the entire interface between the polymer sheet and the mold insert. The first condition to satisfy is the nonpenetration condition. Let n be the interior normal to the mold insert that depends on the node under consid-eration. That normal can easily be obtained once the mold insert geometry is defined. Under these hypotheses, the nonpenetration boundary conditions on ⌫ can be written as
un艋0, 共12兲
fn艋0, 共13兲
fn· un= 0. 共14兲
Here, unis the normal displacement at the interface and fn is the normal contact force. The first inequality, Eq. 共12兲, represents the kinematic condition of no penetration of the
contact surface. The second inequality, Eq. 共13兲, is the static condition of compressive or zero normal tractions. The third equation, Eq.共14兲, states that there is zero work done by the normal contact stress, i.e., the normal contact stresses exist only at the nodes where the polymer sheet is in contact with the rigid mold insert.
We model the frictional contact between the viscoelastic body and the mold insert with a Coulomb’s law of dry friction, written as
兩ft兩 ⬍s兩fn兩. 共15兲
Here, s is a static friction coefficient associated with the stick friction constraint and ft represents the tangential force on the contact boundary ⌫. This static version of Cou-lomb’s law states that the tangential shear cannot exceed the maximal frictional resistance. When the strict inequality 兩ft兩 ⬍s兩fn兩 holds the surface of the polymer, it adheres to the mold insert and is in the so-called stick state, and when the inequality兩ft兩 艌s兩fn兩 holds, there is relative sliding, the so-called slip state. Coulomb’s friction law is modified to include a dynamic friction coefficient d associated with the slip condition when the static constraint is violated. In that case, the inequality d艋s holds. It follows from the previous analysis that the interface mold/polymer is divided into three zones, which are not known a priori and are part of the problem: stick, slip, and no contact or gap.
We use the penalty method to enforce contact con-straints, and a regularization technique20,21 to obtain esti-mates for the normal contact force fn and the tangential frictional traction ftas follows
fn= − nun, 共16兲
ft= − tut, 共17兲
where n⬎0 and t⬎0 are normal and tangential penalty parameters, respectively. The result is a solution to the tact problem that allows small violations of the contact con-straints to estimate the direction and magnitude of the ac-tual tractions.
It is a well-known fact that shrinkage that occurs during solidification of a polymer in a mold causes a gap between the two bodies. A sharp temperature drop occurs across that gap as a result of the thermal contact resistance. Although the gap is known as the air gap, in many instances, there is probably no air in it. In our numerical simulation, the ther-mal conductivity of the gap medium is taken as that of air. It is clear that the gap at the mold/part interface will reduce the cooling rate and increase the cooling time of the part. The gap computed at the interface mold/part is used in heat transfer calculations. The heat flux across the interface can be expressed as
q= − kT
n = k
⌬共TP− Tm兲, 共18兲
where ⌬ is the gap distance, k is the thermal conductivity, and TP and Tmare polymer and mold insert temperatures, respectively.
With these assumptions, the mechanical problem of fric-tional contact of the viscoelastic body may be formulated as follows. Find a displacement vector u, and a stress field
, such that
ⵜ ·+ f = 0 in ⍀,
un艋0, fn艋0, fn· un= 0, on ⌫, with兩ft兩 ⬍s兩fn兩 Þ ut= 0,
兩ft兩 艌s兩fn兩 Þ $ t⬎0, such that ft= − tut.
4.3 Solution Procedure for the Contact Problem
The proposed approach to solve the contact problem makes use of the procedure developed by Brunet.21In that proce-dure, the decision on whether a contact node is releasing or is in sticking or sliding condition is based on the total and relative magnitudes of updated contact forces. The condi-tion is obtained as follows.
• If fn艌0, the point is assumed to have experienced tension release, and in this case the penalty parameters and the normal and tangential contact force are set to zero.
• If fn⬍0 and 兩ft兩 ⬍s兩fn兩, the node continues to stick and Eqs.共16兲 and 共17兲 give appropriate estimations to the normal force and frictional traction. Sticking con-tact conditions must be assumed by setting the penalty parameters to a large positive number.
• If fn⬍0 and 兩ft兩 艌s兩fn兩, then the state of the node must be updated to sliding with the consistent tangen-tial penalty parameter t=d兩fn兩 / 兩ut兩.
4.4 Numerical Results and Discussion
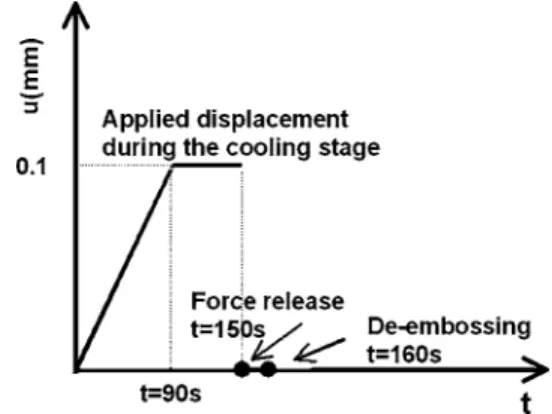
In this section, we apply the proposed method to the calcu-lation of residual stresses and deformations of a typical microstructure, whose geometry and dimensions are shown in Fig. 4. The initial residual layer before the application of the normal force is 500m. The processing conditions are shown in Fig. 5, where a displacement is applied stepwise at the bottom side of the contact body. The applied force is
suddenly removed at t = 150 s. The polymer used is a poly-methyl methacrylate 共PMMA兲 共BASF Lucryl G77Q11兲, whose master curve at 110 ° C is given later. The statics
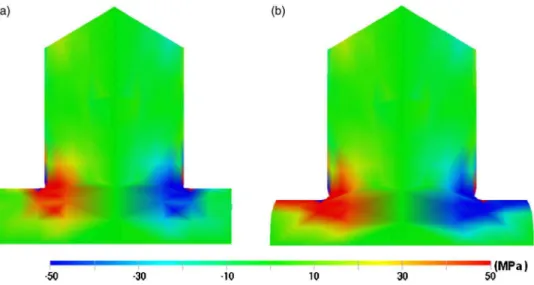
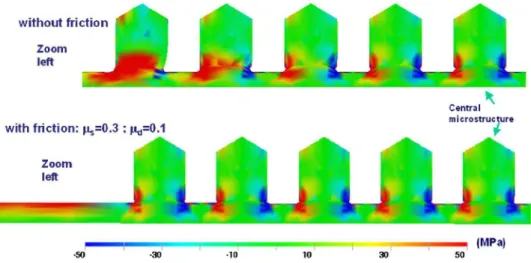
and dynamic d friction coefficients are 0.3 and 0.1, re-spectively. We have chosen a relaxation spectrum charac-terized by four relaxation times. To emphasize the effect of the applied force during cooling inside the mold insert, we first studied the behavior of a single microstructure during the embossing process. The shear stresses induced in the microstructure are shown in Fig. 6. High stresses are expe-rienced around the re-entrant corner. These results also highlight the effect of contact friction on the deformation of the residual layer, which exhibits a nonuniform deforma-tion when sliding occurs with fricdeforma-tion. In fact, the part is cooling inside the mold, it is still under compression, and competition exists between the thermal shrinkage that tends to create a gap and the mechanical deformations induced by the applied force that tend to press the polymer against the mold to create contact, resulting in high stresses around corners. We then analyze the stresses and deformations in-duced in multiple microstructures. The normal displace-ment fields over the thickness, after 90 s of cooling and just before de-embossing, are shown in Fig. 7. Since the applied force has been removed after 150 s, the rate of deformation changes sign, and each microstructure returns more or less toward its initial shape, which depends on the embossing time, embossing temperature, and embossing pressure along with the viscoelasticity of the material. These results show the incomplete creep recovery experienced by the mi-crostructures. The shear stress field after 90 s during cool-ing is shown in Fig. 8. These results correspond to the viscoelastic calculation with and without friction. As can be seen from these figures, microstructures in the central re-gion behave almost in the same way, while those localized near boundaries exhibit high shear stresses. We also ob-serve that residual stresses are localized around corners in all microstructures. These results have an incident on both the shape of microstructures and the quality of the replica-tion. Figure 9 shows the gap formation at the interface of the microstructures and the mold insert after 40 s of cool-ing under an applied force and just before de-embosscool-ing. Since the applied force has been removed after 150 s, we observe a reformation of a very thin gap layer 共about 3 m兲 before de-embossing due to the creep recovery of the material.
5 Viscoelastic Material Model 5.1 Creep Experiments
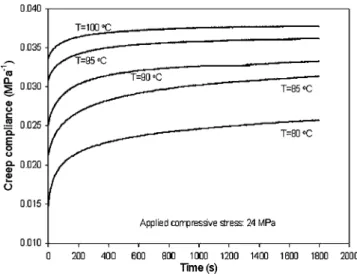
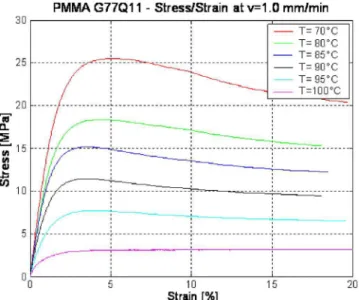
The mechanical behavior of the glassy PMMA acrylic M-30 was investigated as function of stress and tempera-ture by compression creep measurements in the vicinity of the glass transition temperature Tg, which is about 95° C. All the measurements were made on an Instron tensile tester. Thin flat samples of 10⫻ 10⫻ 3 mm were cut from the PMMA sheet obtained by injection molding. Samples were compressed in the thin direction at two stress levels, i.e., 5 and 24 MPa, and then maintained constant for up to 30 min at various temperature levels of 80, 85, 90, 95, and 100° C. Our motivation for this experimental investigation was to simulate the hot embossing process in a tensile tester machine, and at the same time characterize creep viscoelas-tic properties near Tgthat we believe, in conjunction with frictional contact between the polymer and the mold, may relate to the geometrical imperfection of embossed micro-structures. The compressive stress-strain curves at various
temperature levels are shown in Fig. 10. At temperatures below Tg, deviations from linearity appear sooner. The stress-strain behavior is linear up to a compressive stress of about 3 MPa, which corresponds to a deformation of about 7%. Above that compressive stress, the material exhibits a nonlinear behavior characterized by a sharp increase of the stress. On the other hand, slightly above the glass transition temperature, i.e., around 95 to 100° C, the stress-strain be-havior is linear up to roughly 5 MPa, corresponding to a deformation of about 40%, after which a sharp nonlinear increase of the stress is observed. We conclude from this finding that if the deformations in the embossing process of that PMMA are carried to a point where the viscoelastic behavior of the polymer becomes nonlinear, i.e., above 5 MPa at 100° C, then Eqs.共1兲 and 共2兲 no longer hold. The creep behavior at two stress levels and various temperatures are shown in Figs. 11 and 12. As can be seen from these time profile figures, the equilibrium compliance in com-pression creep is not reached after a holding time of
Fig. 6 Shear stresses in a cross section共t = 90 s兲 during cooling of a single microstructure under an applied force: 共a兲 without friction and 共b兲 with friction.
Fig. 7 Normal displacement field in a cross section at time t = 90 s during cooling under an applied force and just before de-embossing共t = 158 s兲, when the applied force is released.
30 min. A reasonable appropriate range of processing con-ditions, i.e., embossing pressure, embossing temperature, and embossing time, can be deduced from the previous measurements.
5.2 Relaxation Experiments
Using the dynamic mechanical analysis 共DMA兲, the temperature-dependent Young’s modulus of PMMA G77Q11 was determined in a defined frequency range, i.e., under a time-depending bending load. Due to the equiva-lence of time共here, frequency兲 and temperature that is valid for polymers, the individual measurement curves of the temperature-dependent Young’s modulus can be combined in a master curve by shifting along the time axis. The shift refers to a reference temperature, in our case, the glass temperature of Tg= 110° C. The shifts resulted in the temperature-dependent shift factors and the constants C1
and C2of the shift function. They are valid for the defined reference temperature only.
Based on a master curve and the corresponding shift function, Young’s modulus can be determined as a function of time and temperature. The shape of the relaxation time curve remains unchanged. It is only shifted along the time axis. The shift principle is the basis of the material model for simulating the demolding behavior.
The time-and temperature-dependent Young’s modulus is represented in Fig. 13. The shift function was interpo-lated to T ⬍ 100° C for the temperature range of demolding being also covered by the simulation.
From Fig. 14, the relaxation behavior of PMMA G77Q11 can be estimated in comparison with typical pro-cess times of a hot embossing propro-cess. A relaxation worth mentioning can be observed from a temperature of about 170° C. Within about 300 s, Young’s modulus relaxes by an order of 104Pa. With increasing temperature, relaxation
times further decrease. At 180° C, only 100 s are necessary, and at 200° C, only 10 s. In contrast to this, relaxation time increases extremely with decreasing temperatures. At 160° C, 1000 s are required; at 150° C, about 2.8 h. Figure 11 shows that below a temperature of about 170° C,
relax-ation times are too long for the stresses generated by mold-ing bemold-ing reduced largely. Moldmold-ing temperatures should therefore be at least 170° C or higher.
It is also evident from Fig. 14 that the master curve is not shifted linearly to the temperature. With decreasing temperature, the shift increases, which is due to the expo-nential behavior of the shift function. As a result, relaxation times do not increase linearly with smaller temperatures.
The measured time-temperature behavior of Young’s modulus was approximated using a generalized Maxwell model with ten parameters according to Eq.共19兲.
E共t兲 =
兺
i=1 n Ei· exp冉
t i冊
. 共19兲Figure 15 shows the master curve measured at 110° C and the approximation solution by the Maxwell model. The de-scription of the measurement curve with a ten-element model shows good agreement over 12 orders of magnitude.
5.3 Strength of the Material During Demolding
The temperature-dependent stress-strain characteristics were determined to derive the plastic deformation of struc-tures, in particular the deformation resulting from demold-ing. For this purpose, tension rods were produced by hot embossing according to DIN EN ISO 527-2, with a view to obtain process-specific material properties of the tension rod. The tensile tests were carried out using a universal test machine of the type Instron 4505 in the temperature range typical of demolding from 60 to 100° C. Apart from the temperature, typical demolding rates were considered by the tension rate being varied in the range of 0.5 to 10 mm/ min. Based on the tension curves obtained, the yield stress was defined as the first stress value, at which strain is increased without increasing stress. The cor-responding yield strain was in the range of about 4% for all temperatures studied. Figures 15 and 16 show the curves measured at typical demolding rates in the temperature range of 60 to 100° C.
5.4 Measurement of Friction Behavior
The problem of demolding microstructures gains impor-tance with the increasing size of the embossing surface and smaller structures. Thus, central task of the project de-scribed here is the development of a measurement method by means of which static and dynamic friction can be de-termined during demolding under typical hot embossing conditions. Static and dynamic friction forces in micro-structured tools, however, can only be measured as the sum in the form of demolding forces. Detailed analysis fails, as it is impossible to determine the normal forces acting on the individual sidewalls of the structured tool, which largely depend on the shrinkage of the component, and thus, on a multitude of process parameters and influencing factors.
Moreover, force measurement systems of high spatial reso-lution, which might be integrated in the microstructured tool, are lacking. For this reason, static and dynamic fric-tion forces were measured using a macroscopic measure-ment system. The approach to determining friction coeffi-cients according to DIN/ISO is not suitable, as the boundary conditions defined in these standards do not re-flect those of the hot embossing process. Within the frame-work of the project described here, a measurement process has been developed that includes an embossing process prior to the measurement of static and dynamic friction forces. Apart from the surface roughness of the specimen and the defined adjustable normal force, the influence of the process parameters of hot embossing, i.e., embossing pres-sure, embossing temperature, demolding temperature, and demolding rate, on the demolding force is considered共Fig. 17兲.
As far as material and surface roughness are concerned, the specimens used represent typical values of microstruc-tured tools. Both the surface roughness of tools produced
Fig. 9 共a兲 Gap formation during cooling under an applied force at
t = 40 s and 共b兲 gap reformation just before de-embossing at t = 158 s.
Fig. 10 Stress-strain curves at various temperature levels in
com-pression tests for the PMMA Acrylic M-30.
Fig. 11 Creep compliance curves at various temperature levels in
compression tests for the PMMA Acrylic M3-0. The applied com-pressive stress is 5 MPa.
by electroplating and those of tools manufactured by mi-cromechanical processes are considered. The advantage of this measurement method is that the history of the plastic, namely, the embossing process, is taken into account. Fur-thermore, the individual parameters influencing the demolding force can be assessed systematically.
Two characteristic measurement curves of the high num-ber of measurements are shown in Fig. 18. The breaking away of the structures at the beginning of demolding is of decisive importance to demolding the microstructures, as the highest forces are encountered at this moment. This point is specified by static friction. In contrast to dynamic friction, static friction is defined clearly by the peak of the measurement curve. After the plastic has broken away from
Fig. 12 Creep compliance curves at various temperature levels in
compression tests for the PMMA Acrylic M-30. The applied com-pressive stress is 24 MPa.
Fig. 13 Time- and temperature-dependent Young’s modulus measured for PMMA Lucryl G77Q11. The decrease in Young’s modulus is
attributed to relaxation processes. From a temperature of about 170° C, the relaxation times are in the range of typical process times. Above this temperature, stress reduction by relaxation processes has to be expected in embossed components. Below the temperature of 170° C, relaxation times exceed typical process times. Therefore, stresses in the molded part are reduced to a far smaller degree.
Fig. 14 Approximation of the time-temperature behavior of Young’s
modulus by a generalized Maxwell model with ten elements. Over a time range of 12 orders of magnitude, good agreement is reached between measurement and model.
the tool, further demolding is characterized by sliding along the vertical sidewalls. Dynamic friction is reflected by the slip-stick effect, as evident from Fig. 16. The results ob-tained in the form of static and dynamic friction coeffi-cients are used for the modeling of hot embossing.
6 Microstructure/Nanostructure Interface
Simulation of the hot embossing process is not only based on existing microstructures, but considers also the future applications of nanotechnology. It is therefore necessary to
Fig. 15 Stress-strain curves measured as a function of temperature
at a constant tension rate of 1 mm/ min. The strength of the plastic decreases drastically with increasing temperature. For defect-free demolding, an adapted demolding temperature has to be selected, which is as close as possible to the glass transition temperature, but ensures sufficient strength to prevent the component from being destroyed.
Fig. 16 Stress-strain curves measured as a function of the tension
rate at a constant temperature of 90° C. The strength of the plastic is increased with increasing tension rate due to the viscoelastic behavior.
Fig. 17 Test arrangement to determine adhesion and friction under
typical hot embossing conditions. The test arrangement can be used in a tension machine. The advantage of the arrangement is an inte-grated molding cycle before the measurement of friction is started.
Fig. 18 Friction force measured between the molded polymer and a
brass and a copper surface. Because of the integrated molding cycle, static and dynamic friction force can be measured under typi-cal demolding conditions. With the measurement arrangement, fric-tion coefficients can be calculated for different material combinations.
extend simulation to also cover structural sizes in the range between nanostructures and microstructures.
The border between nanostructures and microstructures is not defined unambiguously. Nanostructures produced by nanoimprinting normally do not possess any extreme aspect ratios. The aspect ratio is on the order of 1. In contrast to this, microstructures with extreme aspect ratios in excess of 50 may be produced by certain fabrication methods. Repli-cation of such structures requires a high degree of under-standing of the process. Between both structural dimen-sions, nanostructures with relatively small aspect ratios and microstructures that can be replicated with high aspect ra-tios, there is a gap. This is the range of the so-called sub-microstructures, i.e., structures in the range of 艋1m with an aspect ratio far beyond 1. In this range, a number of applications can be found, for example, micro-/nanofluidics and photonic crystals.
The project presented here is aimed at producing and simulating the replication of submicrostructures. When pro-ducing submicrostructures, replication by hot embossing has the advantages of short flow paths, resulting low-stress components, and the possibility of producing large-area structured fields. In the course of the project, submicro-structures with varying aspect ratios were produced and replicated by hot embossing.
6.1 Manufacture of Submicrostructures
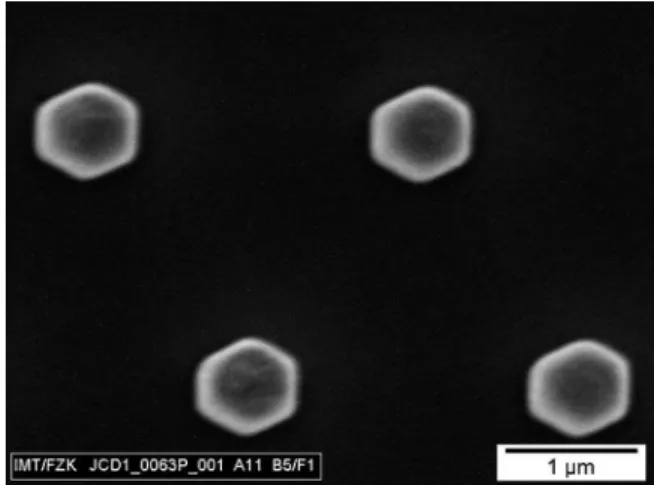
To demonstrate the molding of submicrostructures, honey-comb structures were exposed in a 2-m-high resist by electron-beam lithography. The fields structured were 100 ⫻100m2in size. The individual fields contained
honey-comb structures with varying distances and widths across flats, such that the spectrum of aspect ratios ranged from about 1 to 4. From the exposed resist, a 4-in. Ni shim molding tool was produced by electroplating共Figs. 19 and 20兲.
Replication in plastic represents a challenge, as the in-fluence of plastic shrinkage in relation to the structure height increases during cooling and demolding. Due to the filigree structures, the risk of destroying the structures dur-ing demolddur-ing increases as well, especially for large-area
structured fields. To minimize shrinkage, design measure such as a holding unit of the Ni shim tool, as well as the integration of auxiliary structures, are feasible. Auxiliary structures in particular reduce shrinkage and protect the fili-gree submicrostructures against high transverse forces that may cause defects of these structures during demolding. Filling of the microcavities is ensured by the vacuum and an appropriate process conduct. Incomplete filling of the mold was not observed. The demolding forces measured are ⬍4 N for the complete structured surface. As a rule, the structures were demolded without destruction, although the influence of shrinkage could not be eliminated completely. This was particularly obvious for structures with a small width across flat and a large web width. Here, shrinkage was found to be on the order of the structure 共about 0.5m兲, such that sheared edges occurred.
Structures with an aspect ratio of about 3.5 were molded at a web width of the honeycomb structures of about 0.6m共Figs. 21 and 22兲.
While the structured embossing surface area of 100 ⫻100m2was very small, a far larger field was structured
in a second step to analyze the influence of the structured surface area on the demolding behavior. This design is
Fig. 19 Detail of a nanostructured nickel shim mold. The mold is
fabricated by E-beam lithography and electroplating. The structure height is 2m, the gap is in the range of 0.6m.
Fig. 20 Detail of a nanostructured nickel shim mold with
honey-comb structures. The structure height is 2m and the diameter of the structures is in the range of 0.5m.
modeled in parallel by the National Research Council of Canada and serves as a basis of simulations, the results of which will be compared with the experimental results.
7 Conclusion
To meet future requirements in terms of an increasing em-bossing surface area and a simultaneously decreasing struc-ture size, a German-Canadian cooperation project has been initiated between Forschungszentrum Karlsruhe共FZK兲 and the National Research Council Canada共NRC兲 to systemati-cally analyze the hot embossing process for the replication of microstructures. Using selected microstructured tools, the process is modeled, and the simulation results are com-pared with practical experiments.
For simulation, a typical representative of a thermoplas-tic material is analyzed in detail by NRC with respect to its behavior during molding. Based on this analysis, a vis-coelastic material model is developed. Moreover, the influ-ence of adhesion and friction is accounted for when simu-lating the demolding behavior. Systematic measurement of adhesion and friction coefficients under typical process conditions is another major part of the project. In addition to the analysis of hot embossing for classical microstruc-tures, particular attention is paid to the range between nano-structures and micronano-structures. In this range of so-called submicrostructures with high aspect ratios, tools are pro-duced by electron-beam lithography and electroplating. On this basis, simulations and experiments will be performed.
Acknowledgment
This work has been funded by the NRC-Helmholtz Science and Technology Fund and the German Ministry of Educa-tion and Research, BMBF共project 01SF0201/7兲.
References
1. M. T. Gale, J. Kane, and K. Knop, “ZOD images: Embossable surface-relief structures for color and black-and-White reproduction,”
J. Appl. Photogr. Eng. 4, 41共1978兲.
2. A. Michel, R. Ruprecht, M. Harmening, and W. Bacher, “Abformung von mikrostrukturen auf prozessierten wafern” KfK Bericht 5171, Dissertation A. Michel, Universität Karlsruhe, Institut für Mikros-trukturtechnik共1993兲.
3. T. Hanemann, M. Heckele, and V. Piotter, “Current status of micro-molding technology,” Polym. News 25, 224–229共2000兲.
4. M. Heckele and W. K. Schomburg, “Review on micro molding of thermoplastic polymers,” J. Micromech. Microeng. 14, R1–R14 共2004兲.
5. M. Heckele, W. Bacher, T. Hanemann, and H. Ulrich, “Hot emboss-ing and injection moldemboss-ing for microoptical components,” Proc. SPIE
3135, 24–29共1997兲.
6. T. Benzler, V. Piotter, T. Hanemann, K. Mueller, P. Norajitra, R. Ruprecht, and J. Hausselt, “Innovations in molding technologies for microfabrication,” Proc. SPIE 3874, 53–60共1999兲.
7. K. K. Kabanemi and M. J. Crochet, “Thermoviscoelastic calculation of residual stresses and residual shapes of injection molded parts,”
Int. Polym. Process. 1, 60共1992兲.
8. R. Truckenmüller, “Herstellung dreidimensionaler mikrostrukturen aus polymermembranen,” Dissertation R. Truckenmüller, Universität Karlsruhe, Institut für Mikrostrukturtechnik共2002兲.
9. M. Worgull, M. Heckele, and W. K. Schomburg, “Analysis of the micro hot embossing process,” Forschungszentrum Karlsruhe, FZKA-Bericht 6922.
10. Y. Juang, L. J. Lee, and K. W. Koelling, “Hot embossing in micro-fabrication. Part 1: Experimental,” Polym. Eng. Sci. 42共3兲, 539–550 共2002兲.
11. Y. Juang, L. J. Lee, and K. W. Koelling, “Hot embossing in micro-fabrication. Part 2: Rheological characterization and process analy-sis,” Polym. Eng. Sci. 42共3兲, 551–556 共2002兲.
12. M. Worgull and M. Heckele, “New aspects of simulation in hot em-bossing,” Microsyst. Technol. 10, 432–437共2004兲.
13. M. Worgull, M. Heckele, and W. Schomburg, “Large scale hot em-bossing,” DTIP Conf. 2004, Montreux.
14. A. I. Isayev, Injection and Compression Molding Fundamentals, Marcel Dekker, New York共1987兲.
15. L. C. E. Struik, Internal Stresses, Dimensional Instabilities and
Mo-lecular Orientations in Plastics, Wiley and Sons, New York共1990兲.
16. J. D. Ferry, Mechanical Properties of Polymers, 2nd ed., Wiley and Sons, New York共1970兲.
17. M. L. Williams, R. F. Landel, and J. D. Ferry, J. Am. Chem. Soc. 77, 3701共1955兲.
18. O. S. Narayanaswamy, “A model of structural relaxation in glass,” J.
Am. Ceram. Soc. 54, 491共1971兲.
19. A. J. Kovacs, “La contraction isotherme du volume des polymères amorphes,” J. Polym. Sci. 30, 131共1958兲.
20. G. Kloosterman, “Contact methods in finite element simulations,” PhD thesis, Univ. of Twente共2002兲.
21. M. Brunet, Numiform’92 Proc. Chenot, Wood, and Zienkiewicz, Eds., Balkema, Rotterdam, 1992.
Biographies and photographs of authors not available.
Fig. 22 Detail of a nanostructured molded part with an aspect ratio
of 3.5. The design of this honeycomb structure in the nanorange is also used for a verification of the simulation results.