Publisher’s version / Version de l'éditeur:
Vous avez des questions? Nous pouvons vous aider. Pour communiquer directement avec un auteur, consultez la
première page de la revue dans laquelle son article a été publié afin de trouver ses coordonnées. Si vous n’arrivez pas à les repérer, communiquez avec nous à PublicationsArchive-ArchivesPublications@nrc-cnrc.gc.ca.
Questions? Contact the NRC Publications Archive team at
PublicationsArchive-ArchivesPublications@nrc-cnrc.gc.ca. If you wish to email the authors directly, please see the first page of the publication for their contact information.
https://publications-cnrc.canada.ca/fra/droits
L’accès à ce site Web et l’utilisation de son contenu sont assujettis aux conditions présentées dans le site LISEZ CES CONDITIONS ATTENTIVEMENT AVANT D’UTILISER CE SITE WEB.
ICBEST 2010: International Conference on Building Envelope Systems and Technologies: 27 June 2010, Vancouver, B.C. [Proceedings], pp. 369-377, 2010-06-27
READ THESE TERMS AND CONDITIONS CAREFULLY BEFORE USING THIS WEBSITE. https://nrc-publications.canada.ca/eng/copyright
NRC Publications Archive Record / Notice des Archives des publications du CNRC :
https://nrc-publications.canada.ca/eng/view/object/?id=29b7c90e-8f66-4712-8c02-48d5c28c668a https://publications-cnrc.canada.ca/fra/voir/objet/?id=29b7c90e-8f66-4712-8c02-48d5c28c668a
NRC Publications Archive
Archives des publications du CNRC
This publication could be one of several versions: author’s original, accepted manuscript or the publisher’s version. / La version de cette publication peut être l’une des suivantes : la version prépublication de l’auteur, la version acceptée du manuscrit ou la version de l’éditeur.
Access and use of this website and the material on it are subject to the Terms and Conditions set forth at
Benchmarking of hygrothermal model against measurements of drying of full-scale wall assemblies
http://www.nrc-cnrc.gc.ca/irc
Be nc hm a rk ing of hygrot he rm a l m ode l a ga inst m e a sure m e nt s of drying of full-sc a le w a ll a sse m blie s
N R C C - 5 3 5 7 3
S a b e r , H . H . ; M a r e f , W ; L a c a s s e , M . A . ; S w i n t o n , M . C . ; K u m u r a n , M . K .
J u n e 2 0 1 0
A version of this document is published in / Une version de ce document se trouve dans: ICBEST 2010 - International Conference on Building Envelope Systems and Technologies, Vancouver, B.C. June 27-30, 2010, pp. 369-377.
The material in this document is covered by the provisions of the Copyright Act, by Canadian laws, policies, regulations and international agreements. Such provisions serve to identify the information source and, in specific instances, to prohibit reproduction of materials without written permission. For more information visit http://laws.justice.gc.ca/en/showtdm/cs/C-42
Les renseignements dans ce document sont protégés par la Loi sur le droit d'auteur, par les lois, les politiques et les règlements du Canada et des accords internationaux. Ces dispositions permettent d'identifier la source de l'information et, dans certains cas, d'interdire la copie de documents sans permission écrite. Pour obtenir de plus amples renseignements : http://lois.justice.gc.ca/fr/showtdm/cs/C-42
Page 1 of 14
BENCHMARKING OF HYGROTHERMAL MODEL AGAINST
MEASUREMENTS OF DRYING OF FULL-SCALE WALL
ASSEMBLIES
Hamed H. Saber, Wahid Maref, Michael A. Lacasse,
Michael C. Swinton and Kumar Kumaran
Heat and Moisture Performance of Envelopes,
Building Envelope and Structure Program
National Research Council Canada, Institute for Research in Construction
(NRC-IRC)
Bldg. M-24, 1200 Montreal Road, Ottawa, Ontario, Canada K1A 0R6
http://irc.nrc-cnrc.gc.ca/irccontents.html
ABSTRACT
This paper describes the benchmarking exercise for the present hygrothermal model called “hygIRC-C” against the hygIRC-2D model that was previously developed at NRC-IRC and test results of laboratory measurements of drying of four full-scale wall assemblies. The wall assemblies were representative of the North American wood frame construction. These walls were subjected to different exterior and interior conditions and varying initial moisture content of OSB sheathing board components. The present hygrothermal model was recently developed at NRC-IRC. This model solves the highly nonlinear and coupled Heat, Air and Moisture (HAM) transport equations. The results showed that the overall agreements between the present model and the hygIRC-2D model as well as the experimental measurements were reasonably good in terms of the shapes of the drying and drying rate curves. Additionally, the predicted average moisture content of the different wall assemblies over the test periods were in good agreement, all being within +5% of those measured.
1. INTRODUCTION
The hygrothermal response of a building envelope system is directly affected by the exterior and interior conditions that exist on either side of the envelope, and likewise the hygrothermal properties of the components of which the envelope is comprised. Pertinent information on the benchmarking of hygrothermal models that assess the performance of wall assemblies was obtained through laboratory measurements. Generally, the task of validating hygrothermal models is both difficult and time-consuming without appropriate tools from which, at least, an overall assessment of the degree to which the models reproduce the experimental results can rapidly be ascertained.
The work carried out during the IEA Annex 24 [1] focused on using inter-model comparison as one of three possible means identified to provide validation of numerical models; the other two being analytical and empirical verifications. The analytical verification was recognised as being
Page 2 of 14
useful for testing algorithms. The empirical verification was only tried for limited applications. Because of the difficulties in obtaining detailed experimental data, verifications were restricted to summing up mass quantities such as total moisture content and amounts of condensed moisture, and thermal values such as heat fluxes and total energy flow. It was however suggested that more rigorous validation through well-controlled experimentation should form the basis for future work in this area.
Maref et al. [2, 3, 4, 5 and 6] reported their mid-scale and full-scale experimental work that helped to benchmark the hygIRC-2D model, which was previously developed at NRC-IRC. Good overall agreement was achieved between experimental and simulated results using hygIRC-2D in terms of the shape of the drying curve and the time taken to reach equilibrium moisture content. It was to this end that a weighing system was conceived that would measure changes in the total weight of a given wall specimen over a test period. This unique system allowed continuous monitoring of drying of the various wall samples [7].
The 3D version of the present model, hygIRC-C, was used to conduct numerical simulations for different full-scale wall assemblies with and without penetration in order to predict the effective thermal resistance (R-value) with and without air leakage [10 and 11]. These walls incorporated two different types of insulation, specifically, spray polyurethane foam and glass fibre. The predicted values for these walls were in good agreement (within + 5%) with the measured R-values in NRC-IRC’s guarded hot box test facility. Recently, the 2D version of the present model was also used to conduct numerical simulations in order to investigate the effect of the emissivity of foil on the effective thermal resistance of a foundation wall system with foil bonded to expanded polystyrene foam (XPS) in a furred assembly with airspace next to the foil [12]. In this work [10, 11, and 12], no moisture transport was accounted for in predicting the thermal performance of different types of walls. In this paper, however, the present model accounts for moisture transport to predict the drying and drying rate of different wall assemblies subjected to different exterior and interior boundary conditions.
The objective of this work is to benchmark the 2D version of the present hygrothermal model against laboratory measurements of the drying of the four full-scale wall assemblies. These walls were subjected to different exterior and interior conditions and varying initial moisture content of the OSB sheathing board components. The experimental results were derived from a precision weighing system for four full-scale wall specimens. The weight data was used to derive the weight loss with time in wood sheathing affixed to a wood-frame wall assembly when exposed to different laboratory conditions.
Experimental Approach & Wall Assemblies
A series of experiments were conducted to gather data on the hygrothermal behaviour of full-scale wood-frame wall assemblies and components when subjected to time dependent exterior and interior conditions such that the results could be used to evaluate the expected performance and predictive capabilities of the present model. The drying of the four full-scale specimens (2.44 m x 2.44 m) was monitored with time. The tests were conducted in different laboratory conditions over a period of time sufficiently long as to permit quantifying gravimetrically, the change, and rate of change, in the total moisture content of critical wall assembly components.
Page 3 of 14
Figure 1 - Schematics of the wall specimens
6 mil polyethylene 38 mm x 89 mm mm
wood stud frame
11.5 mm OSB sheathing
Glass fibre insulation (not shown) Sheathing membrane 6 mil polyethylene Glass fibre 11.5 mm OSB sheathing Sheathing membrane
(c) Set - 3
6 mil polyethylene 38 mm x 89 mm mmwood stud frame
11.5 mm OSB sheathing
Glass fibre insulation (not shown) Sheathing membrane 6 mil polyethylene Glass fibre 11.5 mm OSB sheathing Sheathing membrane (b) Set - 2 6 mil polyethylene 38 mm x 89 mm
wood stud frame Glass fibre insulation (not shown) 11.5 mm OSB sheathing 11.5 mm OSB sheathing Glass fibre 6 mil polyethylene
(a) Set - 1
6 mil polyethylene 38 mm x 89 mm mm wood stud frame 11.5 mm OSB sheathingGlass fibre insulation (not shown) Sheathing membrane Gypsum board 6 mil polyethylene Glass fibre 11.5 mm OSB sheathing Sheathing membrane Gypsum board (d) Set - 4
Page 4 of 14
The full-scale tests were carried out in a series of steps, each step comprised of evaluating the hygrothermal response of a full-scale specimen to specified laboratory conditions. The full descriptions of these steps are available in [2, 3, 4, 5, 6, and 7]. Figure 1 shows the various components of the four full-scale wall specimens that were tested and subjected to different exterior and interior conditions. In all wall specimens, the OSB layer was de-coupled from the wall assemblies by coating the wood frame with an impermeable lacquer. Different types of sheathing membranes were installed in all wall specimens except in set-1 in which no membrane was used. All wall specimens used a standard 38 mm by 89 mm wood stud frame construction, made of spruce, and spaced at 406 mm o/c in 2.44 m by 2.44 m full-scale wall specimens. The stud cavities were filled with glass fibre. As shown in Figure 1, a 6 mil polyethylene membrane was installed on the “interior” side of the assembly (laboratory conditions) in all wall specimens. Gypsum board was installed only in set-4.
2. GOVERNING EQUATIONS
The present model, hygIRC-C, simultaneously solves the highly coupled 2D and 3D Heat, Air, and Moisture (HAM) transport equations in porous media and non-porous media using COMSOL as a solver. In the case of an airspace and drainage cavity, the air transport equation utilized is the Navier-Stokes equation for compressible flow, and the moisture equation is the binary diffusion equation of vapour in air. Additionally, the present model accounts for surface-to-surface radiation (e.g. see [12]). Since there is no airspace or drainage cavity in the wall assemblies shown in Figure 1, only the HAM equations for porous media were solved simultaneously; these are given below.
Air Transport
The mass balance and momentum equations of air in a porous media are respectively given as [13]:
a a
, and a o v t (1)
. : law s Darcy' v Pa ag a a a (2) Heat TransportThe energy balance equation in a porous media is:
hawing freezing/t to due k source/sin Heat tion n/condensa evaporatio to due k source/sin Heat conduction Heat convection Heat Storage ) ( ) ( t w T h v P T h T T v Cp t T Cp ice ls a v v p fg eff a a a eff o (3)Since the outdoor temperature in all tests was above freezing, the last term on the RHS of Eq. (3) was neglected.
Page 5 of 14
Moisture Transport
The mass conservation of moisture in a porous media is given as:
T T P T R h T D v g k P P D t w v P v fg l a v l l v sat v l P ln , (4)The hygrothermal properties of all materials used in the four full-scale wall specimens were obtained from the NRC-IRC’s material properties database.
Initial and Boundary Conditions
All wall specimens were pre-conditioned to ensure that the OSB component in each wall was brought to elevated moisture content. The pre-conditioning consisted of two phases:
(i) Immersion phase where the OSB of the wall specimens were immersed for a period of three days to allow the OSB components to reach an elevated level of moisture content.
(ii) Stabilisation phase which took place for a period of two days following the three days of immersion to ensure that the moisture content throughout the OSB components reached equilibrium (see [8 and 8] for more details).
The initial moisture content of the OSB components of the four wall specimens were 50.7 kgw/kgd % (set-1), 51.5 kgw/kgd % (set-2), 70.1 kgw/kgd % (set-3) and 36.5 kgw/kgd % (set-4). In the numerical simulations, these values were used as initial conditions. Also, it was assumed that the initial moisture contents were uniform within the thickness of the OSB components.
The boundary conditions on the edges of all wall specimens were sealed (i.e. no mass transport) and adiabatic (i.e. no heat transport). In order to validate the capability of the hygrothermal model to manage time-dependent boundary conditions, the outdoor boundary conditions during the experiments were imposed by subjecting the “outdoor” portion of the wall to different temperature and relative humidity conditions, which were achieved using the NRC-IRC’s Environmental Exposure Envelope Facility (EEEF) over the test period [6]. For indoor boundary conditions, however, temperature and relative humidity were obtained using combined sensors, data acquisition and recording devices.
3. RESULTS AND DISCUSSIONS
This section presents the experimental results and those obtained from the numerical simulations for the four full-scale wall assemblies shown in Figure 1. In all numerical simulations, it was assumed that all material components of each wall specimen were in perfect contact. Also as indicated earlier, the initial moisture contents were assumed to be uniform within the thickness of the OSB components although the present model is capable of handling the initial moisture content as a function of position.
Page 6 of 14
Figure 2 - Drying and drying rate curves of the OSB in wall assembly of set-1
0
0.1
0.2
0.3
0
192
384
576
768
960
Measured Present Model hygIRC-2D(b)
Time (hr)
Drying Ra
te in
OS
B
(kg
w/kg
d)/
hr (%)
0
20
40
60
0
192
384
576
768
960
hygIRC-2D Present Model Measured(a)
Tot
a
l MC in OSB (kg
w/kg
d) (%)
Page 7 of 14
Wall specimen of Set-1
No sheathing membrane was used in the wall specimen of set-1. The initial moisture content of the OSB was 51.7 kgw/kgd %. This test was conducted over a period of 820 hr (~34 days). Figure 2a and Figure 2b show a comparison between the measured drying and drying rate curves of the OSB and those obtained using hygIRC-2D model [8, 8] and the present model (hygIRC-C). As shown in these figures, both models are in good agreement with the results derived from experiment for drying and drying rate.
During the first period of the test and because the outdoor relative humidity was low, the vapour pressure in the OSB was much greater than the outdoor vapour pressure resulting in a high drying rate as shown in Figure 2b. After that, the moisture content in the outermost layer of the OSB decreased. As such, the vapour pressure in this layer likewise decreased resulting in a significant decrease in the drying rate with time. For example, the drying rate decreased from 0.22 to 0.05 (kgw/kgd)/hr % as the time increased from 16 to 192 hr. At a time in excess of ~192 hr, the drying rate slowly decreased with time. At the end of the test and simulation period (820 hr), the drying rate of the OSB was in proximity to zero (~0.01 (kgw/kgd)/hr %), suggesting that the equilibrium moisture content of the OSB was not reached at the end of the test period. At this time, the total measured moisture content in the OSB layer was 16.1 kgw/kgd % compared to 14.9 kgw/kgd % and 16.7 kgw/kgd % obtained using hygIRC-2D model and the present model, respectively.
Comparisons between the predicted drying curves for the four full-scale wall assemblies derived using the hygIRC-2D model and those measured experimentally were conducted by Maref et al. [8 and 8]. It was shown that the predictions of hygIRC-2D model were in good agreement with the results derived from experiments (see [8] and [8] for more details). The next subsections focus on the detailed comparisons between the predictions of the present model and the test results of the wall specimens of set-2, set-3 and set-4.
Wall specimen of Set-2
In the wall specimen of set-2, a spun-bonded polyolefin sheathing membrane was installed on the outer surface of the OSB. The OSB had an initial moisture content of 51.5 kgw/kgd %. The test was conducted for a period of 384 hr (16 days). The results of the drying and drying rate curves of the OSB predicted using the present model as compared with the measured ones are given in Figure 3a and Figure 3b.
As was evident for set-1, the drying rate was high at the beginning of the test, and decreased significantly with time up to ~96 hr. At a time in excess ~96 hr, the drying rate slowly decreased with time (Figure 3b). As shown in Figure 3a, the maximum deviation between the measured and predicted moisture content in the OSB occurred at the end of the simulation period. At this time (384 hr), the measured moisture content in the OSB (35.1 kgw/kgd %) was 12.5% higher than the predicted moisture content (31.2 kgw/kgd %).
Page 8 of 14
Figure 3 - Drying rate curves of the OSB in wall assembly of set-2
-0.1
0
0.1
0.2
0.3
0.4
0
48
96
144
192
240
288
336
384
Measured Present Model(b)
Time (hr)
Drying
Ra
te
in
OS
B
(
k
g
w/kg
d)/hr (%)
0
10
20
30
40
50
60
0
48
96
144
192
240
288
336
384
hygIRC-C Measured(a)
To
ta
l MC i
n
O
S
B
(
k
g
w/kg
d) (%)
Page 9 of 14
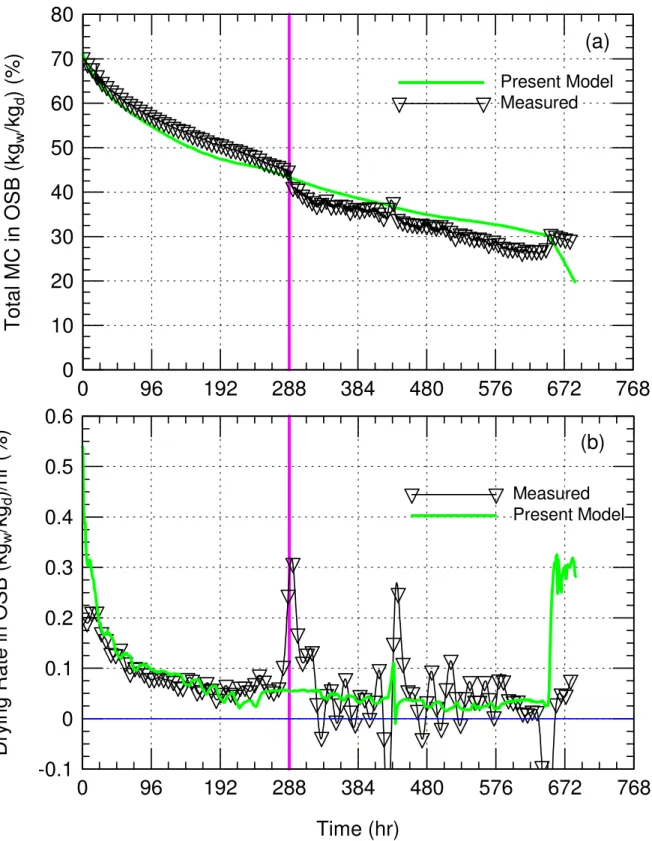
Figure 4 - Drying rate curves of the OSB in wall assembly of set-3
-0.1
0
0.1
0.2
0.3
0.4
0.5
0.6
0
96
192
288
384
480
576
672
768
Measured Present Model(b)
Time (hr)
Dr
ying Rate
in
OSB (k
g
w/k
g
d)/
hr (%)
0
10
20
30
40
50
60
70
80
0
96
192
288
384
480
576
672
768
Present Model Measured(a)
Tot
a
l M
C
in OSB (kg
w/kg
d) (%
)
Page 10 of 14
Wall specimen of Set-3
The OSB of the wall specimen of set-3 was covered by an asphalt impregnated building paper (60-min). The OSB had an initial moisture content of 70.1 kgw/kgd %. The drying test of this set was conducted over a period of 687 hr (~29 days). Figure 4a and Figure 4b provide a comparison of the predicted and measured drying and drying rate curves. As shown in Figure 4a, the measured total moisture content in the OSB decreased smoothly with time in the period from 0 to 288 hr. A sharp decrease in the moisture content occurred at time equal to 289 hr. At the time before and after the sharp decrease in moisture content (period from ~260 hr to ~410 hr), both outdoor temperature and relative humidity varied slightly with time. Accordingly, it was concluded that the sharp decrease in the measured moisture content at 289 hr was not due to outdoor conditions. However, we believe that this sharp decrease in moisture content was in fact due to a mechanical problem in the weighing system.
During the last period of the test (289 to 687 hrs), the bottom right corner of the wall assembly of set-3 was found to be touching the supporting frame of the weighing system. As such, the data acquisition unit was not recording the total weight of the wall specimen. A full description of this system and its functionality is available in [7].
Before the occurrence of a sharp decrease in the measured moisture content of the OSB (period from 0 – 288 hr), the predicted drying and drying rate curves were in good agreement with the measured ones (see Figure 4a and Figure 4b). At the end of this period (288 hr), the predicted moisture content in the OSB (43.3 kgw/kgd %) was ~3% lower than the measured one (44.6 kgw/kgd %). The outdoor and indoor boundary conditions of this wall specimen were also used to predict the drying and drying rate curves of the OSB during the period at which there was a mechanical problem in the weighting system. The predicted results are shown in Figure 4a and Figure 4b. Before conducting the drying test for the wall assembly of set-4, the problem in the mechanical weighing system was fixed and the system was recalibrated. The results of this test are provided next.
Wall specimen of Set-4
Unlike the other wall specimens, gypsum board was installed in the wall specimen of set-4. Also, a sheathing membrane made of asphalt impregnated building paper (60-min) was installed on the outer surface of the OSB. Initially, the moisture content in the OSB was 36.5 kgw/kgd %. The test was conducted for a period of 600 hr (25 days). Figure 5a and Figure 5b provide information on the measured drying and drying rate curves of the OSB as compared with predicted ones. As shown in these figures, the predicted drying and drying curves were in good agreement with measurements. The maximum deviation between the measured and predicted moisture content in the OSB occurred at the end of the simulation period (600 hr). At this time (600 hr), the measured moisture content in the OSB (27.5 kgw/kgd %) was ~10% higher than the predicted moisture content (24.9 kgw/kgd %). Similar to the other wall specimens, Figure 5b shows that the drying rate was high at the beginning of the test. It decreased significantly with time up to ~96 hr, and then slowly decreased at a time greater than ~96 hr.
Finally, the average moisture content in the OSB layer over the period of the test for each wall assembly was calculated from the predicted moisture content using the present model and those derived from the experiment. These results are shown in Figure 6. As shown in this figure, the
Page 11 of 14
predicted average moisture content of the different wall assemblies were in good agreement with those measured (within ~+5%).
Figure 5 - Drying rate curves of the OSB in wall assembly of set-4
0
0.1
0.2
0.3
0
96
192
288
384
480
576
672
Present Model Measured(b)
Time (hr)
Dr
yi
n
g
Ra
te
i
n
O
S
B
(
k
g
w/kg
d)/
hr (%)
0
10
20
30
40
50
60
0
96
192
288
384
480
576
672
Present Model Measured(a)
Total
MC in OSB
(kg
w/kg
d) (%
)
Page 12 of 14
Figure 6 - Comparison between the predicted and measured average moisture content in the OSB over the period of the test.
4. SUMMARY
The 2D version of the present model, hygIRC-C, was benchmarked against laboratory measurements of drying of four full-scale wall assemblies and hygIRC-2D model that was previously developed at NRC-IRC. This model solves simultaneously the highly nonlinear Heat, Air and Moisture (HAM) equations. The full-scale wall assemblies were representative of North American wood frame construction. These walls were subjected to time dependent outdoor and indoor conditions and varying initial moisture content of the OSB sheathing board components. The experimental results were derived from a precision weighing system for the full-scale wall assemblies. The results showed that the overall agreement between the present model and that of the experimental measurements as well as that predicted using the hygIRC-2D model were reasonably good in terms of the shapes of the drying and drying rate curves. Additionally, the predicted average moisture content of the different wall assemblies over the test periods were in good agreement with the measured ones (within +5%).
24
26
28
30
32
34
36
38
40
42
44
46
24
26
28
30
32
34
36
38
40
42
44
46
Set - 4
Set - 3
Set - 2
Set - 1
-5%
+5%
Measured average MC over test period (kg
w/kg
d) (%)
P
redi
c
ted average MC
ov
er t
e
s
t per
iod (
k
g
w/k
g
d) (%)
Page 13 of 14
5. ACKNOWLEDGMENTS
The authors would like to thank Marianne Armstrong for reviewing this paper. Thanks are also accorded to Daniel Booth and Mike Nicholls for fabricating and instrumenting the wall specimens.
6. NOMENCLATURES
Cp effective specific heat (J/(kg.K)
l
D liquid diffusivity (m2/s)
g vector of gravitational acceleration (m2/s)
fg
h latent heat of evaporation (J/kg)
ls
h latent heat of fusion (J/kg)
l
k water liquid permeability (s)
P pressure (Pa)
v
R gas constant of water vapour (J/(kg.K)) v velocity vector (m/s) T temperature (K) t time (s) w moisture content (kg/m3) Greek Symbols o
porosity of porous material
P
vapour permeability (s) relative humidity ratio
density (kg/m3)
dynamic viscosity (Pa.s)
a
air permeability (m2)
specific moisture capacity (kg/m3).
eff
effective thermal conductivity (W/(m.K) Subscripts a air eff effective l water liquid o solid matrix v water vapour sat saturation
Page 14 of 14
7. REFERENCES
1. Hens, H. 1996. Final report Task 1. Modeling and Common Exercises. Summary reports. IEA, Energy Conservation in Buildings and Community Systems, Annex 24 Heat, Air and Moisture Transport in New and Retrofitted Building Envelope Parts (HAMTIE).
2. Maref, W. Kumaran, M.K., Lacasse, M.A., Swinton, M.C. and van Reenen, D. 2002a. "Laboratory Measurements and Benchmarking of an Advanced Hygrothermal Model", proceeding of the 12th Int. Heat Transfer Conf., August 2002 - Grenoble (France).
3. Maref, W. Lacasse, M.A., Kumaran, M.K. and Swinton, M.C. 2002b. "Benchmarking of the advanced hygrothermal model-hygIRC with mid-scale experiments", proceeding of the eSim 2002-IBPSA-Canada Conference, Montreal (Canada) Sept 12-13, 2002.
4. Maref, W. Lacasse, M.A., Booth, D.G., 2002c. Executive Summary of Research Contributions Related to Moisture Management of Exterior Wall Systems (MEWS) - Modeling, Experiments, and Benchmarking, IRC Research Report, 127, pp. 15, Dec, 2002 (RR-127).
5. Maref, W. Lacasse, M.A., Booth, D.G. 2002d. Benchmarking of IRC's Advanced Hygrothermal Model - hygIRC Using Mid- and Large-Scale Experiments, IRC Research Report, 126, pp. 38, Dec, 2002 (RR-126).
6. Maref, W. Booth, D.G., Lacasse, M.A., and Nicholls, M. 2002e. Drying Experiment of Wood-Frame Wall Assemblies Performed in the Climatic Chamber EEEF: Specification of Equipment Used in EEEF-Environmental Exposure Envelope Facility, IRC Research Report, pp. 42, Oct. 18, 2002 (RR-105).
7. Maref, W. Lacasse, M.A. and Kourglicof, N. 2001. "A Precision weighing system for helping assess the hygrothermal response of full-scale wall assemblies," Performance of Exterior Envelopes of Whole Building VIII: Integration of Building Envelopes (Clearwater Beach, FL), pp. 1-7, December 12, 2001.
8. Maref, W., Lacasse, M.A., Booth, D.G. 2004. “Large-scale laboratory measurements and benchmarking of an advanced hygrothermal model”, CIB 2004 Conference (Toronto, Ontario 2004-05-02) pp. 1-11.
9. Maref, W.; Lacasse, M.A. 2009. "Drying response of wood-frame construction: laboratory and modelling," J. of ASTM International (JAI), Second Symposium on Heat-Air-Moisture Transport: measurements and implications in buildings (Vancouver, B.C. April 19, 2009), pp. 1-21.
10. Elmahdy, A.H., Maref, W., Swinton, M.C., Saber, H.H., Glazer, R. 2009. “Development of Energy Ratings for Insulated Wall Assemblies” 2009 Building Envelope Symp. (San Diego, CA. 2009-10-26) pp. 21-30.
11. Saber, H.H., Maref, W., Elmahdy, A.H., Swinton, M.C., and Glazer, R. “3D Hygrothermal Model for Predicting the Thermal Resistances of Spray Polyurethane Foam Wall Assemblies”, Building XI conference, Clearwater, Florida, 2010.
12. Saber, H.H., Swinton, M.C. “Determining through Numerical Modeling the Effective Thermal Resistance of a Foundation Wall System with Low Emissivity Material and Furred – Airspace”, ICBEST 2010, Vancouver, Canada, June 27-30, 2010.
13. Bird, R. B., Stewart, W. E., and Lightfoot, E. N. 1960.Transport Phenomena, John Wiley & Sons, Inc.