A TL-TILECAL-PROC-2020-003 10 Febr uary 2020
Prepared for submission to JINST
Calorimetry for the High Energy Frontier 2019 2019
Fukuoka, Japan
ATLAS Tile calorimeter calibration and PMT response
D. Boumediene, on behalf of the ATLAS Collaboration.
CNRS/IN2P3/LPC Université Clermont-Auvergne, 4 avenue Blaise Pascal, 63178 Aubière, France
E-mail: [email protected]
Abstract: The ATLAS Tile Calorimeter (TileCal) is the central section of the hadronic calorimeter of the ATLAS experiment at the Large Hadron Collider. It provides important information for reconstruction of hadrons, jets, hadronic decays of tau leptons and missing transverse energy. This sampling calorimeter uses steel plates as absorber and scintillating tiles as active medium. Scintillating light is transmitted by wavelength shifting fibres to photomultiplier tubes (PMTs) in the rear girders of the wedge-shaped calorimeter modules. Photomultiplier signals are then digitized at 40 MHz and stored on-detector in digital pipelines. Event data are transmitted off-detector upon a first level trigger acceptance, at a maximum rate of 100 kHz. The readout is segmented into about 5000 cells, each read out by two PMTs on opposite sides of the cells. To calibrate and monitor the stability and performance of each part of the readout chain during the data taking, a set of calibration systems is used. The TileCal calibration system comprises Cesium radioactive sources, a laser, a charge injection system and an integrator based readout system. Combined information from all systems allows the calorimeter response to be monitored and equalised at each stage of the signal production, from scintillation light to digitisation. After exposure to scintillator light for almost 10 years, variations in gain have been observed when the PMTs are exposed to large light currents. These variations have been studied and correlated to some intrinsic properties of the PMTs, including the quantum efficiency, as well as operation conditions like the High Voltage. Latest results and conclusions are presented.
Keywords: Calorimeters, Photomultipliers
Contents
1 Introduction 1
2 Calibration Systems of the TileCal 2
2.1 The Cesium Calibration 2
2.2 The Laser Calibration 2
2.3 The Charge Injection System (CIS) 3
2.4 The Minimum Bias Integration 3
3 Calibration and Gain Stability of the TileCal 3
4 Conclusion 5
1 Introduction
The Tile Calorimeter (TileCal) [1,2] of ATLAS [3] at the Large Hadron Collider (LHC) has three
key elements: the scintillators, the photomultiplier tubes (PMTs) and the read-out electronics. The light is produced in scintillating tiles and converted into electric currents by the PMTs. Their signal is shaped and amplified with two gains. The sampling and the digitization is realised by ADCs. TileCal barrels have three longitudinal layers, A, BC and D, from inner to outer radius. TileCal PMTs were qualified before their installation in specific drawers. During this qualification process,
their intrinsic properties were measured. This includes the nominal High Voltage1 (HVnom), the
amplification factor2(β) and the quantum efficiency3. These properties were used to distribute the
PMTs among the various cells, eg. by associating the PMTs with highest quantum efficiency to
cells producing the highest light as shown in Figure1.
The TileCal readout has two paths: for collision events that pass the trigger system, the digitized signals are collected and processed by a Read-Out Driver. In addition to this, integrators measure the integrated current from the PMTs independently from the trigger system.
The raw response of each channel, A(ADC), is translated into a reconstructed energy, E(GeV),
as follows:
E(GeV) = A(ADC) · CADC→pC· CpC→GeV· CCesium· CLaser
The calibration factors of each channel can evolve in time because of instability of PMT high-voltages, PMT stress induced by high light flux or aging of the optics. The calibration systems are used to monitor the stability of these elements and provide per channel calibration.
1Nominal High Voltage is defined such that the gain of the PMT is 105. 2Such that the gain is proportional to HVβ.
3The quantum efficiency is the ratio between the number of photo-electrons captured by the first dynode and the number of photons reaching the photocathode.
The factor CpC→GeVwas fixed prior to data taking, during dedicated test beam campaigns. The remaining constants are provided by dedicated systems:
• spaced by weeks or months, calibrations of Tile optic components and phototube gains with movable Cesium radioactive gamma source;
• daily to weekly calibrations of phototube gains with a custom laser calibration system; • daily to weekly calibrations of digital gains and linearities with a charge injection system
(CIS) integrated on module front-ends;
• monitoring of beam conditions, Tile optics and phototubes with the so-called integrator system (minimum bias) during collisions.
2 Calibration Systems of the TileCal
2.1 The Cesium Calibration
The Cesium calibration system [4] is based on three movable 137Cs γ-sources and a hydraulic
control implemented in the calorimeter body. The TileCal response to Cesium signals have to be
corrected from the Cesium decay curve (−2.3%/year). Deviations of this response are translated
into calibration constants (CCesium). They are used to equalize the response of all the cells and maintain global response of the calorimeter at the electromagnetic scale. These constants describe the optical chain and the photomultipliers, with a precision better then 3 per 1000, including the scintillators aging effect.
During this calibration, the Integrator is used to record the PMT responses making the Cesium measurement insensitive to things that can affect the readout used for collision data. It has to be completed by a dedicated system, the CIS. On the other hand, due to the calibration procedure length, the frequency of the Cesium calibration can be insufficient to track fast drifts of the PMT responses. For prompt calibration, the laser system is used between two Cesium scans.
2.2 The Laser Calibration
The gain of each PMT is measured using a laser calibration system [5] that sends a controlled
amount of light in the photocathode of each PMT. All TileCal cells can be monitored with typically 10000 laser pulses. Different light amplitudes can be used in order to monitor both high and low gain regimes of TileCal or to study the linearity of its response. Deviations of any channel response with respect to its response at the time of the latest Cesium calibration is translated into a calibration constant: CLaser.
The typical precision on the gain variation is better than 0.5% per channel. The laser
measure-ments are used for fast monitoring of TileCal and to correct from PMT gain variations. Most of the gain drifts requiring a laser calibration were induced by luminosity effects.
Laser pulses are also sent during empty bunch crossings of the LHC, with a frequency of 2 Hz, and the timing of the TileCal response is measured and used for channel per channel time calibration.
2.3 The Charge Injection System (CIS)
The CIS injects a known charge into the digital readout of each TileCal channel [6]. The electronic
response is measured providing a quantitative relationship between the analog physical signals from the Tile Calorimeter photomultiplier tubes and the electronic response of TileCal read-out channels. This system is used to correct for non-linearity in the analog signal processing. A set
of CIS calibration constants (CADC→pC) are regularly produced and applied to TileCal data. The
precision on the CIS calibration constant is about 0.7% for each channel.
2.4 The Minimum Bias Integration
During proton-proton collisions, the PMT currents are integrated over a time window of 10 ms
allowing a continuous recording of Minimum Bias4interactions [7]. The response of the TileCal
to signals induced by MB interactions scale with instantaneous luminosity. It can be used to measure the luminosity delivered to ATLAS, to monitor the stability of the channels or to provide an independent cross-check of the Cesium calibration.
16 17 18 19 20 21 22 Quantum Efficiency [%] 0 50 100 150 200 250 300 350 400 450 Channels BC Cells LB A Cells LB Preliminary ATLAS Tile Calorimeter
Figure 1. Distribution of the quantum efficiency of PMTs associated to A cells (plain red) or BC cells (dashed black) in the Long barrel. The quantum effi-ciency was measured before the start of LHC. [8]
Figure 2. Detector-wide CIS calibration constant av-erages of all the high-gain ADCs for a selection of CIS calibration runs between May 2017-November 2017, plotted as black circles. The CIS constants from a typ-ical channel are additionally plotted as blue triangles for comparison [8].
3 Calibration and Gain Stability of the TileCal
The four TileCal calibration systems were operated during Run 2 of the LHC. They were used to control the energy scale of the TileCal but also to understand the mechanism of some changes in the response of the channels.
The average read-out calibration constants, as provided by the Charge Injection System for the duration of LHC Run 2 and for all ADC channels, show a typical in-time stability of 0.03% as illustrated in Figure2.
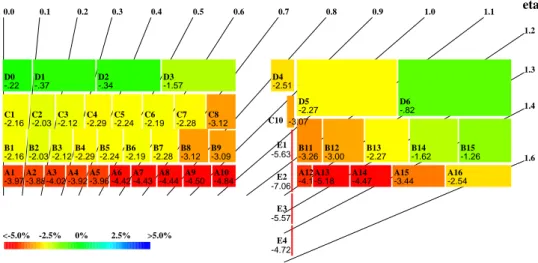
0.0 0.1 0.2 0.3 0.4 0.5 0.6 0.7 0.8 0.9 1.0 1.1 1.2 1.3 1.4 1.6 eta ATLAS Preliminary Tile Calorimeter -3.97 A1 -3.88 A2 -4.02 A3 -3.92 A4 -3.96 A5 -4.42 A6 -4.43 A7 -4.44 A8 -4.50 A9 -4.84 A10 -2.16 B1 -2.03 B2 -2.12 B3 -2.29 B4 -2.24 B5 -2.19 B6 -2.28 B7 -3.12 B8 -3.09 B9 -2.16 C1 -2.03 C2 -2.12 C3 -2.29 C4 -2.24 C5 -2.19 C6 -2.28 C7 -3.12 C8 -.22 D0 -.37 D1 -.34 D2 -1.57 D3 -4.10 A12 -5.18 A13 -4.47 A14 -3.44 A15 -2.54 A16 -3.26 B11 -3.00 B12 -2.27 B13 -1.62 B14 -1.26 B15 -3.07 C10 -2.51 D4 -2.27 D5 -.82 D6 -5.63 E1 -7.06 E2 -5.57 E3 -4.72 E4 <-5.0% -2.5% 0% 2.5% >5.0% run 340583, 2017-11-11.
Figure 3. The mean gain variation of the 9852 channels is computed cell by cell as a function ofη and radius, between the 6 March and 11 November 2017 with the laser system. The mean values are averaged over the total azimuthal coverage of the detector. The mean gain variation is corrected for changes in high voltage (HV) that affect mostly E3 and E4 cells [8].
Since the LHC reached its nominal luminosity regime in Run 1, a sizable down-drift is seen when the beam is on while the response recovers slowly when the beam is off, i.e. during LHC technical stops, and during heavy ion collisions which have a low luminosity. The biggest
down-drift is in the innermost part of the calorimeter, i.e. in A cells where up to−10%/year was observed
for some channels in October 2018, while in the D cells of the barrel partition, down-drifts are at the percent level.
Such a luminosity induced drift is observed with the laser system, the Cesium system and the MB integrator. It mostly affects cells at inner radii, which are the cells with higher current, as
shown in Figure3on a full TileCal map, where the drift is clearly observed a few weeks after the
first collisions of 2017. Comparisons of the drifts observed by TileCal monitoring systems were performed. Their compatibility indicates that the gain variation is dominated by the PMT gain
variation. As shown in Figure 4, for some channels monitored in 2018, the down-drift periods
coincide with the periods of data taken with high instantaneous luminosity, while the up-drifts coincide with the technical stops (no collisions).
Although the gain variation is correlated to luminosity, different channel to channel behaviors are observed. For a given cell type, the spread of this variation is larger than the precision of laser measurements.
Possible origins of this drift inhomogeneity were explored by comparing the gain variations measured in 2018 with the laser system to some intrinsic properties of the PMTs.
during 2018 with laser data. Figure4 shows two categories of channels connected to A13 cells whose PMTs have either a high or a low quantum efficiency. A systematic difference between these two sets of channels is observed indicating that the larger the quantum efficiency the larger the luminosity induced gain variation. This effect was observed in other TileCal cells. In order to quantify the dependence between gain variation and quantum efficiency, a specific laser run was selected at the end of the proton collision period in 2018 corresponding to the maximal gain variation. Considering all A cell channels, the gain variations were modelled as a function of the
quantum efficiency as seen in Figure5. For this specific laser run, a linear function was fitted to the
data with a slope of−0.33 ± 0.04.
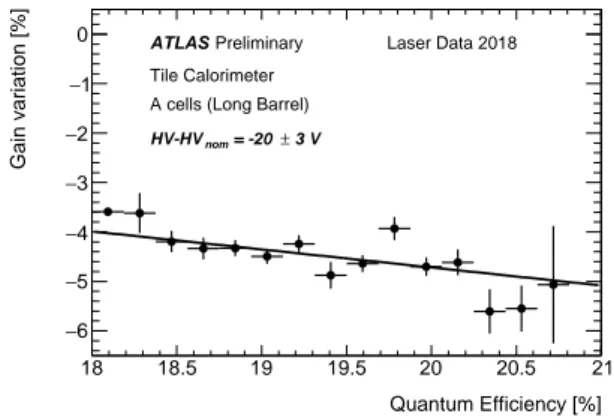
The various PMTs may be supplied with a different High Voltage, denoted HV. In order to check that the observed dependence of the drift to the quantum efficiency is independent of HV, only PMTs with similar HVs were considered.
The dependence of the gain drift to the quantum efficiency is determined for a subset of PMTs
such as their High Voltage bias, HV− HVnom is similar within 3 V and reported in Figure6. The
measured slope is−0.36 ± 0.11 which is compatible with the behavior of the inclusive set of PMTs.
It confirms that the quantum efficiency inhomogeneity governs the spread of the PMT gain variation. No significant relation between gain variation and other properties such as the multiplication
factorβ was observed, as shown in Figure7.
15/04/2018 24/06/2018 01/09/2018 09/11/2018 Date 7 − 6 − 5 − 4 − 3 − 2 − 1 − 0 1 Gain variation [%] A13 QEff<18.5% A13 QEff>19.5% Preliminary ATLAS Tile Calorimeter Laser Data 2018
Figure 4. Gain variation measured with the Laser system over 2018. For each point, the variation in the response of the low gain channels associated to A13 cells were averaged over the azimutal angle. Photo-multiplier Tubes having a high (> 19.5%) or a low (< 18.5%) quantum efficiency (QEff) were separated into two samples. [8]
Quantum Efficiency [%] 18 18.5 19 19.5 20 20.5 21 Gain variation [%] 6 − 5 − 4 − 3 − 2 − 1 − 0 ATLAS Preliminary Tile Calorimeter A cells (Long Barrel) Laser Data 2018
Figure 5. Gain variation measured with the laser system over 2018, from the beginning of data taking to September, as a function of the quantum efficiency of Photomultiplier Tubes connected to the A cells of the TileCal Long Barrel. [8]
4 Conclusion
The calibration systems of the ATLAS Tile Calorimeter were successfully operated during Run 2 of the LHC. Their performance were established. It was shown that these systems can be used in conjunction to monitor and correct fine instabilities affecting the channel gain, especially PMT
Quantum Efficiency [%] 18 18.5 19 19.5 20 20.5 21 Gain variation [%] 6 − 5 − 4 − 3 − 2 − 1 − 0 ATLAS Preliminary Tile Calorimeter A cells (Long Barrel)
3 V ± = -20 nom HV-HV Laser Data 2018
Figure 6. Gain variation measured with the Laser system over 2018, as a function of the quantum effi-ciency of Photomultiplier Tubes connected to the A cells of the TileCal Long Barrel are used. Only PMTs supplied with a High Voltage smaller than Nominal High Voltage by (20± 3)V are used. [8]
6.8 6.9 7 7.1 7.2 7.3 7.4 7.5 β 7 − 6 − 5 − 4 − 3 − 2 − 1 − 0 Gain Variation [%] Preliminary ATLAS Tile Calorimeter Laser Data 2018
Figure 7. Mean gain variation measured with the laser system over 2018, from the beginning of data taking to September, as a function of the β of the Photomultiplier Tubes (PMTs). Photomultiplier tubes connected to the A cells of the TileCal Long Barrel with similar quantum Efficiencies 18.5 ± 0.5% are used. [8]
drifts induced by high instantaneous luminosity or to identify the small fraction of pathological channels.
The large amount of calibration data collected by one of the calibration systems can be used to understand further the mechanism of the gain variations of the phototubes. Some correlations between the gain variations induced by the PMT stress and their quantum efficiency were reported.
References
[1] ATLAS/Tile Calorimeter Collaboration, Tile Calorimeter Technical Design Report, CERN/LHCC 96-42 (1996). http://cdsweb.cern.ch/record/331062.
[2] The ATLAS Collaboration, Readiness of the ATLAS Tile Calorimeter for LHC collisions, Eur. Phys. J. C 70 (2010) 1193.
[3] The ATLAS Collaboration, The ATLAS experiment at CERN Large Hadron Collider, JINST 3 (2008) S08003.
[4] E.A. Starchenko et al., Cesium monitoring system for ATLAS Tile Hadron Calorimeter, Nucl. Instrum. Meth. A494 (2002) 381.
[5] ATLAS Tile Calorimeter system, The laser calibration of the Atlas Tile Calorimeter during the LHC run 1, JINST 11 T10005 (arXiv:1608.02791).
[6] K.J. Anderson, et al., Design of the Front-end Analog Electronics for the ATLAS Tile Calorimeter, Nucl. Instrum. Meth. A551 (2005) 469.
[7] The ATLAS Collaboration, Improved luminosity determination in pp collisions at√s= 7 TeV using
the ATLAS detector at the LHC, Eur. Phys. J. C 73 (2013) 2518. [8] TileCal collaboration public results.