Chapter 2. Basic Atomic Physics
Academic and Research Staff
Professor Daniel Kleppner, Professor David E. Pritchard, Professor Wolfgang Ketterle, Dr. Al-Amin Dhirani, Dr. Hans-Joachim Miesner, Dr. Fred L. Palmer, Dr. James V. Porto, Dr. Nicolaas J. van Druten
Visiting Scientists and Research Affiliates
Dr. Theodore W. Ducas! Dr. Christopher G. Townsend
Graduate Students
Michael R. Andrews, Michael P. Bradley, Joel C. DeVries, Dallin S. Durfee, Troy D. Hammond, Jeffrey R. Holley, Shin Inouye, David A. Kokorowski, Christopher E. Kuklewicz, Dan M. Kurn, Robert Lutwak, Marc-O. Mewes, Simon Rainville, Daniel J. Ripin, Richard A. Rubenstein, Edward T. Smith, Neal W. Spellmeyer
Undergraduate Students
Everest W. Huang, Mark L. Huang, Roland N. Nguyen, Charles K. Sestok, Huan Yao
Technical and Support Staff
Carol A. Costa
2.1 Studies in Quantum Chaos:
Rydberg Atoms in Strong Fields
Sponsors
Joint Services Electronics Program Grant DAAH04-95-1-0038 National Science Foundation
Grant PHY 92-21489
U.S. Navy - Office of Naval Research Grant N00014-90-J-1322
Project Staff
Neal W. Spellmeyer, Daniel J. Ripin, Daniel Kleppner should be Conversely, mechanics mechanics. Professor
A Rydberg atom in an applied field is a prototypical system for studying the connections between clas-sical and quantum mechanics, both experimentally and theoretically. This system is interesting because the applied field or the effect of an ionic core can result in irregular classical motion of the electron. Manifestations of this motion in the quantum spectrum can be observed using powerful methods based on high-resolution laser spectros-copy. The correspondence principle indicates that, in the semiclassical limit (high quantum numbers and/or small Planck's constant), these systems
describable by classical mechanics. in the semiclassical limit classical should be describable by quantum
Periodic orbit theory provides a unifying principle for relating a quantum spectrum to the periodic orbits of the corresponding classical system in the semi-classical limit. According to periodic orbit theory, each periodic orbit of the classical system produces a sinusoidal modulation in the density of states in the quantum system. A spherical wave sent out from the origin as an electron is excited by laser light will recur (overlap with the original outgoing wave) at times corresponding to the periods of the periodic orbits of the classical system. The magni-tude of this overlap gives the strength of the modu-lation of the spectrum. Closed orbit theory,2 a variation of periodic orbit theory, has been devel-oped to describe experiments involving Rydberg atoms. It indicates that each closed orbit (an orbit beginning and ending at the nucleus) produces a sinusoidal modulation in the photoabsorption spec-trum. The frequency of modulation is given by the action of the closed orbit.
In recent years, we have conducted detailed studies of the behavior of Rydberg atoms in external
elec-1 Professor, Physics Department, Wellesley College, Wellesley, Massachusetts. 2 M.L. Du and J.B. Delos, Phys. Rev. A 38: 1896 (1988).
tric and magnetic fields. We used the method of scaled variable recurrence spectroscopy.3 To gen-erate a recurrence spectrum, we carry out laser spectroscopy under conditions of constant scaled energy in which the energy and external fields are varied simultaneously to maintain conditions of constant classical behavior. By taking their Fourier transform with respect to action, we obtain a recur-rence spectrum-a spectrum of the response of the system in action, somewhat analogous to its response in time-in which each closed orbit gener-ates a peak in the spectrum.
We have been able to identify the signatures of numerous periodic orbits in the spectra4 and have observed such interesting effects as the growth of new orbits through bifurcations5 and the onset of irregular behavior through core scattering.4 However, a recurrence spectrum can be compli-cated, and the information it offers on a particular classical orbit-essentially its existence and action-is limited.
To extend our insight into the classical behavior of a system by studying its quantum behavior, we have undertaken a study of the recurrence spectra of a Rydberg atom in a field that is oscillating at fre-quencies in the vicinity of the orbital frefre-quencies of the system.
We have chosen to study the Rydberg states of lithium in an applied electric field because the system is separable, well understood, and relatively tractable to theory. Chaotic motion can be induced by the lithium core, providing the opportunity to study both regular and chaotic systems.
The Hamiltonian of a Rydberg atom in a static elec-tric field F along the z-axis and an RF field F1
polarized along the z-axis is
H = 1 2 p2 1 r + Fz + Fl z cos(wt +).
The Hamiltonian can be rescaled using the substi-tutions r = F1/2r, p = F- 1/4 p and t =F- 3/4 t. The scaled Hamiltonian
1 ~2 1
H =- p -
+
z(1+ f cos(wt
+))
2 r
depends on only three parameters, the scaled energy H = E = EF- 1/2, the scaled field f = F/F,, and
the scaled frequency w = wF-3/4
. Consequently,
the classical dynamics also depends on only these three parameters, not on E, F, w, and F, sepa-rately.
Our experiment employs a lithium atomic beam that travels through holes in a pair of field plates that provide an electric field parallel to the atomic beam. Laser beams intersect the atomic beam at a right angle. Lithium is excited to Rydberg states using three photons. Laser beams at 670 nm and 813 nm are locked to resonant transitions at 2S to 2P and 2P to 3S, respectively. A third laser polarized par-allel to the applied fields excites m=0 Rydberg states that drift out of the interaction region. The atoms are ionized and the ions are detected by a channel electron multiplier. The RF field is applied by capacitively coupling onto one of the field plates. The RF is generated by a synthesizer that allows for computer control of both the frequency and amplitude. The RF field amplitude is calibrated using the amplitudes of sidebands created on Stark states. To generate a recurrence spectrum, we measure the photoabsorption spectrum while simul-taneously varying the laser energy, static electric field, RF frequency, and RF field amplitude to main-tain the classical scaling laws.
We have previously studied the spectrum with no RF field in some detail.6 The principal orbit at ener-gies above the saddle point (energy E = - 2) is the "uphill" parallel orbit-the orbit going out and back along the electric field. The recurrence spectrum is dominated by a sequence of strong recurrences near bifurcations where new orbits are born out of the parallel orbit. Near E = - 0.4, the energy at which this study is conducted, the second repetition is the strongest because of the proximity of the 1/2 bifurcation.
Figure 1 shows a series of recurrence spectra recorded at E = - 0.4 and f = 0.005 as w is varied from 0.16 to 0.60 in steps of 0.02. The second
3 A. Holle, J. Main, G. Wiebusch, H. Rottke, and K.H. Welge, Phys. Rev. Lett. 61: 161 (1988). 4 M. Courtney, H. Jiao, N. Spellmeyer, and D. Kleppner, Phys. Rev. Lett. 73: 1340 (1994).
5 M. Courtney, H. Jiao, N. Spellmeyer, D. Kleppner, J. Gao, and J.B. Delos, Phys. Rev. Lett. 74: 1538 (1995).
6 M. Courtney, H. Jiao, N. Spellmeyer, D. Kleppner, J. Gao, and J.B. Delos, Phys. Rev. Lett. 74: 1538 (1995); M. Courtney, N. Spellmeyer, H. Jiao, and D. Kleppner, Phys. Rev. A 51: 3605 (1995); 74: 1538 (1995).
repetition at action S = 1.39 is conspicuous, and the spectrum also displays three curved bands of strong recurrence strength. These bands occur when the period of an orbit is near an integral mul-tiple of the period of the oscillating field.
Repetition Number 5 10 15 20 25 30 0.6 0.5 " 0.4 . 0.3 0.2 A 5 10 15 20 Scaled Action
Figure 1. Experimental recurrence spectrum: E = -0.4 and f = 0.005. The horizontal axis is scaled action and each scan has a baseline at the value of scaled RF fre-quency w at which it was recorded. The top axis numbers the repetitions of the parallel orbit. The solid lines mark the loci at which the period of the parallel orbit is an integer times the period of the applied field. The dashed lines are contours along which closed orbit theory predicts an 80 percent reduction in the recurrence strength of the parallel orbit.
We have worked in collaboration with Dr. John B. Delos at the College of William and Mary to explain these results. Traditional closed orbit theory models the continuous laser excitation process as occuring over very long times in which, quantum mechanically, the electron propagates along many possible paths, returns, and interferes with itself. Constructive interference occurs along paths fol-lowing the classical orbits. The presence of the oscillating field does not fundamentally alter this picture. As the field oscillates, the electron is con-tinuously excited into outgoing waves which propa-gate along the paths of the closed orbits and return to the nucleus. The nature of each of these orbits depends on the phase of the field when the orbit was launched. Thus, a classical description requires a continuous sum over all phases in addi-tion to the usual sum over all closed orbits.
The principal effect of the RF field is to slightly modify the action of each closed orbit, depending
on the phase of the field when the orbit was launched. For small RF field amplitudes, the per-turbed action of an orbit is S = So + S1 cos(j) where
4 is a relative phase between the oscillating field and the start of the orbit. Incorporating this into the closed orbit sum and averaging over all phases leads to a prediction that the recurrence strength of a given orbit should fall off as the square of a Bessel function. The rate of falloff is related to the amplitude of variation in action of an orbit, or, equivalently, to the time-averaged ac dipole
moment of the orbit.
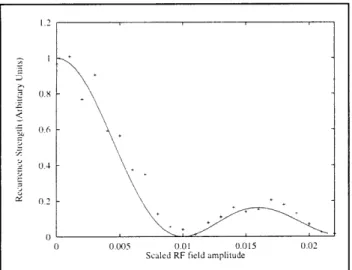
Figure 2 shows a series of recurrence spectra recorded at co = 0.32 and E = - 0.4 as the scaled RF field amplitude is varied from 0.0 to 0.022. The RF field reduces the amplitude of each orbit at varying rates. A second maximum appears for the second repetition near f = 0.018. Figure 3 com-pares the experimentally measured recurrence strength of this second repetition with the prediction of the new classical theory. Good agreement is seen with the falloff rates of the other orbits.
Repetition Number 5 10 15 20 25 30 0.02 0.015 0.01 ' .0.05 A 5 10 15 20 Scaled Action
Figure 2. Experimental recurrence spectrum: E = -0.4 and w = 0.32. The horizontal axis is scaled action and the vertical axis is the scaled RF field amplitude. The top axis numbers the repetitions of the parallel orbit.
In summary, the oscillating field reduces the strength of most orbits in the spectrum except for orbits whose action is only slightly perturbed by the oscillating field. We have found good agreement with a new version of closed orbit theory developed to describe time-dependent systems.
0 0.005 0.01 0.015 0.02 Scaled RF field amplitude
Figure 3. Comparison between experiment and classical theory at E = - 0.4 and w = 0.32. The crosses are
experiment and the solid line is the prediction of a simple version of closed orbit theory that treats only the parallel orbit.
2.1.1 Publications
Courtney, M., H. Jiao, N. Spellmeyer, and D. Kleppner. "Quantum Chaos and Rydberg Atoms in Strong Fields." Drexel Conference
Proceedings. Forthcoming.
Courtney, M., and D. Kleppner. "Core-Induced Chaos in Diamagnetic Lithium." Phys. Rev. A
53: 178 (1996).
Thesis
Jiao, H. Experimental and Theoretical Aspecs of
Quantum Chaos in Rydberg Atoms in Strong Fields. Ph.D. diss., Dept. of Phys., MIT, 1996.
2.2 Determination of the Rydberg
Frequency
Sponsor
National Science Foundation Grant PHY92-21489
7 F. Nez et al., "Determination of the Rydberg Constant by Direct Frequency Measurement," IEEE Trans. Instr. Meas. 44(2): 568-571 (1995); M. Weitz et al., "Precision Measurement of the 1S Ground-state Lamb Shift in Atomic Hydrogen and Deuterium by Frequency
Comparison," Phys. Rev. A 52(4): 2664-2681 (1995).
212 RLE Progress Report Number 139
Project Staff
Joel C. DeVries, Dr. Theodore W. Ducas, Jeffrey R. Holley, Robert Lutwak, Professor Daniel Kleppner The Rydberg constant, R,, relates the wavelengths
of the spectrum of atomic hydrogen to practical lab-oratory units. As such, Rm is the natural unit for measurements of atomic energies, and appears as an auxiliary constant in many spectroscopic mea-surements. Recent advances in optical wavelength metrology have made possible measurements of R, with accuracy approaching 1 part in 1011.7 The Rydberg frequency, cR., similarly relates the atomic unit of frequency to laboratory units. Although the speed of light c is an exactly defined quantity, the relation between the Rydberg constant and the Rydberg frequency is not merely formal. The pre-cision with which a frequency can be measured is limited in principle to the precision of atomic clocks, which currently exceeds 1 part in 1014 and is expected to grow even larger. In contrast, wave-length metrology appears to have reached its limit of precision, somewhat less than 1 part in 1011. To make full use of the precision of lasers and modern laser spectroscopy, and for applications in communications, control, and metrology, general techniques for measuring the frequency of light need to be developed. As part of this effort, we propose to help establish an atomic optical quency standard by measuring the Rydberg fre-quency directly.
Our approach involves measuring the frequency of transitions in atomic hydrogen in a regime where the frequencies can be compared directly to an atomic clock. The experiment explores transitions between highly excited "Rydberg" states of atomic hydrogen, in the neighborhood of n=29. The transi-tions to nearby states occur at approximately 256 GHz. This signal is generated coherently from a frequency standard based on an atomic clock. The goals of our experiment are three-fold. First is the reevaluation of Ru. itself, providing an indepen-dent check, in a different regime, of other measure-ments employing optical wavelength metrology. Second is the measurement of the ground state Lamb shift. Because our measurements involve high angular momentum states for which the Lamb shift is extremely small, our results may be com-pared with optical measurements of transitions between low-lying states to yield an improved
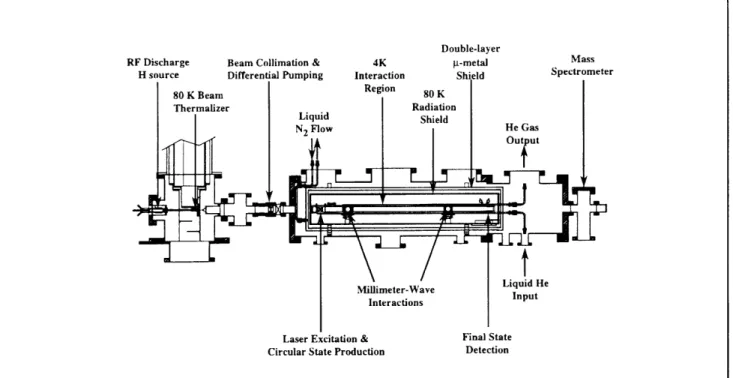
4K Interaction Region Liquid N2 Flow MI , Millimeter-Wave Interactions
Laser Excitation & Circular State Production
Double-layer 4-metal Shield He Gas Ou ut
t
Liquid He Input 80 K Radiation Shield Final State DetectionFigure 4. Main chamber of the atomic beam apparatus. measurement of the Lamb shift. Third is to provide a frequency calibration of the spectrum of hydrogen, enabling the creation of a comprehensive frequency standard extending from the radio fre-quency regime to the ultraviolet.
The experiment employs an atomic beam configura-tion to reduce Doppler and collisional perturbaconfigura-tions. Atomic hydrogen is excited to the low angular momentum n=29, m=0 state by two-photon step-wise absorption. The excited atoms are then trans-ferred to the longer lived n=29, Iml=28 "circular" state by absorption of circularly polarized radio fre-quency radiation.8 The atoms enter a region of uniform electric field in which the frequency of the transition (n=29, lml=28) - (n=30, Iml=29) is mea-sured by the method of separated oscillatory fields. The final state distribution is analyzed by a state-sensitive electric field ionization detector. The reso-nance signal appears as a transfer of atoms from the n=29 state to the n=30 state as the millimeter-wave frequency is tuned across the transition. Figure 4 illustrates the main features of the appa-ratus. Atomic hydrogen or deuterium is dissociated from H2 or D2 in a radio frequency discharge. The
beam is cooled by collisions with a cryogenic thermalizing channel in order to slow the atoms and thereby increase the interaction time. After the
beam is collimated, the atoms pass through two layers of magnetic shielding and an 80 K cryogenic shield before entering the interaction region. The interaction region is logically divided into three regions: (1) the circular state production, (2) sepa-rated fields, and (3) detection. These regions are described briefly below.
In the circular state production region, the hydrogen atoms are excited from the is ground state, through the 2p3/2 state, to the n=29,m=0 state by two-photon stepwise excitation. The optical excitation is per-formed in an electric field to provide selective popu-lation of a particular n=29, m=0 level. The electric field is then rapidly reduced to an intermediate value as the atoms pass through the center of a circle of four electrodes. The antennas are fed by a 2 GHz RF source with a 90 degree phase delay between adjacent pairs. This creates a circularly polarized field which drives the atoms into the n=29, Iml=28 circular state through the absorption of 28 photons. A pulsed electric field ionization
(EFI) detector in the circular state production region monitors the efficiency of the optical excitation and angular momentum transfer processes.
After the atoms are prepared in the n=29 circular state, the beam enters the millimeter-wave sepa-rated fields region. Because Rydberg atoms
8 R. Hulet and D. Kleppner, "Rydberg Atoms in 'Circular' States," Phys. Rev. Lett. 51(16): 1430-1433 (1983).
RF Discharge H source
Beam Collimation & Differential Pumping 80 K Beam Thermalizer M U Mass Spectrometer r
interact strongly with external fields, accurate meas-urement of the energy level structure requires careful control of the interaction environment. Thermal radiation is reduced by cooling the entire interaction region to - 4K with a liquid helium flow system. The ambient magnetic field is reduced by the double-wall high-permeablility shields. A small electric field, which defines the quantization axis of the atoms, is applied with high uniformity by field plates above and below the atomic beam. The millimeter-waves intersect the atomic beam at two locations separated by 50 cm. The millimeter-wave optical system was described in the 1990 RLE
Progress Report.
The state distribution of the atoms emerging from the interaction region is analyzed by a state-selective electric field ionization detector. Within the detector, the atoms enter a region of increasing electric field produced by a pair of symmetric ramped plates held at constant potential. Atoms in different states are selectively ionized at different fields and the charged nuclei are detected at dif-ferent positions. The detection electronics record the state and arrival time of each atom to reach the detector. Because the laser system is pulsed, the time resolution of the ionization signal allows con-tributions to the resonance pattern from each vel-ocity class to be analyzed individually, providing a valuable check on possible systematic errors.
In the 1992 Progress Report, we showed prelimi-nary resonance data. Low signal levels from that generation of the apparatus prompted an extensive redesign phase. In the past year, we have brought the second generation of our apparatus into opera-tion. We have so far seen a factor of 30 increase in the signal rate, and we expect to be able to push that factor up near 100 with some minor improve-ments. Numerous helium-temperature runs have shown that the new system is robust and that the
upgrades were successful.
The new laser system was described in last year's
Progress Report. Briefly, an excimer laser pumps
two identical etalon-narrowed, tunable UV dye lasers. One of these dye lasers produces 1-2 mJ of 366 nm radiation to drive the 2p - n = 29 transi-tion. The second laser receives most of the excimer pump power, and produces 10-15 mJ at
364.5 nm, which is then focussed into a
krypton/argon tripling cell on the vacuum chamber. The resulting Lyman-oc radiation at 121.5 nm drives the is - 2p transition.
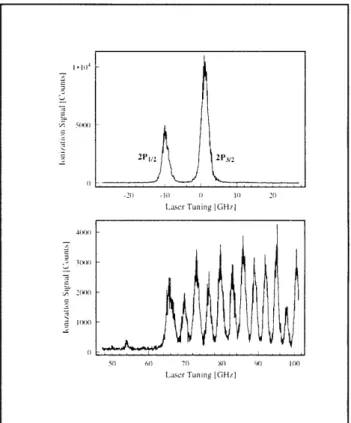
The new dye lasers have shown excellent stability and resolution. In Figure 5 we show scans of each laser, with the other laser fixed on its respective transition. The first scan shows the two fine struc-ture components of the 2p level, with a linewidth on
the tripled beam of 2.1 GHz. The second scan shows the Stark states of the n=29 manifold in an electric field of 75 V/cm. Here the linewidth is approximately 2.5 GHz. To produce the n=29, m=0 initial state, we leave the first laser tuned to the 2P3/2 state and the second laser tuned to the peak on the extreme left of the Stark spectrum.
20 -1i 10 i 20 Laser Tuning [GHzl IOU)) ucxx, SO 60 70 8O Laser Tuning [GHz
Figure 5. Scans of the two lasers used in the stepwise excitation of the n=29, m=O state. Top: Fine structure of the 2p level. Bottom: Beginning of the n=29 manifold in an electric field of 75 V/cm.
The next step in the excitation process is the transfer to the circular state using circularly polarized microwaves, as described above. In this process, the atoms are moved from the short-lived initial state to the long-lived circular state, which can survive the trip through the resonance region with minimal decay. In figure 6 we show signals from the two channels of the electric field ionization detector at the end of the apparatus. In this scan, the bias on the ramped ionization plates is slowly swept from 600 V to 2000 V while the charged nuclei are counted at each of two spatially sepa-rated electron multipliers. This data was taken at a radiation temperature of about 80 K, so we see several neighboring circular states, from n=25 to n=33, populated by thermal transfer. When taking resonance data, the ramped plates are biased at 1050 V so that the detectors are optimized to detect n=30 and n=29 respectively. When the apparatus is cooled with liquid helium, the circular state
dis-214 RLE Progress Report Number 139
tribution becomes concentrated around n=29, with relative peak heights indicating a background radi-ation temperature of 10 K. This is a considerable improvement over the first generation, where radi-ation leaks gave an effective temperature higher than 20 K. The lower background temperature leads to a higher contrast resonance signal.
, 200 0 0400 U 2000 800 1000 1200 1400 1600 1800
Ramp Plate Voltage [+/- V]
Figure 6. Ionization signal on the low-field and high-field electron multipliers as the ionizing field is scanned through the ionization thresholds of circular states of suc-cessive n. The dashed line indicates the normal oper-ating voltage on the ramped ionizing plates.
To find the frequency of the n=29 -- n=30 transi-tion, we measure the population inversion as the millimeter-waves are tuned through resonance. The inversion is defined as
N30 - N
29
I=
N30 + N
2 9
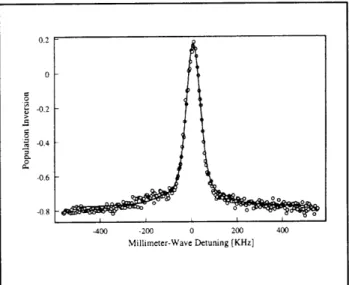
where N29 and N30 are the number of ion counts detected in each electron multiplier. As a prelimi-nary diagnostic step, we can leave open only one of the millimeter-wave ports, in which case the res-onance curve is a single peak as shown in figure 7. This velocity-averaged "Rabi curve" has a linewidth of 80 kHz, in good agreement with the 70 kHz line-width which we predict based on the millimeter-wave spot size and the distribution of atomic velocities. The symmetry on this particular Rabi
curve is an indication that the Gaussian millimeter-wave spot is well defined. We have taken other Rabi curves showing small asymmetries, sug-gesting that we may need to improve the geometry of the millimeter-wave region.
0.2 0 -0.2 m -0.4 0.6 -0.8 -400 -200 0 200 400 Millimeter-Wave Detuning [KHz] Figure 7. port open. lineshape.
Resonance curve with one millimeter-wave Solid line is a fit using the Rabi resonance
If both millimeter-wave ports are open, we see the interference fringe characteristic of the Ramsey separated oscillatory fields technique (figure 8). The Ramsey fringe has a much narrower linewidth than the Rabi curve, on the order of 1 kHz. In order to achieve a precision of 10-11, we must find the line center to 2.5 Hz. This goal should be achievable with our current counting rate of a few kHz.
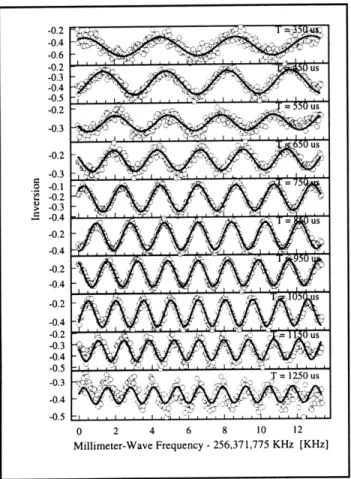
Figure 8 shows a velocity averaged Ramsey signal, but the full power of our apparatus is realized by using the time-of-arrival information recorded for each ion. The interference fringes may then be binned up into different velocity classes, as shown in Figure 9. From this set of data we can extract the (arbitrary) phase shift between the millimeter-wave ports and the true resonance frequency of the transition. We are also able to check that the observed lineshape is consistent with the model
-0.25
-0.35
-0 2 4 6 8 10 12
Millimeter-Wave Frequency -256,371,775 KHz (KHz]
Figure 8. Velocity-averaged Ramsey resonance curve.
-0.2
-0.2 -us -0.3 -0.4 -0.5 -0.2 -0.3 -0.2 -0.3 -0.4 -0.2 >-0.4 -0.2 J -0.4 -0.2 -0.3 -0.4 -0.5 0 2 4 6 8 10 12 Millimeter-Wave Frequency - 256,371,775 KHz [KHz]Figure 9. Ramsey resonance curve binned into velocity
classes. Each plot is labeled with the time-of-flight for the middle of the bin. Solid lines are fits using the Ramsey lineshape for a single velocity.
9 F. DiFilippo, V. Natarajan, M. Bradley, F. Palmer, and D.E. Pritchard, Physica Scripta T59: 144-54 (1995); F. DiFilippo, V. Natarajan,
M. Bradley, F. Palmer, and D.E. Pritchard, in Atomic Physics 14, (New York: American Institute of Physics Press, 1995).
10 F. DiFilippo, V. Natarajan, K. Boyce, and D.E. Pritchard, Phys. Rev. Lett. 73: 1481 (1994).
216 RLE Progress Report Number 139
We are currently taking data using both the Rabi and Ramsey techniques to examine various sys-tematic frequency-shifting effects of our apparatus. Once we fully understand these effects, we should be able to extract the Rydberg constant with an accuracy approaching 10-11.
2.2.1 Publications
Lutwak, R., J. Holley, J. DeVries, T.W. Ducas, and
D. Kleppner. "Millimeter-Wave Measurement of
the Rydberg Frequency." Proceedings of the Fifth Symposium on Frequency Standards and Technology, Woods Hole, Massachusetts, October 15-19, 1995.
Thesis
Lutwak, R. Millimeter-Wave Studies of Hydrogen Rydberg States. Ph.D. diss. Dept. of Phys., MIT, 1997.
2.3
Precision Mass Spectrometry of
Ions
SponsorsJoint Services Electronics Program
Grant DAAH04-95-1-0038
National Science Foundation
Grant PHY95-14795
Project Staff
Michael P. Bradley, Simon Rainville, Roland N. Nguyen, Mark L. Huang, Dr. Fred L. Palmer, Dr. James V. Porto, Daniel J. Ripin, Professor David E.
Pritchard
2.3.1 Overview
We have recently published papers9 which firmly establish our atomic mass measurements as the most accurate in the world. Our mass table con-sists of ten atomic masses of particular importance to physics or metrology.10 The accuracy of these masses, typically 10-10, represents one to three orders of magnitude improvement over previously accepted values. These results represent important
contributions in both fundamental physics and metrology, including:
* Recalibration of the current X-ray wavelength standard by using E = Amc2 to determine the energies of gamma rays from neutron capture by 14N, which are widely used as gamma ray calibration lines from a measurement of the associated mass difference.
* Creating an atomic standard of mass by replacing the "artifact" kilogram mass standard with a crystal of pure silicon, a procedure that depends on our accurate determination of the atomic weight of 28Si.
This year we have continued to develop new hard-ware and new techniques that will improve the accuracy and versatility of our apparatus. These include methods for loading a wider variety of ions into the trap, improvements to the ion detector and development of hardware and software needed to directly control the amplitude and phase of the ions' magnetron orbits. The loading technique has been able to produce, trap and detect condensable species, as demonstrated by the detection of triply charged Cs... ions. We have upgraded our single ion detector, replacing the rf squid with a dc squid, and have demonstrated at least a factor of 10 less instrumental noise. This improvement should allow us to circumvent some of the thermal noise in the detector, which is now the dominant source of detector noise, and may make it possible to measure and reduce the thermal motion of a single ion.
These improvements, along with our recent demon-stration of a technique for comparing two simultane-ously trapped ions (to eliminate the problems due to field drift), and the demonstration of a squeezing technique to reduce the influence of thermal noise on the measurements, open the door to another dramatic improvement in mass resolution that would allow:
* Determination of excitation and binding ener-gies of atomic and molecular ions by weighing the associated small decrease in mass, Am = EbidC2 (we must reach our ultimate goal
of a few times 10-12 to make this a generally useful technique).
* Determination of the fine structure constant and the molar Planck constant NAh by weighing
neutron capture y-rays of silicon or sulfur, whose wavelengths will be measured by a NIST group.
* A potentially very accurate determination of the fine structure constant and the molar Planck constant, NAh, by measuring the atomic mass whose recoil velocity has been measured after the absorption of photons of known wave-length.
* Measurement of the 3H - 3He mass difference, important in ongoing experiments to determine the electron neutrino rest mass.
2.3.2 Technique
Our experimental approach is to measure ion cyclotron resonance on a single molecular or atomic ion in a Penning trap, a highly uniform mag-netic field in which confinement along the magmag-netic field lines is provided by much weaker electric fields. We monitor the ion's axial oscillation by detecting the currents induced in the trap electrodes using ultrasensitive superconducting electronics developed for this application." This work in trap-ping and precision resonance draws on techniques developed by Hans Dehmelt at the University of Washington and Norman Ramsey at Harvard Uni-versity, for which they shared in the 1989 Nobel Prize.
We have developed techniques for driving, cooling, and measuring the frequencies of all three normal modes of ion motion in a Penning trap. Thus we can manipulate the ion position reproducibly to within 30 microns of the center of the trap, cor-recting for electrostatic shifts in the cyclotron fre-quency to great accuracy. We use a Tr-pulse
method to coherently swap the phase and action of the cyclotron and axial modes.12 Therefore,
although we detect only the axial motion directly, we determine cyclotron frequency by measuring the phase accumulated in the cyclotron motion in a known time interval. We can measure the phase of the cyclotron motion to within 10 degrees, leading to a precision of 10-10 for a one minute measure-ment. Our entire ion-making process is fully auto-mated, and the computer can cycle from an empty trap to having a cooled single ion in about three minutes under optimal conditions.
11 R. Weisskoff, G. Lafyatis, K. Boyce, E. Cornell, R. Flanagan, Jr., and D.E. Pritchard, J. Appl. Phys. 63: 4599 (1988)
Careful shimming of the electric and magnetic fields allows us to keep our systematic errors below
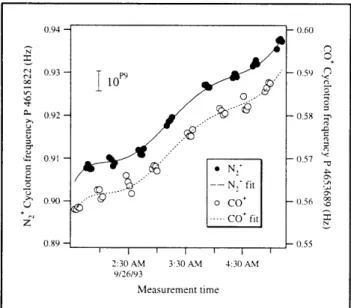
5 X10-11, but unfortunately, the typical statistical fluctuation in our magnetic field between measure-ments is 2.4 X 10- 10. Thus even with the ability to achieve -20 alternate loadings of two different ions in one night, our overall accuracy is at best 8X10-11 (see figure 10). We have found that the distribution of field variation is not Gaussian, but rather has too many outlying points. This has led us to use a generalization of least squares fitting called robust statistics in which a "Hampel estimate" is used to deweight outlying points in a manner determined by the observed excess number of outliers. This has eliminated arbitrary decisions about dropping "bad points" from our data sets and has increased the stability of our fits.
0.94 - - 0.60 0.93- 0 59 10 0.92 - 0.58 0.91- 0.57 N, J N fit 0.0- So CO+ Oci6.56 ... CO fit 0.89 0.55 2:30 AM 3:30 AM 4:30 AM 9/26/93 Measurement time
Figure 10. Typical data for an ion mass ratio
measure-ment. The cyclotron frequency is measured alternately for the two ions in order to fit to the field drift and to determine the mass ratio.
We have performed a wide variety of stringent checks for systematic errors. In fact, every mass in the table has been obtained from at least two inde-pendent sets of mass ratios. Several of the checks employ our new technique for comparison of non-doublets,13
pairs of ions whose nominal mass to charge ratios are unequal. This technique repres-ents a significant advance in precision mass spectrometry since it allows us to obtain absolute masses by direct comparison to carbon, which is defined to have an atomic mass of exactly 12. It
also provides an absolute check of our accuracy by allowing measurements that should verify known ratios such as Nj/N+ and Ar+/Ar++. We have
com-pared CD, and CD to C to obtain two independent determinations of the atomic weight of deuterium. The results are consistent with the values for the hydrogen masses we obtained from conventional doublet measurements. An extensive series of checks using only doublet ratios was also per-formed. These include repeated checks of identical ratios (both before and after significant reduction of our field inhomogeneities), checks of circular ratios (e.g., A/B, B/C, and C/A), and checks of related ratios (e.g., CO/N2 and C0 2/N20). The consistency
of all these checks practically guarantees that our errors are within the quoted limits.
2.3.3 Recent Progress
We have made major advances toward our long term goal of improving our accuracy by more than an order of magnitude, which will be achieved by measuring the cyclotron frequencies of two ions trapped in the same field at the same time to elimi-nate the problem of field fluctuations, and by using squeezing techniques to reduce thermal noise. We have modified our apparatus to allow excitation and detection of two ions at the same time, and demon-strated the capability of two ion measurements to reduce the effects of field fluctuations and expanded our previous theoretical understanding14
of two ion dynamics to include the effects of minute imperfections in the trapping fields, identified partic-ular magnetron orbits where these effects are mini-mized, and developed hardware and software to place ions in those orbits. This year we have con-sidered a related possibility: placing two ions in two closely adjacent traps. This approach would cir-cumvent the above-mentioned problems occurring when placing them in the same trap, at the sacrifice of requiring shielding against differential fields at the two traps. We have investigated and modeled methods for swapping the ions between the two traps, evaluated the leading sources of error, and designed an arrangement of superconducting coils that will prevent the magnetic fields in the two traps from fluctuating differentially. Even if we run into unexpected problems simultaneously detecting two ions in separate traps, we can use one of the traps as a "holding tank" for the ion of a pair which is not being measured. This would significantly decrease
the time between measurements and would
13 V. Natarajan, K. Boyce, F. DiFilippo, and D. E. Pritchard, Phys. Rev. Lett. 71: 1998 (1993).
14 E.A. Cornell, K. Boyce, D.L.K. Fygenson, and D.E. Pritchard, Phys. Rev. A 45: 3049 (1992).
increase the measurement rate by as much as a factor of four, decreasing our statistical uncertainty by more than the factor of 2 expected from statis-tics alone due to the reduction of the size of field fluctuations in the shortened time between mea-surements. The holding tank would also be useful for measurements of radioactive ions such as 3H,
since it would dramatically decrease the dose of radioactive material that the trap would receive. With either two ion scheme, the primary source of measurement error will be the special relativistic mass shift due to thermal fluctuations in cyclotron amplitude. We have proposed several methods of classical squeezing with parametric drives to reduce amplitude fluctuations,1' and demonstrated the sim-plest of these,16
reducing thermal noise by about a factor of two.
2.3.4 Publications
DiFilippo, F., V. Natarajan, M. Bradley, F. Palmer, and D.E. Pritchard. "Accurate Atomic Mass Measurements from Penning Trap Mass Com-parisons of Individual Ions." Physica Scripta
T59: 144-54 (1995).
DiFilippo, F., V. Natarajan, M. Bradley, F. Palmer, and D.E. Pritchard. "Accurate Atomic Mass Measurements from Penning Trap Mass Com-parisons of Individual Ions." In Atomic Physics
14, New York: American Institute of Physics,
1995.
Natarajan, V., F. DiFilipp "Squeezed States of Penning Trap." Phys
(1995).
o, and D.E. Pritchard. Classical Motion in a
. Rev. Lett. 74: 2855
2.4 Atom Interferometry
Sponsors
Charles S. Draper Laboratory Contract DL-H-484775
Joint Services Electronics Program Grant DAAH04-95-1-0038 National Science Foundation
Grant PHY95-14795 U.S. Army Research Office
Contract DAAH04-94-G-0170
Contract DAAH04-95-1-0533 U.S. Navy - Office of Navel Research
Contract N00014-89-J-1207 Contract N000014-96-1-0432
Project Staff
Troy D. Hammond, Edward T. Smith, Richard A. Rubenstein, David A. Kokorowski, Tony Roberts, Huan Yao, Dr. Al-Amin Dhirani, Professor David E. Pritchard
2.4.1 Overview
Atom interferometers, in which atom or molecule de Broglie waves are coherently split and then recom-bined to produce interference fringes, have opened up exciting new possibilities for precision and fun-damental measurements with complex particles. The ability to accurately measure interactions that displace the de Broglie wave phase has led to qual-itatively new measurements in atomic and molec-ular physics, fundamental tests of quantum mechanics, and new ways to measure acceleration and rotation:
Atom interferometers permit completely new investigations of atoms and molecules including precision measurements of atomic polarizabil-ities that test atomic structure models, deter-mination of long range forces important in cold collisions and Bose-Einstein condensation, and measurements of molecular polarizability tensor components.
* Atom interferometers can make fundamental investigations in quantum mechanics. These include measurements of topological and geometric phases, loss of coherence from a reservoir, quantum measurement, and investi-gations of multiparticle interferometry and entanglement.
* The large mass and low velocities of atoms makes atom interferometers especially useful in inertial sensing applications, both as precision accelerometers and as gyroscopes. They have a potential sensitivity to rotations - 1010 greater than in optical interferometers of the same area.
* Atom interferometers may have significant applications to condensed matter physics,
15 F. DiFilippo, V. Natarajan, K. Boyce, and D.E. Pritchard, Phys. Rev. Lett. 68: 2859 (1992). 16 V. Natarajan, F. DiFilippo, and D.E. Pritchard, Phys. Rev. Lett. 74 2855 (1995).
including measurements of atom-surface inter-actions and lithography using coherently manipulated fringe patterns that are directly deposited onto substrates.
Atomic clocks are essentially sensitive longi-tudinal atom interferometers, capable of easily measuring phase shifts due velocity changes of
1 part in 1010.
Our group has pioneered many of these areas, including the first (and only) atom interferometry experiments that employ physically separated paths to make precision measurements. These investi-gations have proved to be of wide-spread general interest to the scientific community. The popular scientific press has written several articles about our research.17
During 1996, we have made significant progress towards our long term goal of developing further applications and expanding the intrinsic capabilities of atom interferometers. In particular, we have demonstrated the remarkable sensitivity of atom interferometers to rotation sensing, developed the theory and new potential applications for a longi-tudinal interferometer, and begun major improve-ments to our apparatus by incorporating smaller period matter wave gratings mounted on a special vibration-free platform and rebuilding the vacuum envelop to achieve greater length and reduced con-tamination.
2.4.2 Rotation Sensing
Experiments have been performed to measure both the interferometer's response to rotations as well as its rotational noise, demonstrating the inherent sen-sitivity of matter-wave interferometers to inertial effects.18 Small rotations of a few earthrates (earthrate, Qe = 7.3X10⁻⁵ rad/sec) or less were applied to the apparatus, and the resulting
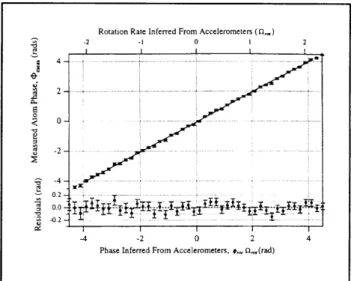
interfer-ometer phase measured. Since the interferinterfer-ometer has a linear phase response to rotations, a rotation rate was easily inferred and compared to the rota-tion rate determined from two accelerometers attached to the vacuum housing of our apparatus.
A comparison was then made for rotation ampli-tudes ranging from -2 to +2 Qe, and plotted in figure
11.
Rotation Rate Inferred From Accelerometers (l,,,)
2 0 2 4-2 2 S 0 2 --4 _01
Figure 11. A plot of the measured interferometer phase,
#meas,
verses the inferred phase from the acceler-ometer readings, Orot, from a combination of 20 second runs totaling approximately 400 seconds of data(- 10 sec of data per point). There is a 0.8 percent dif-ference between these measurements with a total error of 1 percent.
We have shown the response to be within 1 percent of theory. Rotational noise was shot-noise limited for short times and was measured to be 40
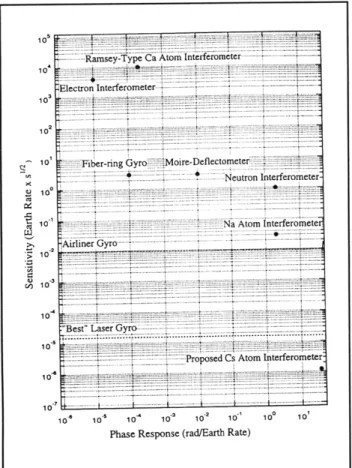
Qe in one second, three orders of magnitude better than previous measurements using atom interfer-ometers. This demonstrates the promise of atom interferometers for inertial navigation systems and other demanding applications (see figure 12).
17 Articles on recent work performed by our interferometer group: J. Maddox, Nature, (1995); I. Peterson, Sci. News (1995); P. Yam, Sci. Am. (1995); R. Pool, Sci. (1995); S. Werner, Phys. World (1995); B. Levi, Phys. Today (1995); P. Schewe and B. Stein, A/P
Phys. Bull. Phys. News, (1996); M. Browne, "It's a Molecule. No, it's more like a wave." N.Y. Times (Science Section), August 15,
1995.
18 A. Lenef, T.D. Hammond, E.T. Smith, M.S. Chapman, R.A. Rubenstein, and D. E. Pritchard, "Rotation Sensing with an Atom Interfer-ometer," Phys. Rev. Lett., forthcoming.
220 RLE Progress Report Number 139
. . ... i t ... . ... * "
... ... .. . ... . . ... ... .. ...... .... .... ... .. ., ... ....
.... .. .i .... ... - ...-- .. ... .... ...
Ii
.ii i! :. !!!!:!!!!!!!! iiii ! ii!'i:; ! ibe-igG : :: :: !! !!!!!!!!! r ::! :::: i!!!!q4ii , D l ct i!!!!! itiiiiiiiiii:'i'ii!!!!:!:! !!::: ::::: :: ::: ::::: ::: ::::::::::::::::
_A .y ro ----... i -. -- -- -..-- ---- - . . . . i ... ...... ....... -. .. .... .. .. ... .... :::::::::::::::~:::::::::::::-::: ... .. :::-... .. ...i . ... ... ... .: ... ..... ... z~,,.-Electron lnterfeometera wlll ... ... -- --- 4 - .. - ... ... ... ... . ... .. .. ... .... ... ... ... ... .... .... ... ... .. ... ... ... ... ... .
il2'E 5iifj !iii~iEi -E -- !:ii .. ... ... ... ... ... ... . .. .- . .... . ... .. ... ...- :!!!ii !!ii iiii!i ![ iiE!! ::E;!! !!!Ei!i--:E:. ... ... ... ... .. ... ... ... . ... .. .... ... ... .... ... .. ---..--- -... ... -. i.-
.--S... | ... ... -- ...-... .... ... ....
-,: : --::Fi errn GyrGr:::::f:!::::!.Moire-Deflecometer-.:::":: :::.-W:::**:::"::::": ...i... ... ...
...
~.. ~~
....-... ... ... ... .. ... Netro
Interferometer-... .. - -- ;-- --- -- c
.. ... - -....
10" 10" . 10-4- 10... 0" 10
Phase Response (rad/Earth Rate)
Figure 12. A comparison of the inertial sensitivity of the
current Na and proposed Cs atom interferometers with other technologies.
2.4.3 Longitudinal
Atom
Interferometry
In interferometry, the various "paths" traversed by waves evolve different phases and produce fringes. This may be accomplished by keeping the wave-length the same but introducing differences in the path lengths, as we have demonstrated in our sep-arated path atom interferometer. However, one may also envision keeping the path the same but placing each particle in a superposition of two different vel-ocity states, thus constructing a "longitudinal inter-ferometer." Over the past year, we have worked out a theory generalizing Norman Ramsey's Nobel prize winning method of separated oscillatory fields, demonstrating that is in fact such an interferometer. This leads to several new applications in longi-tudinal interferometry, as described below, as well as potential improvements to the most well known application of using atomic clocks as frequency standards.
2.4.4
Improvements
to the Apparatus
We have made and are continuing to make several important improvements to our apparatus. Collab-orating with Professor Henry I. Smith's group at MIT to fabricate improved atom transmission gratings using holographic lithography, we have demon-strated atom interference fringes (unfortunately with low contrast) using 100 nm period gratings. These gratings give twice the beam separation of our standard 200 nm gratings. We have also signif-icantly upgraded our apparatus. The separated beam atom optical elements have been placed on a platform separate from the vacuum envelop which
should substantially improve the thermal and vibra-tion isolavibra-tion of the interferometer. The vacuum envelop itself has been replaced by a series of standard six-way crosses, facilitating access to the equipment inside the chamber and the rapid recon-figuration of modular flanges which currently hold the atom optical elements for a longitudinal
interfer-ometer. The new apparatus should be very stable and allow the multitasking of a wide variety of dif-ferent experiments.
2.4.5 Ongoing Investigations
Velocity dependent index of refraction.
The
physical separation of beam paths in our interfer-ometer permits both amplitude and phase changes in the interference pattern to be observed as one of the interfering atom beams is exposed to some interaction. Using this capability, we recently per-formed an experiment measuring the index of refraction of various gases and hence the role of
atom-atom interactions in collisions.19 We are
cur-rently extending this experiment to probe for vel-ocity dependencies. There is significant interest in the theoretical community in such results as the
interactions are determined by the long range behavior of the atomic potentials; for example, it is predicted that the index of refraction should exhibit Glory oscillations as the velocity of the impinging gas is varied.
Quantum decoherence. Scattering photons from the atom while it is inside the interferometer causes the atoms to change their state. We believe that under suitable conditions, this will not destroy the quantum coherence but rather will cause the atoms to diffuse in momentum space. This experiment is
19 J. Schmiedmayer, M.S. Chapman, C.R. Ekstrom, T.D. Hammond, S. Wehinger, and D.E. Pritchard, "Index of refraction of various gases for sodium matter waves," Phys. Rev. Lett. 74: 1043 (1995).
significant since it generalizes our recent realization of Feynman's gedanken experiment20
in which decoherence from single photon scattering was measured and then recovered. Also, quantum deco-herence is just becoming accessible to study as an important experimental barrier to constructing quantum computers.
Longitudinal interferometry. The extension of atom interferometry to include longitudinal coherencies represents an exciting frontier. Longi-tudinal interferometers are extraordinarily sensitive to differential changes in velocity of the atom beam (hence the application to atomic clocks) and naturally lend themselves to analogs of several classic transverse interferometer experiments. Examples include quantum tomography of either artificially imposed or naturally occurring corre-lations in an atom beam as well as studies of a wide range of intriguing time-dependent inter-actions, including forces which differentially alter the state of atoms in the two legs of the interferometer. One of these, the velocity dependent Anandan force,21 that arises when a quantum dipole passes through a region of uniform electric and magnetic field, is the subject of considerable theoretical debate.
Geometric Phases. Precision measurements of the Aharonov-Casher (AC) phase are planned. This will allow a study of the dependence on the interfering particle's dipole orientation for the first time. Modifications made to our interaction region (a device which allows different potentials to be applied to either arm of the interferometer) to intro-duce spatially varying magnetic fields which will permit investigation of Berry's phase as well.
2.4.6 Publications
Chapman, M.S., and D.E. Pritchard, "Taking the Gedanken Out of a Feynman Gedanken Exper-iment." IEEE LEOS Newsletter 10: 10 (1996). Pritchard, D.E., M.S. Chapman, T.D. Hammond,
D.A. Kokorowski, A. Lenef, R.A. Rubenstein, E.T. Smith, and J. Schmiedmayer. "Atom
Inter-ferometers and Atomic Coherence." Paper pub-lished in Proceedings of the 15th International
Conference on Atomic Physics Zeeman-Effect Centenary, Amsterdam, The Netherlands, August 5-9, 1996.
Schmiedmayer, J., M.S. Chapman, C.R. Ekstrom, T.D. Hammond, A. Lenef, R.A. Rubenstein, E.T. Smith, and D.E. Pritchard. "Optics and Interfero-metry with Atoms and Molecules." Atom
Inter-ferometry, Advances in Atomic and Molecular Physics, Supplement 3. Ed. Paul R. Berman.
San Diego, California: Academic Press, 1996.
Thesis
Hammond, T.D. Dispersive Index of Refraction and
Rotation Induced Phase Shifts for Matter Waves. Ph.D. diss., Dept. of Physics, MIT, 1996.
2.5 Cooling and Trapping Neutral
Atoms
Sponsors
David and Lucile Packard Foundation Grant 96-5158
National Science Foundation Grant PHY95-01984
U.S. Army - Office of Research U.S. Navy - Office of Naval Research
Contract N00014-96-1-0485, AASERT N00014-94-1-0807
Project Staff
Professor Wolfgang Ketterle, Dr. Hans-Joachim
Miesner, Dr. Christopher G. Townsend, Dr.
Nicolaas J. van Druten, Michael R. Andrews, Dallin S. Durfee, Shin Inouye, Christopher E. Kuklewicz, Dan M. Kurn, Marc-O. Mewes
2.5.1 Introduction
The observation of Bose-Einstein condensation
20 M.S. Chapman, T.D. Hammond, A. Lenef, J. Schmiedmayer, R.A. Rubenstein, E.T. Smith, D.E. Pritchard, "Photon Scattering from
Atoms in an Atom Interferometer: Coherence Lost and Regained," Phys. Rev. Lett. 75: 3783 (1995); R. Feynman, R. Leighton, and M. Sands, "The Feynman Lecture Notes," Vol. 3 (Reading, Massachusetts: Addison-Wesley Publishing, 1966).
21 J. Anandan, Phys. Rev. Lett. 48: 1660 (1982).
(BEC)22 has opened up a new subfield of physics: the study of degenerate quantum gases. Such macroscopic dilute quantum systems offer intriguing possibilities for further research. They are pre-dicted to (1) show superfluidity and other manifesta-tions of coherent behavior, and (2) become a testbed for many-particle theories and thermo-dynamics in well-isolated finite systems. Coherent beams of atoms ("atom lasers") are likely to find use in a variety of applications, e.g., atom interfero-metry, precision measurements, and atom optics. Our research in the past year has focused on improving the production and observation of Bose condensates and on studying some of their proper-ties.
2.5.2 Cloverleaf Magnetic Trap
The magnetic traps used in 1995 in BEC exper-iments had major disadvantages or limitations such as the time-dependent rotating field of the TOP trap,23 the inflexibility of a permanent magnet trap,24 the complications of having two condensates in the optically plugged trap,25 or the restrictions of a cryogenic environment necessary for supercon-ducting coils. 26 In March 1996, we achieved BEC in
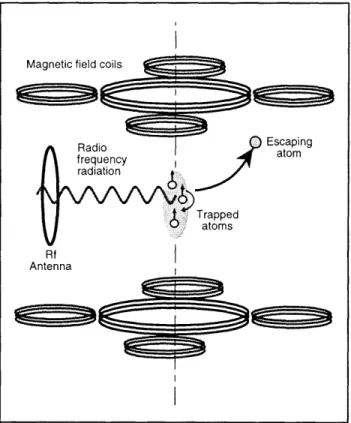
a novel "cloverleaf" magnetic trap27 which overcame those limitations (figure 13). This trap, which used dc electromagnets, had excellent optical access and allowed independent control over the axial and radial confinement. It is a variant of the loffe-Pritchard trap: the coils providing the radial gradient surround the two axial coils (the so-called pinch coils) in the form of a cloverleaf. If a loffe-Pritchard trap is operated at very low bias field, it provides tighter confinement than the TOP trap.27
Magnetic field coils
Radio Escaping frequency atom radiation Trapped
atoms
Rf AntennaFigure 13. Experimental setup for cooling atoms to Bose-Einstein condensation. Sodium atoms are trapped in a cloverleaf magnetic trap. Evaporative cooling is con-trolled by radio-frequency radiation from an antenna. The rf selectively flips the spins of the most energetic atoms. The remaining atoms rethermalize (at a lower temper-ature) by collisions among themselves. Evaporative cooling is forced by lowering the rf frequency.
In the last few years, much effort went into the development of novel atom traps. It is somewhat surprising that the most suitable magnetic trap for
BEC is an optimization of the configuration sug-gested already in 1983,28 which was used in the
22 M.H. Anderson, J.R. Ensher, M.R. Matthews, C.E. Wieman, and E.A. Cornell, Sci. 269: 198 (1995); K.B. Davis, M.-O. Mewes, M.R. Andrews, N.J. van Druten, D.S. Durfee, D.M. Kurn, and W. Ketterle, Phys. Rev. Lett. 75: 3969 (1995); C.C. Bradley, C.A. Sackett, and R.G. Hulet, Phys. Rev. Lett. 78: 985 (1997); See also: C.C. Bradley, C.A. Sackett, J.J. Toilet, and R.G. Hulet, Phys. Rev. Lett. 75: 1687 (1995).
23 M.H. Anderson, J.R. Ensher, M.R. Matthews, C.E. Wieman, and E.A. Cornell, Sci. 269: 198 (1995).
24 C.C. Bradley, C.A. Sackett, and R.G. Hulet, Phys. Rev. Lett. 78:985 (1997); see also: C.C. Bradley, C.A. Sackett, J.J. Toilet, and R.G. Hulet, Phys. Rev. Lett. 75: 1687 (1995).
25 K.B. Davis, M.-O. Mewes, M.R. Andrews, N.J. van Druten, D.S. Durfee, D.M. Kurn, and W. Ketterle, Phys. Rev. Lett. 75: 3969 (1995).
26 H. Hess, G.P. Kochanski, J.M. Doyle, N. Masuhara, D. Kleppner, and T.J. Greytak, Phys. Rev. Lett. 59: 672 (1987); R. van Roijen,
J.J. Berkhout, S. Jaakkola, and J.T.M. Walraven, Phys. Rev. Lett. 61: 931 (1988).
27 M.-O. Mewes, M.R. Andrews, N.J. van Druten, D.M. Kurn, D.S. Durfee, and W. Ketterle, Phys. Rev. Lett. 77: 416 (1996).
Figure 14. First direct observation of a Bose condensate of magnetically-trapped atoms. The figures show clouds with a condensate fraction that is increasing from close to
0 percent (left) to almost 100 percent (right). late 1980s
hydrogen.3° for trapping sodium
29 and atomic
29 V.S. Bagnato, G.P. Lafyatis, A.G. Martin, E.L. Raab, R.N. Ahmad-Bitar, and D.E. Pritchard, Phys. Rev. Lett. 58: 2194 (1987).
30 H. Hess, G.P. Kochanski, J.M. Doyle, N. Masuhara, D. Kleppner, and T.J. Greytak, Phys. Rev. Lett. 59: 672 (1987). R. van Roijen, J.J. Berkhout, S. Jaakkola, and J.T.M. Walraven, Phys. Rev. Lett. 61: 931 (1988).
31 M.-0. Mewes, M.R. Andrews, N.J. van Druten, D.M. Kurn, D.S. Durfee, and W. Ketterle, Phys. Rev. Lett. 77: 416 (1996).
32 K. Huang, Statistical Mechanics, 2nd ed. (New York: Wiley, 1987).
33 M.R. Andrews, M.-O. Mewes, N.J. van Druten, D.S. Durfee, D.M. Kurn, and W. Ketterle, Sci. 273: 84 (1996).
224 RLE Progress Report Number 139
2.5.3 Study of the Phase Transition
In 1995, we studied several properties of Bose
con-densates. By evaluating time-of-flight images, we determined the total number of atoms, the con-densed fraction No/N, the internal energy of the condensate, and the temperature T. Below the crit-ical temperature To, the condensate fraction was predicted to vary as No/N = 1 - (T/To)3, in agreement with our results. Furthermore, we could verify that the internal energy of a Bose condensate scales with the number of condensed atoms as N 5.3 1
2.5.4 Non-destructive Imaging of a Bose Condensate
The first BEC experiments were done by switching off the trap and imaging an expanding condensate. This technique is necessarily destructive and probes the condensation phenomenon only in momentum space. However, in an inhomogeneous potential, e.g., in atom traps, the condensate and the normal fraction of a Bose gas are spatially sep-arated.32 Using dispersive imaging, we have observed a spatially localized condensate.33 Dispersive imaging collects the elastically scattered photons, in contrast to absorption imaging which maps out the spatial distribution of absorbed photons. The scattered photons can be separated from the incident light in the Fourier transform plane of the imaging system by spatial filtering.
Figure 14 shows dark ground images taken around and below the BEC phase transition. It shows the growth of the condensed fraction inside the satu-rated Bose gas. Dispersive imaging is non-dissipative and does not heat up the condensate. More recently, we took ten successive images of the same condensate and observed its formation. This real-time observation of dynamical processes will play an important role in future studies of BEC.
2.5.5 Study of Collective Excitations
Bose condensates are predicted to show superflu-idity. As a first step towards the study of dynamic properties of a Bose condensate, we investigated its low energy collective excitations,34 contempor-aneously with a similar study undertaken at Boulder.35 Collective modes were excited by intro-ducing a small time-dependent modulation in the trapping potential for a short period of time. When the perturbation was removed, the condensate was allowed to oscillate for a chosen time and then released into ballistic expansion. The oscillatory behavior of the condensate was thus detected in velocity-space as shape oscillations in time-of-flight pictures (figure 15). The observed frequencies were in excellent agreement with the predictions of mean field theory, which is one of the most accu-rate tests of this theory.36 The nature of the damping is not yet understood, requiring more the-oretical and experimental work.
0.40-. 0.35-. 0.30-0.25 0 50 160 150 Delay Time [ms] 200 250
Figure 15. Collective oscillations of a Bose condensate.
These oscillations correspond to standing sound waves.
2.5.6 An Output Coupler for Bose Condensed Atoms
The observations of BEC have stimulated interest in an atom laser, a coherent source of atomic matter waves. The build-up of atoms in the ground state of a magnetic trap is analogous to stimulated emission into a single mode of an optical laser. An important element of a laser is an output coupler, which provides a controlled way of generating a coherent propagating beam. We have been able to demonstrate a scheme for doing this with Bose condensed atoms.37 A variable fraction of atoms was extracted coherently from the condensate by applying rf radiation to the cloud, thereby coupling atoms to untrapped hyperfine states (figure 16).
0.00 0.25 0.50
Rf Amplitude [Gauss]
Figure 16. Fraction of atoms remaining trapped after the
rf pulse which couples atoms out of the magnetic trap. The population undergoes Rabi oscillations. The solid
line is the theoretical prediction.
2.5.7 Observation of Interference Between Two Bose Condensates
The spatial coherence of a Bose condensate was demonstrated by observing interference between two Bose condensates.38 They were created by evaporatively cooling sodium atoms in a double-well potential formed by magnetic and optical forces. High-contrast matter-wave interference fringes with a period of 15 micrometer were observed after
34 M.-O. Mewes, M.R. Andrews, N.J. van Druten, D.M. Kurn, D.S. (1996).
Durfee, C.G. Townsend, and W. Ketterle, Phys. Rev. Lett. 77: 988
35 D.S. Jin, J.R. Ensher, M.R. Matthews, C.E. Wieman, and E.A. Cornell, Phys. Rev. Lett. 77: 420 (1996).
36 M.-O. Mewes, M.R. Andrews, N.J. van Druten, D.M. Kurn, D.S. Durfee, C.G. Townsend, and W. Ketterle, Phys. Rev. Lett. 77: 988 (1996).
37 M.-O. Mewes, M.R. Andrews, D.M. Kurn, D.S. Durfee, C.G. Townsend, and W. Ketterle, Phys. Rev. Lett. 78, 582 (1997). 38 M.R. Andrews, C.G. Townsend, H.-J. Miesner, D.S. Durfee, D.M. Kurn, and W. Ketterle, Sci. 275: 637 (1997).