Publisher’s version / Version de l'éditeur:
Vous avez des questions? Nous pouvons vous aider. Pour communiquer directement avec un auteur, consultez la première page de la revue dans laquelle son article a été publié afin de trouver ses coordonnées. Si vous n’arrivez pas à les repérer, communiquez avec nous à PublicationsArchive-ArchivesPublications@nrc-cnrc.gc.ca.
Questions? Contact the NRC Publications Archive team at
PublicationsArchive-ArchivesPublications@nrc-cnrc.gc.ca. If you wish to email the authors directly, please see the first page of the publication for their contact information.
https://publications-cnrc.canada.ca/fra/droits
L’accès à ce site Web et l’utilisation de son contenu sont assujettis aux conditions présentées dans le site LISEZ CES CONDITIONS ATTENTIVEMENT AVANT D’UTILISER CE SITE WEB.
Combustion Institute Canadian Section, 2008 Spring Technical Meeting
[Proceedings], 2008
READ THESE TERMS AND CONDITIONS CAREFULLY BEFORE USING THIS WEBSITE.
https://nrc-publications.canada.ca/eng/copyright
NRC Publications Archive Record / Notice des Archives des publications du CNRC : https://nrc-publications.canada.ca/eng/view/object/?id=de8f8e1e-8ebf-437d-96f7-dca93eb5d19d https://publications-cnrc.canada.ca/fra/voir/objet/?id=de8f8e1e-8ebf-437d-96f7-dca93eb5d19d
NRC Publications Archive
Archives des publications du CNRC
This publication could be one of several versions: author’s original, accepted manuscript or the publisher’s version. / La version de cette publication peut être l’une des suivantes : la version prépublication de l’auteur, la version acceptée du manuscrit ou la version de l’éditeur.
Access and use of this website and the material on it are subject to the Terms and Conditions set forth at
Measuring optical properties of cooled soot
_____________________________________________ Proceedings of Combustion Institute – Canadian Section Spring Technical Meeting University of Toronto, Ontario May 12-14, 2008
Measuring optical properties of cooled soot
A.R. Coderre
a, K.A. Thomson
b, D.R. Snelling
b, M.R. Johnson
a* aMechanical and Aerospace Engineering, Carleton University, Ottawa, Canada
b
Combustion Group, Institute for Chemical Process & Environmental Tech., NRC
1. Introduction
Optical methods for the measurement of flame-generated particulates have gained popularity in the combustion community because of their high accuracy and non-intrusive nature. Specifically, laser-induced incandescence (LII) has enjoyed a rise in worldwide attention as an effective means of obtaining the soot volume fraction (SVF) within flames. However, for soot sampled well post-flame, optical methods become significantly less accurate. The accuracy of such diagnostics is limited by the accuracy to which the optical properties of the soot under study are known. These properties have been studied at some length, using various fuels at many conditions, often with conflicting results. It is therefore postulated that there may be some significant variation in the optical properties as the soot is allowed to age and cool in the exhaust stream. Interestingly, most work done to evaluate optical properties of soot have been done in-flame or immediately post-flame, thus there is a need to extend such measurements to far post-flame or ‘cold soot’ conditions.
Methods used previously to obtain optical properties vary widely [1-6]. Many of the values found in the literature are used generically, despite the specific nature of the experiments used to obtain these data. What these methods share, however, is that the soot under study was collected in-flame or shortly post-flame where the stream was still at elevated temperatures. The goal of the present work is to instead study cooled soot, which relates to many practical applications such as tailpipe emissions or atmospheric measurements.
2. Methodology
Soot optical properties were determined by calibrating optical extinction measurements with non-optical extractive methods, similar to the work of Krishnan et al. [4] and Choi et al. [5]. The goal of the experiments was to determine the soot absorption function, E(m)λ, as a function of wavelength, for cooled soot from a methane flame.
Soot is well-described as a mass fractal, where the number of primary particles (spherules) per aggregate, N, is related to aggregate size by the following equation [eg. 7, 8]:
,
2
Df p g fd
R
k
N
⎟
⎟
⎠
⎞
⎜
⎜
⎝
⎛
=
(1)
where Rg is the radius of gyration of the aggregate, dp is the primary particle diameter, kf is the so-called fractal
prefactor, and Df is the fractal dimension. The relationship among extinction, absorption, and scatter for soot fractal
aggregates made up of primary particles that fall in the Rayleigh range (i.e., π dp/λ < 0.3), is well predicted by
RDG-PFA theory (e.g., [8-11]). From RDG-RDG-PFA theory, soot concentration is related to the extinction coefficient by the following formula:
*
( )
(
sa ,)
( )
,
6
1
e vK
f
E m
λ λ λλ
π
ρ
=
+
(2a)
where fv is the SVF, ρsa,λ is the ratio of total scattering to absorption, λ is the wavelength of the light being
attenuated, and Kλ(e) is the line-integrated extinction coefficient. ρsa,λ can be calculated from RDG-PFA theory,
which requires knowledge of the soot morphology (N, dp, kf, Df). Scattering and absorption each scale with their
respective refractive index functions, E(m) and F(m) [8], although this dependence appears only as a ratio in ρsa,λ. Krishnan et al. have developed a correlation of F(m)/E(m) with wavelength [4], and this correlation is used here.
Rearranging Equation (2a) to instead solve for E(m)λ, the following expression is obtained,
v sa e
f
K
m
E
)
1
(
6
)
(
, ) ( λ λ λπ
ρ
λ
+
=
(2b)
Unknowns in equation 2b can be determined through experiment: fv is measured by gravimetric analysis, Kλ(e) can
be found using line of sight attenuation (LOSA) measurements, and ρsa,λ can be calculated given the soot morphology information obtained through electron microscopy. Additionally, by replacing the CCD array with an imaging spectrometer in the LOSA measurements, a spectrally-resolved extinction coefficient can be found. These data can then be used in Equation (2b) to obtain the variation in E(m) as a function of wavelength. Using this new information, LII measurements performed on cooled soot can be re-evaluated to investigate whether the loss of accuracy is due to solely to inaccurate knowledge of E(m) and its wavelength dependence.
3. Experimental Setup
An inverted flame burner, designed after Stipe et al. [12] has been developed that produces a highly repeatable and controllable soot aerosol of near ambient temperature; a more detailed description of the burner is available in our previous work [13]. As discussed above, several diagnostics were applied to the cooled soot stream, and are described in the following sections.
3.1 Gravimetric Analysis
An independent measurement of SVF can be obtained by gravimetric analysis, where the soot from a known volume of gas is collected and weighed. The gravimetric soot volume fraction, fvg, is then found by the following formula:
v g g s a s vg
f
T
V
T
m
f
=
⋅
⋅
⋅
=
ρ
(3)
where ms is the mass of the collected soot, Ta is the ambient temperature, ρs is the density of soot, Vg is the measured
volume of exhaust gas, and Tg is the exhaust gas temperature.
An isokinetic sampling system has been developed for the purpose of soot extraction, as shown in Figure 1. The system is computer controlled to permit monitoring of the exhaust temperature and burner settings to closely match the flow velocities. The filters used for collection are plastic membrane filters (Whatman, Anodisc) with a pore size of 0.02 μm. The high pressure drop imposed by the filter limited the attainable flow rate of the extraction system, so the use of a cubic-contoured diffuser was necessary to achieve isokinetic conditions. The volume of exhaust gas was measured by a thermal mass flow controller (Brooks).
Figure 1: Schematic of isokinetic sampling system
Before and after soot collection, filters were conditioned in an environmental chamber at 25°C and 50% relative humidity (RH), prior to neutralizing with a Staticmaster 2U500 and weighing on a Mettler Toledo UMX2 balance. A total of 34 individual gravimetric filter measurements were performed in addition to 5 control measurement in which filters were handled in an identical procedure but without collecting any samples.
3.2 Electron Microscopy
Soot morphology was determined through a combination of scanning and transmission electron microscopy (SEM and TEM). Typically, this sort of measurement is done by TEM alone, where representative samples can be obtained by relying on thermophoretic deposition. However, the thermophoretic force requires a significant temperature gradient between the particles and the deposition surface, which is lacking in the present case of a cooled exhaust stream. Thus, TEM was used only to accurately measure primary particle size. Fractal parameters and aggregate size distribution data were instead found by filter sampling and analysis by SEM.
Sampling for TEM was performed using 3 mm carbon-coated grids, which were inserted into the exhaust stream for a brief period of time. Since the goal of these measurements was only to determine primary particle size, which is known not to vary significantly among aggregates, it was not necessary to precisely control the duration of samples. Filter sampling for SEM was performed using the isokinetic sampling system described above, only the sampling time was reduced to ~1 s to yield an appropriate surface coverage. A typical SEM micrograph of an aggregate can be seen in Figure 2. Data analysis followed the method presented by Brasil et al. [7] to determine fractal properties and aggregate size data. This size data were then fitted to statistical distributions to complete the morphological description of the soot under study.
a) b)
There is some contention over what type of distribution best describes soot; the lognormal distribution is by far the most commonly used, though a self-preserving distribution has been argued to provide a better fit to the data [8]. For this analysis we shall consider both.
3.3 LOSA
Line-of-sight-attenuation (LOSA) is a well established optical extinction method for measuring concentration of particles in an aerosol-laden stream. In LOSA measurements, the optical transmissivity of an aerosol-containing medium is measured along a linear path through the medium. The transmissivity of the path, τ, at wavelength λ, is measured as the ratio of light intensity before, Iλ,0, and after passing through the attenuating medium, Iλ. The
transmissivity is functionally related to a line integral of the local extinction coefficients, Kλ(e), along the path via:
⎟
⎠
⎞
⎜
⎝
⎛−
=
=
∫
∞ ∞ −K
s
I
I
ed
exp
( ) 0 , λ λ λ λτ
(4)
Once the line-integrated extinction coefficient is found, Equation (2a) above can be used to solve for soot concentration.
The experimental setup used for the spectral line-of-sight attenuation measurements (Spec-LOSA) follows closely the set-up used for indoor 3-image diffuse light source measurements of the same plume [14]; however, as stated above the CCD array and narrow-band filter were replaced with a holographic imaging spectrometer with the slit in a horizontal plane. Thus, the CCD on the output plane of the spectrometer measures horizontal spatial position on one axis and wavelength on the second. The spectrometer can resolve and measure light intensity in a spectral band from 250 to 1050 nm; however, this range is reduced due to the spectral output of the light source, attenuation of some UV light by the optics, and the sensitivity of the detector so that the effective working range of the system is 450 to 950 nm.
4. Results
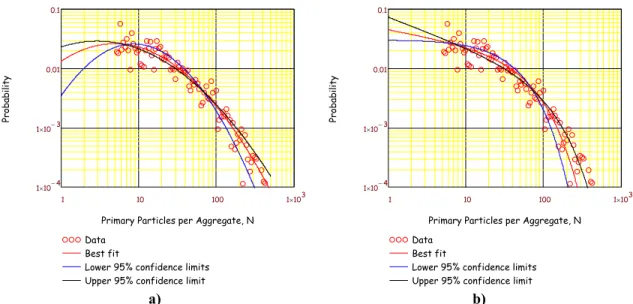
From TEM images, the average primary particle diameter was determined to be 33.2 nm, with a standard deviation of 5 nm. From SEM data, fractal parameters were determined to be kf = 1.60 and Df = 1.74. Figure 3 shows fits
with 95% confidence limits for both lognormal and self-preserving distributions, plotted on a log-log scale. Unfortunately the confidence limits are quite wide for both distributions, introducing a significant amount of uncertainty, and it is unclear at this point whether one is more suitable than the other. From the gravimetric analysis, an average soot volume fraction of 0.054 ppm was found, with a standard deviation of 0.002 ppm (3.8%). An uncertainty analysis revealed a 2.2% uncertainty on the gravimetric soot volume fraction.
1 10 100 1 10× 3 1 10× −4 1 10× −3 0.01 0.1
1 10 100 1 10× 3 1 10× −4 1 10× −3 0.01 0.1 Data Best fit
Lower 95% confidence limits Upper 95% confidence limit
Primary Particles per Aggregate, N
Probability
Data Best fit
Lower 95% confidence limits Upper 95% confidence limit
Primary Particles per Aggregate, N
Probability
a) b)
Figure 3: a) Lognormal and b) self-preserving fits to experimental size data
Finally, using experimental data and RDG-PFA theory, Equation (2b) can be used to determine the wavelength-specific soot absorption function E(m)λ. Figure 4 compares results using both lognormal and self-preserving
distributions. Interestingly, although the choice of statistical distribution to which size data are fit does in fact impact the results, it is in the form of a systematic difference whose magnitude is a mere 3%. This is despite the marked difference in ρsa (up to 50%), and falls well within experimental uncertainty when the broad confidence
limits of the fits are considered.
400 500 600 700 800 900 1000 Wavelength (nm) 0.4 0.6 0.8 1 1.2 1.4 Ext inc ti o n Coe ff icien t, Ke (1/ m 400 500 600 700 800 900 1000 Wavelength (nm) 0.42 0.44 0.46 0.48 0.5 So ot Abs orpt io n Func ti on, E (m) 0 0.04 0.08 0.12 0.16 0.2 Sc att e r to A b s o rptio n R a ti o , ρsa E(m) (LN) E(m) (SP) ρsa (LN) ρsa (SP) ) a) b)
Figure 4: a) Extinction coefficients and b) E(m) and ρsa results for both lognormal (LN) and self-preserving
5. Conclusions
There is a clear trend of E(m) varying with wavelength, dropping approximately 10% between 450 and 950 nm as can be seen in Figure 4b). This is in contrast with the typical assumption of a constant value, and would be significant in cases where a high degree of accuracy is desired. It is also noted that these E(m) values are somewhat higher than those found in most literature, typically 0.26-0.29 (eg. [4]), although values as high as 0.4 have been reported [6]. Finally, the observed differences between data fit to lognormal or self-preserving distributions are minimal, and this work revealed no clear advantage of using one over the other.
6. Future work
A full uncertainty analysis is required to determine the accuracy of the reported values. LII analyses performed on cooled soot from the same burner will also be re-evaluated, using the SVF obtained by gravimetric analysis and the new spectrally-resolved values of E(m), which will hopefully ascertain whether the loss of accuracy of the diagnostic when applied to cooled soot was due to inaccurate knowledge of the optical properties alone. Additionally, the method presented here can be extended to investigate variations in optical properties with other variables such as primary particle diameter and aggregate size.
7. REFERENCES
[1] W.H. Dalzell and A.F. Sarofim, J. Heat Transfer, 91:100-104 (1969). [2] B.J. Stagg and T.T. Charalampopoulos, Comb. Flame, 94:381-396 (1993). [3] S.C. Lee and C.L. Tien, 18th Symp. (Int'l), The Comb. Inst., 1159-1166 (1981). [4] S.S. Krishnan, K.C. Lin, G.M. Faeth, J. Heat Transfer, 122:517-524 (2000). [5] M.Y. Choi et al., Combustion and Flame, 102:161-169 (1995)
[6] D.R. Snelling, F.S. Liu, G.J. Smallwood, O.L. Gulder, Comb. Flame, 136:180-190 (2004). [7] A.M. Brasil, T.L. Farias, and M.G. Carvalho, J. Aerosol Sci., 30(10):1379-1389 (1999). [8] C.M. Sorensen, Aerosol Sci. Tech., 35:648-687 (2001).
[9] P.A. Bonczyk and R.J. Hall, Langmuir, 7:1274-1280 (1991).
[10] R.A. Dobbins and C.M. Megaridis, Applied Optics, 30:4747-4754 (1991). [11] U.O. Koylu and G.M. Faeth, Combustion and Flame, 89:140-156 (1992).
[12] C.B. Stipe, B. S. Higgins, D. Lucas, C. P. Koshland, and R. F. Sawyer, Rev. Sci. Inst., 76:023908 (2005). [13] A.R. Coderre, A., D.R. Snelling, G.J. Smallwood, and M.R. Johnson, Proceedings of Combustion Institute
Canadian Section Spring Technical Meeting, Banff, AB, paper E5 (2007).
[14] C. Yang, K.A. Thomson, and M.R. Johnson, Proceedings of Combustion Institute Canadian Section Spring Technical Meeting, Banff, AB, Paper C2 (2007).