Publisher’s version / Version de l'éditeur:
IEEE transactions on bio-medical engineering, PP 99, 2011-12-05
READ THESE TERMS AND CONDITIONS CAREFULLY BEFORE USING THIS WEBSITE. https://nrc-publications.canada.ca/eng/copyright
Vous avez des questions? Nous pouvons vous aider. Pour communiquer directement avec un auteur, consultez la
première page de la revue dans laquelle son article a été publié afin de trouver ses coordonnées. Si vous n’arrivez pas à les repérer, communiquez avec nous à PublicationsArchive-ArchivesPublications@nrc-cnrc.gc.ca.
Questions? Contact the NRC Publications Archive team at
PublicationsArchive-ArchivesPublications@nrc-cnrc.gc.ca. If you wish to email the authors directly, please see the first page of the publication for their contact information.
This publication could be one of several versions: author’s original, accepted manuscript or the publisher’s version. / La version de cette publication peut être l’une des suivantes : la version prépublication de l’auteur, la version acceptée du manuscrit ou la version de l’éditeur.
For the publisher’s version, please access the DOI link below./ Pour consulter la version de l’éditeur, utilisez le lien DOI ci-dessous.
https://doi.org/10.1109/TBME.2011.2172685
Access and use of this website and the material on it are subject to the Terms and Conditions set forth at
Real-time control of angioplasty balloon inflation based on feedback
from intravascular optical coherence tomography : preliminary study
on an artery phantom
Azarnoush, Hamed; Vergnole, Sébastien; Boulet, Benoit; DiRaddo, Robert;
Lamouche, Guy
https://publications-cnrc.canada.ca/fra/droits
L’accès à ce site Web et l’utilisation de son contenu sont assujettis aux conditions présentées dans le site LISEZ CES CONDITIONS ATTENTIVEMENT AVANT D’UTILISER CE SITE WEB.
NRC Publications Record / Notice d'Archives des publications de CNRC:
https://nrc-publications.canada.ca/eng/view/object/?id=9c8f1518-8078-4fa4-876a-8782b583b210 https://publications-cnrc.canada.ca/fra/voir/objet/?id=9c8f1518-8078-4fa4-876a-8782b583b210
Abstract— A method is proposed to achieve computerized control of angioplasty balloon inflation, based on feedback from intravascular optical coherence tomography (IVOCT). Controlled balloon inflation could benefit clinical applications, cardiovascular research, and medical device industry. The proposed method was experimentally tested for balloon inflation within an artery phantom. During balloon inflation, luminal contour of the phantom was extracted from IVOCT images in real-time. Luminal diameter was estimated from the obtained contour and was used in a feedback loop. Based on the estimated actual diameter and a target diameter, a computer controlled a programmable syringe pump to deliver or withdraw liquid in order to achieve the target diameter. The performance of the control method was investigated under different conditions, e.g. various flow rates and various target diameters. The results were satisfactory, as the control method provided convergence to the target diameters in various experiments.
Index Terms— Angioplasty, real-time systems, control, optical coherence tomography
I. INTRODUCTION
ngioplasty is the process of widening an artery where stenosis (narrowing) has occurred due to presence of plaque in the artery wall. It is performed on over 1 million patients, every year, in the US alone [1]. Angioplasty techniques include inflating a balloon or deploying a stent by inflating a balloon to provide the desired lumen patency.
Presence of a large number of patients suffering atherosclerosis and the possible drawbacks of angioplasty, e.g. restenosis [2], underline the importance of further research to improve the outcomes of the intervention. After the advent of the drug-eluting stents (DES), the restenosis rate was reduced [3, 4]. However, application of DES constitutes an improvement in the pharmacologic approach rather than in the
Manuscript received July 10, 2011; accepted October 4, 2011. This work was supported by the Genomics and Health Initiative of National Research Council Canada.
H. Azarnoush would like to thank the financial support of the Natural Sciences and Engineering Research Council of Canada.
H. Azarnoush, S. Vergnole, Robert DiRaddo, and G. Lamouche are with Industrial Materials Institute, National Research Council Canada, Boucherville, QC J4B 6Y4 Canada, (phone: (450) 5198; fax: (450) 641-5106; email: guy.lamouche@cnrc-nrc.gc.ca).
H. Azarnoush and B. Boulet are with Centre for Intelligent Machines, McGill University, Montreal, QC H3A 2A7, Canada.
mechanical approach to angioplasty. Further research is needed to improve balloon deployment strategies to reduce arterial injury due to excessive mechanical stretching of the vessel walls. Currently, the balloon deployment is performed manually. In such procedures, a syringe is used to inflate the balloon until the luminal diameter achieves a target value, the result being evaluated with X-ray angiography. In the literature, two main shortcomings have been associated to this approach. First, manual inflation renders the quality of results operator-dependent and prone to human error. Second, estimation of luminal diameter depends on angiograms which provide low-resolution silhouette views of the vasculature.
To address the first shortcoming, some researchers proposed the use of computerized inflation devices to inflate the balloon [5-7]. Clinical trials of such devices were also reported [8-10]. In some studies [8, 9], the focus was on using different pressurization rates. In one study [10], the authors investigated the real-time monitoring of pressure-volume data.
To address the second shortcoming, some clinicians have investigated the application of intravascular imaging techniques, e.g. intravascular ultrasound (IVUS) [11-13]. These techniques have been usually applied for verification of the results after the balloon or stent deployment. The process usually involves withdrawing the balloon catheter and replacing it with an intravascular imaging catheter to verify the post-deployment results. A few researchers demonstrated clinical application of integrated IVUS-balloon catheters [14-16] to monitor the results during balloon inflation.
In this paper, we propose a combination of the above two approaches to achieve computerized control of balloon inflation, based on intravascular image processing. To our best knowledge, no result has yet been published proposing such an approach to balloon inflation control. The reasons could be the pervasive application of IVUS which does not provide the desired resolution for this purpose, and also the unavailability of integrated imaging balloon catheters.
We present computerized control of balloon inflation inside an artery phantom, based on feedback from intravascular optical coherence tomography (IVOCT) [17]. IVOCT provides a resolution which is almost 10 times better than that of IVUS, rendering it an efficient approach for this application. The development of high-measurement rate of swept-source optical coherence tomography (SSOCT) [18] systems in combination with the availability of catheterized probes paved the path towards more clinical applications of
Real-time Control of Angioplasty Balloon
Inflation Based on Feedback from Intravascular
Optical Coherence Tomography: Preliminary
Study on an Artery Phantom
Hamed Azarnoush, Sébastien Vergnole, Benoit Boulet, Robert DiRaddo, and Guy Lamouche
In section II, we present the applied materials and methods. We describe our imaging system and our imaging balloon catheter. Then we use a sample image to provide details on lumen detection algorithm and lumen diameter characterization. Subsequently, we describe our control methodology and the applied hardware implementation. In section III, controlled balloon inflation results are presented and discussed. Section IV concludes this paper.
II. MATERIALS AND METHODS
A. Optical Coherence Tomography (OCT) System
A custom-built SSOCT system was used for imaging [19]. We used a wavelength-swept laser source (Santec, HSL2000), operating with a sweep rate of 30 kHz and a sweep range of over 108 nm around 1.33 μm wavelength to provide a measured axial resolution of about 15 μm in air. The SSOCT system was configured as a Mach-Zehnder interferometer with balanced detection and was packaged as a mobile unit.
B. IVOCT-Imaging Balloon Catheter
To achieve controlled inflation, based on real-time intra-luminal imaging, an IVOCT-imaging balloon catheter was developed [20]. In experiments, the imaging probe rotated in a liquid inside a protective polymer sheath (PS). The maximum diameter of the probe was 0.8 mm. At the tip of the probe, the light was focused by a gradient index (GRIN) lens and redirected at 90° by a right-angle prism. Rotation and translation of the probe were ensured by a custom pullback unit.
The probe and its polymer sheath were inserted into the balloon. Fig. 1 illustrates the resulting IVOCT-imaging balloon catheter. The balloon, used in this catheter, was a semi-compliant balloon, made from polyurethane. The nominal diameter of the balloon, i.e. the diameter after unfolding and before stretch, was 4 mm. For experiments, the deflated balloon was manually folded to a diameter smaller than 3.2 mm..
Fig. 1. IVOCT-imaging balloon catheter
C. IVOCT Images
In this section, we present a sample image, obtained during balloon inflation inside a custom-built multi-layer optical phantom [21]. The phantom was made of three layers with different optical scattering and optical attenuation properties. These layers simulated optical properties of the layers of the coronary artery, namely, intima, media and adventitia. The phantom also had relevant mechanical properties for small deformations.
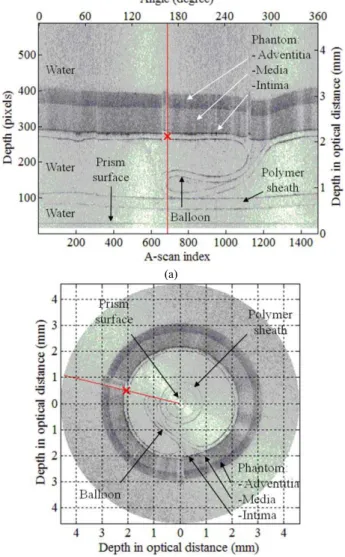
For imaging, a frame rate of 20 FPS was used. Fig. 2 illustrates an acquired OCT image of the balloon inside the phantom, in polar and in Cartesian coordinates. In this image, the balloon is not yet inflated and is in a folded state.
2(b).
Fig. 2(a) presents a grayscale image matrix, acquired during one full rotation of the probe. In this figure, the horizontal and the vertical axes respectively correspond to the probe rotation angle and radial optical distance, i.e. the product of the geometrical distance and the refractive index. Each column in the image matrix represents a depth scanning profile at a particular angle and is called an A-scan. A sample A-scan is depicted by a red line. The values on the primary axes (below and left) represent pixel numbers. The values on the secondary axes (above and right) represent the rotation angle in degrees and the depth in millimeters in optical distance. The lowest contour corresponds to the prism surface, where the light exited the probe. The polymer sheath and the balloon are represented each by two contours, corresponding to their inner and outer surfaces. The outer surface of the balloon overlaps the phantom intima on most A-scans. The phantom media and the phantom adventitia can be distinguished as regions with different intensities.
The image in Fig. 2(b) was obtained by conversion of the image matrix into Cartesian coordinates, providing a better representation of the geometrical structure. The depth is measured in millimeters in optical distance.
(a)
(b)
D. Lumen Detection in IVOCT Images
In order to estimate the luminal diameter of the phantom in real-time, a lumen contour was first detected. The detected contour was composed of n nodes, each of which was detected on the lumen border of a selected A-scan. These nodes could be detected on all A-scans. Therefore, the value of n could be as large as the number of A-scans. In our real-time control application, detection of a subset of nodes provided sufficient precision and increased processing speed.
Let j, where j=1, 2, …, n, denote the index to the A-scans processed to extract the contour nodes. In order to fully determine the coordinates of the contour nodes, on each A-scan, a depth index, ij, was estimated.
The applied lumen detection steps were as follows:
Step 1: First, we selected n A-scans (in the results of this paper, n=24), distributed at equal angles over a full rotation. Fig. 3(a) demonstrates a sample A-scan, which is used to explain the detection steps. This is the A-scan corresponding to the red line in Fig. 2.
Step 2: Some A-scans including the one presented in Fig. 3(a) passed through a balloon folding region. Deflection of light in the balloon folding caused discontinuity and distortion in the phantom image. It made it difficult to detect the lumen border from a single A-scan in a distorted region. This can be verified in Fig. 3(a). We needed a robust detection for such A-scans. In order to provide the necessary robustness in our algorithm, each element of the corresponding A-scan was averaged with the elements at the same depth of the w neighboring A-scans on each side of the corresponding A-scan. Fig. 3(b) shows how the application of averaging more clearly defines different regions. The balloon (B) and the polymer sheath (PS) can each be distinguished by a pair of spikes. The phantom media (M) and the phantom adventitia (A) can be identified as extended regions with different intensities. The phantom intima (I) and the prism surface (R) correspond to single spikes. The prism surface is represented by R, since it was used as a reference for automatically registering the images in the radial direction. The prism surface was automatically detected by a peak detection technique. The depth of the prism surface was obtained as a constant pixel value in each image. The correct depth was determined by the known dimensions of the prism. The images were then registered by positioning the prism surface at its correct depth.
Step 3: In this step, a median filter with a coarse scale was used to attenuate single spikes, such as those in Fig. 3(b), corresponding to the polymer sheath, the balloon folding and the prism surface. This step created an extended elevated region, shown in Fig. 3(c) with a width estimating the thickness of the phantom.
Step 4: The lumen border corresponded to the low-to-high edge of the obtained elevated region, generated in the previous step. In this step, we applied a gradient operation to detect this edge. As Fig. 3(d)
demonstrates, the lumen border was detected as the maximum of the gradient.
The applied algorithm, to detect the contour node on A-scan
j, was formulated as:
+ ∇ =
∑
+ − = w j w j k s j I i k w F i (, ) 1 2 1 max arg i (1)where I was the image matrix, Fs was median filtering with
scale s, ∇was the gradient operation with respect to the depth index, i, and “arg max” provided the maximizing index.
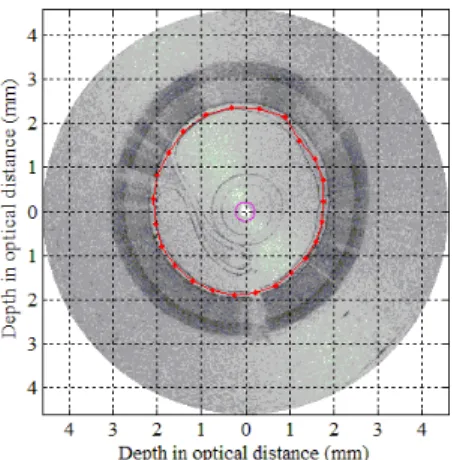
Fig. 4 presents lumen detection in a sample image and in a sequence of images in the form of a movie clip (available at http://ieeexplore.ieee.org). This figure demonstrates the detected lumen contour (in red) in 78 frames acquired when the balloon was inflated from a pressure of 0 atm to an approximate pressure of 3 atm. The detected nodes are visible on the contour in the form of red dots. The magenta circle in the center represents to the detected surface of the prism.
Using the above algorithm, detection was performed in real-time to control the balloon inflation, as will be shown later.
Fig. 3. Description of different steps to extract one luminal contour node
Fig. 4. Detection of the luminal contour nodes represented as red dots (movie clip available at http://ieeexplore.ieee.org).
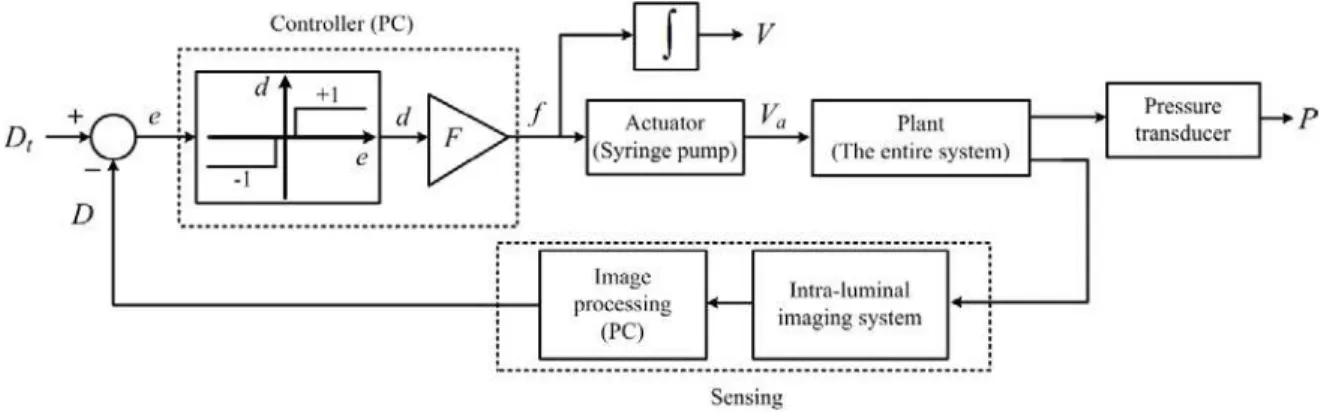
Fig. 5. Balloon inflation control system
E. Estimation of Luminal Diameter
The index, ij, obtained from the detection algorithm,
represented the node position in pixels. This value was converted to a depth value in millimeters in geometrical distance. The depth value was calculated using the following equation: w R j radial p j n i i s r r = + ( − ) (2)
where rj was the depth value of the detected node in
geometrical distance, rp was the distance from the center of
rotation to the surface of the prism, iR was the depth of the
prism surface in pixels which was constant for all A-scans in the same image, nw was the refractive index of water, and
sradial was the radial step size corresponding to each pixel (in
our measurements, rp=0.15 mm, nw=1.33, and sradial=0.008
mm). Once the depth value for each contour node was calculated, the average lumen diameter was estimated.
F. Control System Architecture
Fig. 5 demonstrates the proposed balloon inflation control setup. The goal of the control setup was to achieve a desired target diameter for the phantom. In this figure, the role of each element is interpreted in the context of a conventional control system, composed of an actuator, a plant, a sensing mechanism, and a controller:
1) The actuator was a syringe pump to deliver or withdraw liquid to inflate or deflate the balloon.
2) The plant was the entire system composed of tubing, balloon, phantom, etc.
3) The sensing mechanism which was used in the control loop provided an average luminal diameter in real-time. It was composed of two main stages. In the first stage, an IVOCT imaging system acquired intra-luminal images in real-time. In the second stage, a PC performed image processing and calculated the average luminal diameter, D in geometrical distance. The diameter, D, was subtracted from a desired target diameter, Dt, to generate an error variable, e. The
error variable was sent to the controller. Alternate measurements could be made on the plant to assess its response to the pump action. A pressure transducer was connected to provide inflation pressures, as additional information. The pressure measurements were not used in the feedback loop.
4) The controller sent flow rate commands to the pump to achieve the target diameter. As Fig. 5 depicts, the controller was composed of two components. Based on the sign of the error variable, e, the first component determined the direction, d, assigned to the plunger movement. The function of this component is demonstrated by a graph in Fig. 5. Positive e indicated that the current diameter was smaller than the target diameter. In this case, a value of ‘+1’ was assigned to d to move the syringe plunger in a direction to deliver more liquid to further inflate the balloon. Negative e indicated that the current diameter was larger than the target diameter. In this case, a value of ‘-1’ was assigned to d to move the syringe plunger in a direction to withdraw liquid to deflate the balloon. A small absolute value for e within a desired neighborhood of zero indicated that the current diameter had almost converged to the target diameter. In this case, in order to prevent from excessive switching in the direction of the plunger movement, no liquid was delivered or withdrawn. This neighborhood of zero appears as a dead zone in the graph representing the first component of the controller. The second component of the controller was a gain, F, which determined the delivery or withdrawal rate. The controller provided the syringe pump with the flow rate, f. Based on this flow rate, the syringe pump delivered or withdrew the liquid. In Fig. 5, the actual delivered volume is represented by Va. We estimated this volume by
integrating the flow rate, f. This estimate is represented by
V.
G. Hardware Implementation of the Control System
Fig. 6 schematically demonstrates our hardware implementation of the control setup, proposed in Fig. 5. A commercial syringe pump (PHD 4400, Harvard Apparatus) was used as the actuator for balloon inflation. The syringe pump was composed of a microcontroller and a stepper motor. It could provide a customized flow rate or volume of a liquid. The output of the pump was connected to the IVOCT imaging balloon catheter by a tube and a T connector. Using a second T connector, a pressure transducer (MLH150PSB01A, Honeywell) was connected to the tubing to monitor and record inflation pressures. The sensing mechanism was composed of the OCT probe, the OCT system, and a PC. The data from the OCT system and the pressure transducer were imported to the PC through a data acquisition board (DAQ). The PC was used also as the controller, sending flow rate command to the pump in real-time through RS-232 programming.
Fig. 6. Hardware implementation of the balloon inflation control system
III. RESULTS
In this section, we present and discuss the results of an experimental evaluation of the control system when using various values of the target diameter, Dt and the flow rate
gain, F. All the diameter values are presented in geometrical distances.
A. Various Target Diameter Values
In angioplasty, before a balloon or a stent is chosen, a target luminal diameter is determined for the stenotic region of the artery, based on angiograms. The goal is to achieve this diameter using balloon angioplasty or stent deployment. In the following, we discuss the performance of the control system in providing various target diameters.
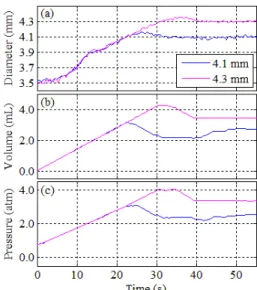
As mentioned earlier, in the experiments we use a semi-compliant balloon. Therefore, in comparison with non-compliant balloons, the balloon can be further inflated to larger diameters once it achieves its nominal diameter of 4 mm. Usually a semi-compliant balloon is used to deploy the stents. Even though, a stent is not used in the experiments, we expect a similar controlled-inflation procedure to be applicable in the case of stent deployment. Fig. 7 presents the results, including the diameter, the volume, and the pressure versus time, of two control experiments with different values of target diameter but with the same flow rate gain, F. The initial diameter was approximately 3.5 mm. The applied target diameters were 4.1 and 4.3 mm. The value of the gain, F, was 500 mL/h. As Fig. 7(a) shows, in both experiments, one could distinguish a small plateau region at an approximate diameter of 3.9 mm before the diameter reached its target value. This region corresponded to the relaxation that occurred when the balloon was completely unfolded. After the balloon was unfolded, it was further inflated until the target diameter was achieved. As Fig. 7(a) shows, the growth rate of the diameter decreased after the balloon was unfolded. The reason is that once the balloon was unfolded, it significantly contributed to resistance against further deformation.
To compare the transient and steady state behavior of the controlled diameter in different experiments, we defined different performance characteristics, based on control engineering conventions and notations. The obtained characteristics are specific to our system and could change for different setups with different catheters, different balloons, different lengths of tubing, etc. Nonetheless, we provide these characteristics in order to provide an assessment of our experiments:
1) Rise time (Tr) was defined as the difference between the
times at which 10 % and 90 % of the desired change in diameter were achieved. This parameter determined the speed of the control system to respond to changes in the target diameter.
2) Percentage overshoot (PO) represented a criterion to determine the excessive growth of the diameter beyond the target value. It was calculated by the following equation:
, 100 0 max × − − = D D D D PO t t (3)
where Dmax was the maximum achieved diameter and D0 was
the initial diameter.
3) Settling time (Ts) was defined as the time, after which the
convergence error was smaller than 10 % of the difference between the initial and the target diameters:
(
0)
1 . 0 D D D D− t < t− (4)4) Steady state diameter (Dss) was defined to determine the
degree of convergence. After the settling time, the system was considered to be in steady state. We measured the average and standard deviation value of the diameter in steady state, to provide an expression, Dss, for the diameter
in steady state.
Before obtaining the above characteristics, the sequence of diameter measurements was passed through a low-pass filter to reduce noise.
Table 1 presents the performance characteristics for the control experiments corresponding to Fig. 7. The rise time and the settling time increased by approximately 6 and 7 seconds, respectively, when the diameter target value increased from 4.1 to 4.3 mm. The overshoot decreased for this increase in the target value. The settling times to achieve a desired diameter value were in a relevant range for a clinical application. In a previous clinical study [9] the researchers used up to 90 s of computerized inflation time followed by maintaining the target pressure for another 20 s.
Fig. 7. The diameter (a), the volume (b), and the pressure (c), obtained from control experiments applying different target diameters (4.1, 4.3 mm).
4.1 mm 4.3 mm
Tr (s) 15.0 21.1
PO (%) 8 6
Ts (s) 20.7 27.7
Dss (mm) 4.11±0.02 4.30±0.03
B. Various Flow Rate Gain Values
In the literature, different researchers have investigated the effect of fast and slow inflation on the outcomes of angioplasty [22, 23]. However, the applied procedures are not standardized. A computerized inflation device provides the opportunity to investigate the effect of predetermined inflation rates. We performed experiments to investigate the effect of changing the flow rate in the controlled inflation process. This also helped us test our system for higher inflation rates, which allow less time for image processing in the feedback loop. Fig. 8 presents the results, including the diameter, volume and pressure versus time, of three control experiments with the same target diameter and various values of the flow rate gain,
F. The initial diameter was approximately 3.5 mm. The target
diameter was 4 mm. Values of 500, 750 and 1000 mL/h were applied for the gain, F. A plateau region corresponding to the balloon unfolding moment can be distinguished in Fig. 8, at an approximate diameter value of 3.9 mm which is consistent with the experiments using different target diameters.
Table 2 presents the performance characteristics for the control experiments corresponding to Fig. 8. These characteristics indicate that increasing the flow rate gain improved the rise time. However, increasing the flow rate gain also introduced oscillations in the diameter values, resulting in a larger overshoot and a larger settling time. The large overshoot and oscillations are visible in the graph corresponding to the flow rate gain of 1000 mL/h. The effect of oscillations was revealed in the larger standard deviation of the diameter in steady state corresponding to the gain value of 1000 mL/h.
Fig. 8. The diameter (a), the volume (b), and the pressure (c), obtained from control experiments using different flow rate gains (500, 750 and 1000 mL/h).
500 mL/h 750 mL/h 1000 mL/h
Tr (s) 11.7 8.1 7.7
PO (%) 8 15 21
Ts (s) 14.6 16.3 17.5
Dss (mm) 4.00±0.02 4.00±0.02 4.00±0.03
C. Sequential Target Diameter Values
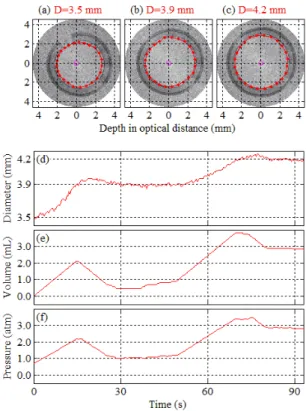
In angioplasty procedures, it is a common practice to apply a sequential pressurization procedure. First the balloon is pressurized to a target value; the pressure is maintained for a period of time; then the balloon is further pressurized to a higher target value. We performed an experiment, where a sequence of diameter milestones was applied. The initial diameter was approximately 3.5 mm and the flow rate gain, F, was 500 mL/h. Two target diameters of 3.9 and 4.2 mm were applied, sequentially. Fig. 9 presents the results of this experiment. In this figure, IVOCT images are presented at different diameter milestones together with the diameter, volume and pressure values. The balloon was first inflated to an unfolded state at a target diameter of 3.9 mm. This target diameter was maintained for several seconds. Then a new target diameter of 4.2 mm was applied. Consistent with what was observed previously, in this experiment the diameter growth rate during the second phase was smaller than it was in the first phase. A movie clip is included which is available at http://ieeexplore.ieee.org. The movie clip presents the acquired IVOCT image sequence, synchronized with graphs which display the corresponding real-time diameter, volume and pressure.
Fig. 9. Acquired images at milestone diameters (a-c), the diameter (d), the volume (e), and the pressure (f) during the control experiment using a sequence of target diameters, i.e., 3.9 mm and 4.2 mm (movie clip available at
As Fig. 9 demonstrates, the proposed control setup has the flexibility to stabilize over various predetermined diameter values. At each diameter milestone, using the performance specifications, e.g. settling time, the diameter can be stabilized over predetermined periods of time. Further advanced algorithms may provide a diameter trajectory, rather than a constant target diameter, to provide a desired diameter at a desired time. In an angioplasty procedure, such advantage of this methodology could potentially facilitate the process for an operator, providing safer and more precise conditions. Not only such an approach can improve the procedure, but also it can help standardize and compare the results across different institutes for further statistical analysis.
IV. CONCLUSION
We presented a methodology to control the balloon inflation inside deformable structures such as arteries, based on feedback from IVOCT imaging. Using this methodology, we successfully orchestrated the movements of a syringe plunger with the acquired real-time IVOCT images to control luminal diameter. To our knowledge, this was the first demonstration of a controlled clinical application, where IVOCT images were processed in real-time in a feedback loop. The combination of IVOCT and control engineering results in a technology that could benefit medical device industry, researchers, and clinical users. For industry, it could provide predetermined and consistent conditions for testing of angioplasty devices. For researchers, it could provide precisely controlled conditions to validate the results of mechanical tests as well as mathematical models, these tests and models being used to improve the design of balloons and stents. For clinical users, a controlled inflation could be a very relevant tool to insure safe percutaneous coronary intervention procedures. The main technical challenge in bringing this technology to the clinical world is the integration of the OCT probe in commercial percutaneous coronary intervention devices. This is an engineering challenge that can be overcome with existing technology. In future work, more complicated control algorithms, e.g. PID controllers, should be applied to improve performance characteristics. The control algorithm should be designed to also incorporate constraints on the inflation pressures. The technology should also be validated in vivo by performing controlled inflations for angioplasty and stent deployment in animal models.
REFERENCES
[1] D. Lloyd-Jones, R. J. Adams, T. M. Brown et al., “Heart disease and stroke statistics--2010 update: a report from the American Heart Association,” Circulation, vol. 121, no. 7, pp. e46.
[2] D. Faxon, Restenosis: a guide to therapy: Informa HealthCare, 2001. [3] J. W. Moses, M. B. Leon, J. J. Popma et al., “Sirolimus-eluting stents
versus standard stents in patients with stenosis in a native coronary artery,” N Engl j Med, vol. 349, no. 14, pp. 1315-23, 2003.
[4] G. W. Stone, S. G. Ellis, D. A. Cox et al., “One-year clinical results with the slow-release, polymer-based, paclitaxel-eluting TAXUS stent: the TAXUS-IV trial,” Circulation, vol. 109, no. 16, pp. 1942, 2004. [5] M. Unverdorben, M. Groll, P. Glaeser et al., “Preliminary results
achieved by a computer-assisted system for controlled balloon dilatation of coronary and peripheral arteries,” Computers and biomedical
research, vol. 30, no. 5, pp. 403-413, 1997.
[6] T. Olbrich, and A. Murray, “Assessment of computer-controlled inflation/deflation for determining the properties of PTCA balloon catheters with pressure-volume curves,” Physiological Measurement, vol. 22, pp. 299, 2001.
[7] T. Olbrich, and A. Murray, “Assessment of a technique to determine the mechanical properties of coronary arteries using mock arteries,”
Physiological Measurement, vol. 25, pp. 997, 2004.
[8] M. Unverdorben, P. Glaeser, R. Degenhardt et al., “Controlled balloon inflation reduces long-term restenosis after percutaneous transluminal coronary angioplasty,” The Journal of invasive cardiology, vol. 13, no. 12, pp. 774, 2001.
[9] D. Leibowitz, M. Abu-Gazala, I. Katz et al., “Computerized gradual balloon inflation: a novel strategy of coronary angioplasty superior to a standard manual approach,” Cardiovascular Revascularization
Medicine, vol. 10, no. 1, pp. 45-48, 2009.
[10] T. Olbrich, D. Williams, J. Doig et al., “In vivo assessment of coronary artery angioplasty and stent deployment from balloon pressure–volume data,” Physiological Measurement, vol. 27, pp. 213, 2006.
[11] A. Colombo, P. Hall, S. Nakamura et al., “Intracoronary stenting without anticoagulation accomplished with intravascular ultrasound guidance,” Circulation, vol. 91, no. 6, pp. 1676, 1995.
[12] R. Blasini, F. J. Neumann, C. Schmitt et al., “Comparison of angiography and intravascular ultrasound for the assessment of lumen size after coronary stent placement: impact of dilation pressures,”
Catheterization and cardiovascular diagnosis, vol. 42, no. 2, pp. 113,
1997.
[13] C. Briguori, J. Tobis, T. Nishida et al., “Discrepancy between angiography and intravascular ultrasound when analysing small coronary arteries,” European heart journal, vol. 23, no. 3, pp. 247, 2002. [14] J. Isner, K. Rosenfield, D. Losordo et al., “Combination
balloon-ultrasound imaging catheter for percutaneous transluminal angioplasty. Validation of imaging, analysis of recoil, and identification of plaque fracture,” Circulation, vol. 84, no. 2, pp. 739, 1991.
[15] H. Mudra, V. Klauss, R. Blasini et al., “Ultrasound guidance of Palmaz-Schatz intracoronary stenting with a combined intravascular ultrasound balloon catheter,” Circulation, vol. 90, no. 3, pp. 1252, 1994.
[16] M. Kawata, T. Okada, N. Igarashi et al., “Assessment of intravascular ultrasound-bearing balloon catheter-guided percutaneous transluminal coronary angioplasty and stenting,” Heart and vessels, pp. 185, 1997. [17] E. Regar, P. W. Serruys, and T. G. Van Leeuwen, Optical coherence
tomography in cardiovascular research: Informa healthcare, 2007.
[18] G. J. Tearney, S. Waxman, M. Shishkov et al., “Three-dimensional coronary artery microscopy by intracoronary optical frequency domain imaging,” JACC Cardiovascular Imaging, vol. 1, no. 6, pp. 752, 2008. [19] G. Lamouche, M. Dufour, M. Hewko et al., “Intravascular optical
coherence tomography on a beating heart model,” Journal of Biomedical
Optics, vol. 15, pp. 046023.
[20] H. Azarnoush, S. Vergnole, R. Bourezak et al., “Optical coherence tomography monitoring of angioplasty balloon inflation in a deployment tester,” Review of Scientific Instruments, vol. 81, pp. 083101.
[21] C.-E. Bisaillon, M. M. Lanthier, M. Dufour et al., "Durable coronary artery phantoms for optical coherence tomography," Proc. SPIE, pp. 7161, 71612E, 2009.
[22] E. M. Ohman, J. Marquis, D. R. Ricci et al., “A randomized comparison of the effects of gradual prolonged versus standard primary balloon inflation on early and late outcome. Results of a multicenter clinical trial. Perfusion Balloon Catheter Study Group,” Circulation, vol. 89, no. 3, pp. 1118, 1994.
[23] R. Ilia, H. Cabin, S. McConnell et al., “Coronary angioplasty with gradual versus rapid balloon inflation: initial results and complications,”
Catheterization and cardiovascular diagnosis, vol. 29, no. 3, pp.
199-202, 1993.
Hamed Azarnoush received his B.Sc. degree from Sharif University of Technology, Tehran, Iran, in 2002. He received his M.Sc. degree from Concordia University, Montreal, Canada, in 2005. Currently, he is a PhD candidate at McGill University, Montreal, Canada. His research interests include medical image processing, computer-assisted interventions, and control theory.
University of Limoges (France) in 2005. He was then involved in optical coherence tomography projects as a research associate with the National Research Council of Canada (Boucherville, Qc). Recently, he joined Horiba Scientific (Villeneuve d’Ascq, France) as an R&D project leader.
Benoit Boulet, Ph.D., Eng., is an Associate Professor in the Department of Electrical and Computer Engineering at McGill University. He is Director of the McGill Centre for Intelligent Machines.
Professor Boulet’s research focuses on finding robust and practical solutions to automation and control problems in biomedical, industrial, and vehicular applications.
Robert DiRaddo received his PhD in Engineering from McGill University. He worked in the petrochemical sector on plant operations for several years before joining the National Research Council of Canada as a researcher. He soon become a research manager and currently leads a pan-Canadian initiative on surgical simulation.
Guy Lamouche completed graduate studies on guide-wave optics (M.Sc.A.,1989, Montreal) and optical properties of semiconductors and quantum structures (Ph.D., 1996, Montreal). He worked as an NSERC postdoctoral fellow (1996-1998) in Université Paris VII and Université Joseph Fourier (Grenoble). In 1998, he joined the Industrial Materials Institute where he is currently the team leader of the optical coherence tomography activities.