HAL Id: hal-01695083
https://hal.archives-ouvertes.fr/hal-01695083
Preprint submitted on 29 Jan 2018
HAL is a multi-disciplinary open access archive for the deposit and dissemination of sci-entific research documents, whether they are pub-lished or not. The documents may come from teaching and research institutions in France or abroad, or from public or private research centers.
L’archive ouverte pluridisciplinaire HAL, est destinée au dépôt et à la diffusion de documents scientifiques de niveau recherche, publiés ou non, émanant des établissements d’enseignement et de recherche français ou étrangers, des laboratoires publics ou privés.
Buses, Houses or Cash? Socio-Economic, Spatial and
Environmental Consequences of Reforming Public
Transport Subsidies in Buenos Aires
Paolo Avner, Shomik Raj Mehndiratta, Vincent Viguie, Stéphane Hallegatte
To cite this version:
Paolo Avner, Shomik Raj Mehndiratta, Vincent Viguie, Stéphane Hallegatte. Buses, Houses or Cash? Socio-Economic, Spatial and Environmental Consequences of Reforming Public Transport Subsidies in Buenos Aires. 2018. �hal-01695083�
Policy Research Working Paper
8166
Buses, Houses or Cash?
Socio-Economic, Spatial and Environmental
Consequences of Reforming Public Transport Subsidies
in Buenos Aires
Paolo Avner
Shomik Raj Mehndiratta
Vincent Viguié
Stephane Hallegatte
Social, Urban, Rural and Resilience Global Practice Group
Transport and ICT Global Practice Group
Global Facility for Disaster Reduction and Recovery
August 2017
WPS8166
Public Disclosure Authorized
Public Disclosure Authorized
Public Disclosure Authorized
Produced by the Research Support Team
Abstract
The Policy Research Working Paper Series disseminates the findings of work in progress to encourage the exchange of ideas about development issues. An objective of the series is to get the findings out quickly, even if the presentations are less than fully polished. The papers carry the names of the authors and should be cited accordingly. The findings, interpretations, and conclusions expressed in this paper are entirely those of the authors. They do not necessarily represent the views of the International Bank for Reconstruction and Development/World Bank and its affiliated organizations, or those of the Executive Directors of the World Bank or the governments they represent.
Policy Research Working Paper 8166
This paper is a product of the Social, Urban, Rural and Resilience Global Practice Group, the Transport and ICT Global Practice Group, and the Global Facility for Disaster Reduction and Recovery. It is part of a larger effort by the World Bank to provide open access to its research and make a contribution to development policy discussions around the world. Policy Research Working Papers are also posted on the Web at http://econ.worldbank.org. The authors may be contacted at pavner@worldbank.org.
Transit subsidies in the urban area of Buenos Aires are high, amounting to a total of US$5 billion for 2012. They have been challenged on several counts: suspected of driving urban sprawl and associated infrastructure costs, diverting resources from system maintenance, and failing to reach the poor among others. In this context, this paper exam-ines the impacts of cost recovery fares under a range of different policy scenarios that could cushion the impact of fare increases. The alternative scenarios that are scrutinized are the uncompensated removal of the transit subsidy, its replacement by a lump sum transfer, and its replacement by two different construction subsidy schemes. Using a dynamic urban model (NEDUM-2D) calibrated for the urban area of Buenos Aires, all scenarios are assessed along four dimensions: (i) the efficiency/welfare impact on resi-dents, (ii) the impacts on the internal structure of the urban area and sprawl, (iii) the impact on commuting-related
carbon dioxide emissions, and (iv) the redistributive impacts, with a focus on the poorest households. A series of results emerge. First, there are consumption-related welfare gains for residents associated with replacing the transit subsidy by a lump sum transfer. Second, there are only moderate reductions in urbanization over time and thus infrastruc-ture costs associated with the subsidy removal. Third, the replacement of the transit subsidy leads to only moderate increases in carbon dioxide emissions despite lower public transport mode shares, because households will chose to settle closer to jobs, thereby reducing commuting distances. Finally, the replacement of the transit subsidy by a lump sum transfer will lead to short-term harsh redistributive impacts for captive transit users in some areas of the urban area. Medium-term adjustments of land and housing prices will partially mitigate the negative impacts of higher trans-port costs for tenants, but will further hurt homeowners.
Buses, houses or cash? Socio-economic, Spatial and Environmental Consequences
of Reforming Public Transport Subsidies in Buenos Aires
Paolo Avner( a , b , c), Shomik Raj Mehndiratta(a ), Vincent Viguié( b), Stephane Hallegatte( a )1
(a)The World Bank, Washington DC, USA
(b)Center for International Research on the Environment and Development (CIRED) (c)Association pour la Promotion de la Recherche sur l’Economie du Carbone (APREC)
JEL codes: H21, H23, O18, R14, R48, R52, C63
Keywords: Transit subsidy, Lump sum transfers, Construction subsidies, Land use – transport model, Urban form, Household welfare
1 The authors would like to thank Cynthia Goytia and Guadalupe Dorna for their time, patience and fruitful
discussions as well as for accepting to share precious data and insights. Andrés Gartner was a great guide of Buenos Aires, may he be thanked for his insights as well. The crucial employment and household location data was shared by German Freiberg and Wagner Colombini Martins, we are very grateful to them. We also thank Camila Rodriguez and Santiago Ezequiel Arias for the information they provided us with on the history of subsidies in Buenos Aires and Tatiana Peralta-Quiròz for the GTFS data. Harris Selod, Daniel Rodriguez, Augustin Maria, Bernardo Alvim, Nancy Lozano Gracia as well as participants in the 2015 NARSC conference provided excellent comments on previous drafts of this paper.
2
1 Introduction
Public transport is highly subsidized in the urban area of Buenos Aires. The fares paid by the users only cover around a third of the cost of the trips with total transit subsidies amounting to more than US$ 5 billion for the urban area of Buenos Aires alone in 2012. This level of subsidization is in line with what is found in developed country cities but is high for a developing country. In light of these figures, the transit subsidies have been challenged first on a financial and fiscal basis2. Is this the best use of scarce public
resources? Or could alternative policy and interventions lead to better welfare outcomes? Commentators have focused on many potential weaknesses of the subsidy – including the impact of diverting resources originally earmarked for system maintenance and investment both of which have been inadequate in the last decade; issues of financial management; as well as the lack of transparency or incentives to foster efficiency in the allocation mechanism.
There is also a debate on the impact of the low fare on the aggregate modal share of public transport in the metropolitan area. On one hand, all else equal, low fares make for more competitive public transport. But the evidence also suggests that for most riders of choice, quality trumps fare, so that when transit subsidies come at the expense of quality of service (comfort, reliability, passenger information systems), as is the case in the Buenos Aires urban area, the public transport ridership balance is unclear. In particular, Gwilliam (2017) reports evidence from London that reductions in public transport fares are less likely to bring about mode share changes in favor of transit than service quality improvements.
There are also a number of other dimensions along which the subsidies need to be assessed. First there are concerns that these artificially low public transport prices have fueled urban sprawl and related negative externalities such as excessive loss of farmland, or the need for costly infrastructure (sewage systems, roads, etc.). Second, the transit subsidy has an impact on commuting-related energy expenditures and CO2 emissions. This is closely linked to the impact of lower fares on both transit ridership
– which is less carbon-intensive than travel by private cars – and in parallel on location decisions of households in the Buenos Aires urban area. Whereas higher public transport mode shares would tend to decrease emissions, lower transport costs would also enable households to settle further from job centers, thereby lengthening commuting distances and increasing CO2 emissions. The net effect is a priori
ambiguous.
Finally, transit subsidies are generally believed to be pro-poor, enabling the poor to maintain a reasonable level of accessibility to jobs. Evidence however suggests that in Buenos Aires Metropolitan area, transit subsidies disproportionately benefit the middle income class rather than the poor (Bondorevsky 2007). If the aim of the transit subsidy is to provide the poor with urban transport options then the targeting is inefficient, resulting in both bad resource use and low accessibility for the poor.
In this context this paper examines the spatial development, welfare, redistributive and environmental impact of cost recovery fares under a range of different policy scenarios that could potentially cushion the impact of fare increases. The scenarios that we scrutinize are the uncompensated removal of the public transport subsidy, its replacement by a lump sum transfer, and its replacement by two different construction subsidy schemes. The first construction subsidy device assumes that a fixed share of the construction costs is subsidized wherever construction occurs, while the second device targets specific zones that benefit from high transit accessibility within the urban area. Special attention is paid to the lump sum transfer counterfactual as it is theoretically optimal and because there is a rich history of cash transfers in Argentina, in particular following the 2001 crisis. The outcomes of counterfactual scenarios
2 In April 2016, fare increases were introduced with the minimum bus fare doubling from AR$ 3 in 2014 to AR$ 6.
3
are compared to the baseline and the results are assessed along four dimensions: 1/ the aggregate welfare or efficiency impact on residents, 2/ the impact on the internal structure of the urban area and on sprawl, 3/ the impact on commuting related CO2 emissions and 4/ the redistributive impact of each policy scenario
with a focus on the poorest households in the urban area of Buenos Aires.
To investigate the respective impacts of cost recovery fares associated with compensatory policy options along the efficiency, spatial, environmental and redistributive dimensions, we use a simple land-use transport interaction model calibrated for the urban area of Buenos Aires, NEDUM-2D (Viguié and Hallegatte 2012), which can account for all these dimensions. Many land use – transport integrated models (LUTI) exist and the applied research community has made great progress on these in the past decades. No single LUTI model however is perfect and the choice of the most appropriate model is very dependent on the research question and the degree of detail/simplicity which is expected. A number of criteria explain the choice of NEDUM-2D: 1/ it is a simple and understandable model – not a black box; 2/ it is one of the only ones that describes the housing and land market with micro-economically founded behaviors; 3/ it is not a data greedy model which makes it usable in data scarce situations and 4/ it is a dynamic model which can capture the impacts of shocks and transitions, including adjustment costs. As we will see below, however, the model is not able to capture all the mechanisms that would be required to answer all questions, and we explore options for further developments.
A series of results emerge from our exercises which paint a complex picture of transit subsidies and alternative cost-recovery options in the urban area of Buenos Aires. First, there are efficiency/welfare gains associated with replacing the transit subsidy by a lump sum transfer. These are non-negligible when subsidization rates are high. In the case of Buenos Aires, the average gains would correspond to an extra US$ 325 per household when expressed in equivalent income or 1.75% of the average household’s annual budget in 2014. Our definition of welfare includes only consumption of housing space and other goods. For example, we do not explicitly account for distributional impacts or various externalities such as the access of the poorest to economic opportunities and the associated benefits of social inclusion. Nor do we feature specific preferences such as preferences for low density housing. For these reasons we will refer to consumption-related welfare in the rest of the paper.
Second, the removal of the transit subsidies leads to moderate reductions in urbanization over time. This indicates that the argument that low transit fares could fuel large amounts of sprawl in the future and associated infrastructure costs are likely to be overplayed. The changes in the internal structure of the urban area of Buenos Aires are much larger however with higher densities close to jobs and a decrease in the average distance to jobs triggered by the removal of the subsidy, which in turn reduces commuting distances. So, although public transport ridership decreases in the medium to long term as a result of the fare increase, the increase in commuting related CO2 emissions is expected to remain limited. In fact, if
the transit subsidy is replaced by a targeted construction subsidy, the model predicts a net reduction in emissions by 0.7%. The most CO2 intensive policy alternative is the lump transfer with emissions increasing
by more than 5% in 2050.
Thirdly, whereas some efficiency gains are to be expected from replacing the transit subsidy by a lump sum transfer, these will come at the expense of short term harsh redistributive impacts for the heaviest users of public transport. These negative redistributive impacts are stronger as the distance to the city center increases. For tenants, they will be partially mitigated over the medium term by land and housing markets mechanisms whereby the hardest hit areas of the urban area will see a decrease in housing rents reflecting lower accessibility. This adjustment in housing prices will benefit tenants and newcomers to the urban area but will penalize homeowners residing in these areas as they will face both higher commuting
4
costs and lower resale values of their dwellings. The high rate of home ownership, across all income groups in Buenos Aires, including the poor, increases the negative impact of higher transit prices.
The remainder of this paper is structured as follows. Section 2 provides a literature review of the welfare, spatial, environmental and distributional impacts of transport and construction subsidies. Section 3 describes the history and functioning of transit subsidies in Argentina and Buenos Aires in particular. Section 4 investigates the welfare impacts of a public transport subsidy in a very simplified urban economics framework and describes the mechanisms at play. Section 5 describes the principles and mechanisms of the land use – transport modeling framework, NEDUM-2D, used in the remainder of the paper to assess the impacts of the transit subsidy in Buenos Aires and of alternative policy options. It also shows how simulations compare to data which serves to validate the use of the model. Section 6 describes the various cost-recovery options studied and how they affect the extent of the urban area and the CO2
emissions from commuting as well as households’ welfare. Section 7 investigates the distributional impacts of removing the public transit subsidy and replacing it by a lump sum transfer for all income groups in the urban area of Buenos Aires. Finally, section 8 concludes.
2 Literature review
There is a relatively well established literature focusing on the link between welfare and transport subsidies starting with Mohring (1972). This seminal paper argued that in the presence of scale economies in public transport provision (for example because a train or a bus is indivisible), marginal cost pricing schemes would lead to low public transport ridership which in turn would result in low frequencies and long (and sub-optimal) waiting times for users. This Mohring effect would warrant public transport subsidies so as to reduce waiting times and increase welfare. The magnitude and even the existence of the Mohring effect is however debated (Estupiñán et al. 2007). Gwilliam (2017) in his recent review on transport pricing emphasizes that if urban transport can be considered as a “merit good”, i.e. a good which is undervalued by its consumer and the consumption of which generates positive externalities, this would provide a theoretical basis for subsidization. There are reasons to argue that urban transport indeed is a “merit good” as the accessibility for example to an increased number of jobs generates positive externalities through larger and more integrated labor markets (Rosenthal and Strange 2004). Other scholars (I. W. Parry and Small 2009; I. W. H. Parry and Timilsina 2010; Basso and Silva 2014) have built models and frameworks which aim at identifying optimal transportation policies in urban settings in the presence of externalities such as congestion, CO2 emissions contributing to climate change, air pollution
and road fatalities. All these papers find positive welfare effects associated with transit subsidies. But they argue that transit subsidies are only a second best and are dominated by policies which affect congestion (the main negative externality) more directly such as congestion tolls, gasoline taxes or dedicated bus lanes. However, these models are non-spatial in essence and although they are evaluated in urban settings they do not represent households’ locational decisions explicitly. This means that they miss the tradeoff between housing and transport costs and may underestimate the benefits that policies which decrease transport costs may bring (because they can also decrease housing costs for residents) and conversely overestimate the benefits of policies that increase transport costs such as congestion tolls.
The reliance on non-spatial models also means that it is not possible to shed light on the urban expansion consequences of transit subsidies and their associated costs. To fill this gap, scholars have resorted to the classic urban economics framework based on the pioneering works of Alonso (1964), Mills (1967) and Muth (1969). In urban economic theory, a decrease in transport costs tends to flatten the land and housing rent curves thereby encouraging residents to settle further away from the city center and displacing the urban area’s boundary outwards (see for example Fujita (1989)). Whether transport subsidies lead to urban sprawl when the decrease in transport costs is financed through income taxation is however not as
5
trivial. Brueckner (2005) tackles this issue and shows that despite the higher tax burden needed to finance a transport subsidy, the transport cost reduction dominates the tax burden effect and leads to urban sprawl. He also concludes that if the transport system displays constant returns to scale, the subsidy is welfare reducing. Building on Brueckner’s work, Su and DeSalvo (2008) develop a monocentric model with two modes, cars and transit, which are characterized by different fixed and marginal costs as in LeRoy and Sonstelie (1983). The authors also employ empirical methods. They find that car subsidies tend to increase the size of urban areas while transit subsidies would reduce sprawl. In both cases the effects are limited in magnitude. Conversely, while they do not directly assess the spatial impact of any transport subsidization scheme, Gonzalez-Navarro and Turner (2014) study the impact of subway system construction in 138 cities around the world and conclude that they have caused population decentralization. It is not obvious how to make sense of these contradictory results. There are a number of subtle mechanisms at play, which would push the overall net result in one direction or another: 1/ a higher tax burden to finance the transit subsidy would tend to curb sprawl by reducing available income for housing space consumption; 2/ the lower transport cost would push the urban area’s boundaries outwards; and 3/ because public transit is by nature more localized than road (think of bus or urban rail stops for example) we could have a combination of more concentrated population with transit subsidies around transit stops and a larger urban footprint.
Scholars have also investigated the distributional impact of transit subsidies by distinguishing between income groups (Estupiñán et al. 2007; Basso and Silva 2014) but also between renters and landowners (Borck and Wrede 2005, 2008). Basso and Silva (2014) find that congestion pricing, dedicated bus lanes and, more importantly for this paper, transit subsidies unambiguously increase the welfare of the poorest. Borck and Wrede (2005, 2008) use a monocentric model with two income classes to study the reasons for popular support to transport subsidy schemes despite clear inefficiencies. Their conclusions are less straightforward. When only one transport mode is available, they show that transport subsidies can benefit all residents in the case of absentee landowners at the expense of the landowners. When conversely all land is owned by residents of the urban area, commuting subsidies lead to a distributional antagonism between central residents and suburbanites. While the rich would benefit at the expense of the poor if they reside in the periphery, benefitting proportionately more from the subsidy, the poor do not necessarily benefit if they live on the outskirts (Borck and Wrede 2005). Borck and Wrede (2008) then complete their model by introducing two distinct transport modes, cars and public transport. In this case the conclusions are much more subtle as the winners and losers depend not only on their location within the urban area and whether they are landowners or not but also on the commuting mode they use. Finally, Estupiñan et al. (2007) conduct an in-depth review of real world transit subsidy schemes and focus on whether they are pro-poor. They find that whereas in developed countries transit subsidies mainly benefit the poor, this is mostly not the case in developing countries where transit remains a luxury good. The authors argue that, as the more wealthy urban residents benefit more than the poorest, a lump sum transfer would actually be a better device to reach the poor than a transit subsidy. In particular, they document that the transit subsidy program in the Buenos Aires region disproportionately benefits the middle income class rather than the poor, although subsidized fares are available to all. There are indeed significant errors of exclusion, defined as the share of the poor (the bottom quartile) not benefitting from transit subsidies because they do not use transit. For bus users the error of exclusion was as high as 70% in 2002 and 60% in 2006 (Bondorevsky 2007). Conversely the errors of inclusion, defined as the share of beneficiaries which are non-poor was 59% in 2002 and 75% for bus users in 2006 (Bondorevsky 2007). These figures indicate that if the aim of the transit subsidy is to provide the poor with urban transport options then the targeting is inefficient, resulting in both bad resource use and low accessibility for the poor.
6
To the best of our knowledge, the most comprehensive effort at addressing welfare, spatial, environmental and distributional impacts of transport subsidies is a paper by Tscharaktschiew and Hirte (2012). The authors develop a Computable General Equilibrium model, inspired by Anas and Xu (1999) and Anas and Rhee (2006), which includes many real world features such as congestion, polycentric urban structures, multiple household types, different trip purposes and endogenous labor supply among others. They calibrate their model so as to reproduce the main features of an ‘average’ German city and test a wide range of urban transport subsidies schemes; one of them being a variant of a transit subsidy in the form of a reduced sales tax rate on public transport fares. The authors find that transit subsidies lead to only low levels of suburbanization, are welfare enhancing (including for landowners) and decrease CO2
emissions.
The urban economics literature is surprisingly silent on the issue of construction subsidies, despite the acknowledgment that land and housing markets are central to urban development. Construction and buildings have rightfully been investigated because their durability imposes some path dependencies in cities (Duranton and Puga 2015). Other scholars have focused on the impact of building height regulations on welfare and spatial expansion (Bertaud and Brueckner 2005) and on environmental externalities such as CO2 emissions (Borck 2016). It is however surprising that in a world which faces large housing deficits
(estimated to be a billion homes according to UN-Habitat), especially in the rapidly urbanizing developing countries, little attention has been paid to the potential impact of construction subsidies. This is perhaps even more surprising as the compact city concept has gained a lot of attention as a sustainable urban growth trajectory (OECD 2012). Indeed, whereas compact cities carry the potential to reduce commuting related CO2 emissions, their critics often argue that they would lead to higher housing costs (Krupp and
Acharya 2014) and the actual densification of an urban area would prove difficult because taller buildings are typically too costly (Castel 2007). In this respect, construction subsidies – justified by the positive externality of higher densities – seem like an a-priori promising avenue to reduce the housing deficit while enabling the construction of taller building and therefore achieving more compact and sustainable cities without leading to strong housing price increases. As Glaeser (2009) puts it “The best thing that we can do for the planet is build more skyscrapers.” A notable exception to this silence is Helsley and Strange (2007) who develop an urban economics model where positive externalities are generated by social interactions. They find that a construction subsidy can increase the housing supply near the city center and lead to a densification of the urban area which would promote social interactions and therefore increase social welfare.
3 Public transport subsidies in the metropolitan area of Buenos Aires
Following the 2001 crisis and the peso depreciation which led to spiraling inflation in Argentina, public transport fares were frozen (or increases were restrained) in an attempt to dampen the impact of rising prices and protect the incomes of the poor. In parallel, the costs of operating public transit systems increased strongly in part as oil imports were purchased using a devaluated currency. The government provided direct (supply-side) subsidies to operators in order to maintain public transport service in a post-crisis period. While buses (colectivos), which today account for 87% of the public transport ridership, were not subsidized prior to the 2001 crisis, subsidies now account for over two-thirds (71%) of their operating costs. The average commercial fare of AR$ 3.5 can be compared to the AR$ 12 average fare necessary to achieve cost recovery. On the regional railway and metro (SUBTE) systems subsidization rates today represent respectively 94% and 68% of operating costs. Their passenger market shares are however much lower than for buses at 7% and 6%. In total, the public transport subsidies in the Area Metropolitana de
7
Buenos Aires (AMBA) amount to AR$ 25 billion or around US$ 5.4 billion3 in 2012 which represents close
to 0.7% of Argentina’s GDP.
While public transport is subsidized in other metropolitan areas in Argentina, the subsidization rates are lower and the minimum bus fares are higher: AR$ 6 and AR$ 9.15 in Mendoza and Córdoba respectively for example compared to AR$ 3 in AMBA.
The public transit subsidies in Argentina are currently financed by the Treasury (85%) and SISTAU (Sistema Integrado de Transporte Automotor) for the remaining 15%. The SISTAU funds are based on a 18.5% tax on gasoline while the Treasury funds are channeled through the RCC (Régimen de Compensatión Complementaria). Together the Treasury funds and SISTAU finance 72% of the operating costs of public transport systems in AMBA while earnings from travel fares account for the remaining 28%.
How does this compare to other cities worldwide? These public transport subsidization levels are commonplace in developed countries; for example they reach around 70% of operational costs for the largest 20 cities in the United States (I. W. Parry and Small 2009), 55% in London, 70% in Paris (Institut Montaigne 2012) and the Millennium database reports similar figures for many developed country cities around the world (Kenworthy, Laube, and Vivier 2001). In developing country cities however, public transport subsidies are very low or non-existent. In this respect, Argentina and above all the Metropolitan area of Buenos Aires are exceptions (Basso and Silva 2014).
Beyond the general discussions about public transport subsidy merits and potential inefficiencies that are mentioned in the introduction and literature review, there are a couple of specific points that deserve to be reported here. First, public funds have an opportunity cost, meaning that when they are mobilized for financing public transit systems, they are not available for other priorities such as education, health and sanitation for example. While public funds have opportunity costs in all countries and at all times, the necessity to allocate them wisely is arguably more critical in a developing country which is recovering from a major economic crisis as occurred just above a decade ago and where fiscal resources are likely to be scarcer than elsewhere. The need to evaluate whether these resources should be sunk into public transit subsidies or not is even more pressing as Argentina is an exception in the developing world in its choice to instore a transit subsidy scheme.
Second, the design of the scheme is conducive to some inefficiencies and perverse effects. Indeed, the supply side subsidies from the government are calculated so as to cover the deficits of the private transit operators. The latter therefore do not have any incentive to rationalize their operations and seek inefficiencies in their system as this would only result in a reduction of the subsidy level received from the government.
Thirdly, the massive level of subsidies poured into the public transit systems cover only the operational costs and leave very little available fiscal resources for investments and crucial maintenance of the public transport infrastructure. The lack of investment and maintenance has led to a slow degradation of the infrastructure and to the impossibility of keeping pace with urban growth through the addition of new routes or extension of existing ones.
The Argentine government is well aware of these issues and is exploring ways in which to reduce the fiscal burden of public transport subsidies without adversely impacting the poorest 40% of households which crucially rely on transit to reach jobs and other services. In early April 2016, fare increases were
3 All monetary values were converted into US$ for data consistency. The exchange rate that is used throughout this
8
implemented with a doubling of the minimum fares for buses and trains (fares for colectivos now stand at min AR$ 6; trains AR$ 4); and recently fares for SUBTE (metro) also increased. Operating subsidies for buses have been reduced to 66%. Alongside this process, the government has also been offering demand-side subsidies to protect the poor from these fare increases. In this study we do no account for the changes in transit fares that took place in 2016 and rely on the subsidization levels and fares prior to these increases.
4 What is the efficiency of public transit subsidies and other policies?
To explore the efficiency of transit subsidies in a general case we will compare these to a policy option whereby transit subsidies are removed but a lump sum redistribution of the total initial transit subsidy savings is introduced. Comparing transit subsidies to a lump sum transfer is justified because lump sum transfers are usually deemed to be a more efficient public intervention as they do not distort household choices toward the consumption of a specific good, in this case transport. The comparison of the outcomes of a transit subsidy with that of a lump sum transfer through the measurement of households welfare and landowners’ profit in an urban economy aims to provide a benchmark for measuring the (in)efficiency of a transit subsidy (through orders of magnitude). We will focus distinctly on households’ and landowners in order to untangle the impacts of removing a public transit subsidy and compensating through lump sum transfers for each group of actors in the urban economy.
4.1 A simple model to compare lump sum transfers to transit subsidies
To investigate the efficiency of public transport subsidies, we will first focus on a very simple and schematic case. We use a monocentric model based on the works of Alonso (1964), Mills (1967), Muth (1969) and comprehensively described in Fujita (1989). This model displays one city center which is the commuting destination of all households of the urban area (the CBD). There is only one transport mode and we run the model in a static framework, i.e. at equilibrium with only one time period. In this simple model, residents derive utility from housing space and a composite good :
, , ( , ) . . ( ) + ( ) ( ) + ( ) ≤ + (1)
Each worker has to commute once a day to the CBD, and this commuting entails transportation costs ( ). All households are supposed to earn the same income and – at the equilibrium – they have the same level of satisfaction described by a utility function . The level of rents per square meter (or, equivalently, the annualized real estate price per square meter) is ( ), at each location in the city. Each household maximizes his utility function under the budget constraint described in (1) by choosing where to settle in the urban area , how much housing space to consume and what to spend on other goods . The term represents the annual amount accruing from land rents per household which is recycled in the urban economy in the form of increased incomes.
In parallel, developers decide how much floor space to build and where in the city. They do so by choosing the amount of capital to invest at a specific distance to the city center ( ) in order to maximize their profit function which also represents land values.
( ) = [( ( ) − ) ( ), ( ) − ( + ) ( )] (2)
The amount of floor space built and the annual land rents depend on an exogenous specific construction technology which displays decreasing returns to capital: ( ) = ( ( ), ( )). These decreasing returns to capital will cap the building heights and as consequence the total amount of residential floor space. Developers will only invest large amounts of capital to build tall buildings when the anticipated rents they
9
expect will offset the extra building costs. The edge of the city is given by a transaction cost below which it is no longer profitable to build. At the edge of the city ( ) we therefore have = . The term found in (1) can schematically take on one of two values depending on the type of model used: Closed City model with Absentee landowners (CCA) or Closed City model with Public ownership of land (CCP). In the closed city model with absentee landowners (CCA), landowners are supposed to live outside the urban area which means that land rents are not recycled in the local economy in the form of increased incomes. In this case = 0. At the opposite end of the spectra, if all land plots are supposed to be owned by a local government (or by all households in equal shares) then = ( ) , where is the number of households in the urban area.
The functional forms used in this paper as well as more details on the construction function can be found in appendix 10.1
4.2 Numeric simulations: Aggregate welfare description of results
4.2.1 Impacts on tenants and landowners of replacing a transport subsidy with a lump sum
transfer
Solving the static model described in 4.1 with specific functional forms described in Appendix 10.1 in the closed city model with Absentee landowners (CCA), it can be shown that the impacts of replacing a transport subsidy by a lump sum transfer are complex. We run a numerical model with a number of realistic values for key parameters and data values for the model in 2012 described in Appendix 10.2, but with the assumption of a unique transport mode, linear transport costs, no land regulations and with a transaction cost of zero. We also assume, as in Parry and Timilsina (2010), that public transport displays constant returns of scale, meaning that only the variable costs of transport are accounted for and not the fixed costs linked to infrastructure provision. This is a reasonable proxy for buses which constitute the main public transport means. We run simulations for a large range of subsidization/taxation levels: from a 100 percent taxation level to a subsidization level equivalent to two-thirds of the transport costs. Impacts of these transportation policies on tenants’ welfare and landowners’ aggregate profits are depicted in Figure 1 and Figure 2.
10
Figure 1: Comparison of tenants’ consumption-related welfare with transport subsidies and lump sum transfers in a Closed City model with Absentee landowners (CCA).
Figure 1 shows that transport taxes/subsidies (transport taxes are the negative values on the x-axis while subsidies are the positive ones) are generally detrimental to tenants’ welfare when compared to lump sum transfers. This is visible from the curve representing the ratio between tenants’ utility with subsidies and with lump sum transfers mostly being lower than one. However, there are some values of the transport subsidies for which tenant’s consumption-related welfare is higher with subsidies. These welfare improving subsidization rates are 9% and 17% with the optimal subsidization rate being 9% and with welfare improving very slightly by 0.03% by comparison to lump sum transfers which makes it visually difficult to discern on Figure 1.
The transport subsidy relaxes tenants’ budget constraint and allows them to settle further from the city center, thereby consuming more floor space and land at a cheaper unitary rate. As such a transport subsidy transfers rents from landowners to tenants as can be seen in Figure 2.
11
Figure 2: Comparison of Aggregate Landowners’ profit with transport subsidies and lump sum transfers in a Closed City model with Absentee landowners (CCA).
When the subsidization rate is positive, it can be seen that landowners’ aggregate profit decreases with the subsidy relative to lump sum transfers in a closed city model with absentee landowners. The opposite is true for transport taxation which increases landowners’ profits. The implicit transfer of wealth from landowners’ to tenants triggered by the transport subsidy is sufficient to increase tenants’ welfare relative to lump sum transfers for specific subsidization rates as documented above (Figure 1).
In Buenos Aires urban area, as documented in section 3, public transport is subsidized by around two-thirds. We are therefore mainly interested in depicting the impacts of a drastic subsidy of 67%. It can be shown that replacing this level of transit subsidy with a lump sum transfer:
increases household utility by 5.20%
increases Aggregate Landowners’ Profits by 20%
We can draw two conclusions from this section. First, transport subsidies are not unambiguously negative for tenants in a closed city model with absentee landowners (CCA). In fact, low levels of transport subsidies (between 9% and 16%) can marginally increase tenants’ consumption-related welfare relative to lump sum transfers. This impact can be interpreted as a wealth transfer from landowners to tenants and is consistent with findings in Gusdorf and Hallegatte (2007). Second, a transport subsidization rate as high as 2/3 of the transport cost constitutes a less efficient means of improving both welfare and land rents
12
than a lump sum transfer. In particular transport subsidies hurt landowners quite harshly compared to a lump sum transfer.
Household utility and landowners’ profits are however difficult to compare because landowners’ total profit is measured directly in monetary terms, whereas households’ utility level is a convenient yet abstract construction which cannot be directly translated into a monetary value. We would, however, like to understand how a transit subsidy performs against a lump-sum transfer policy through one unique indicator.
4.2.2 Moving toward a city model with land rents recycling in the local economy
One way of achieving a unique indicator of the welfare impact of transport subsidy for landowners and households is to incorporate landowners’ proceeds into the households’ utility function by switching to a Closed City model with Public ownership of land. As detailed above, in such a model, landowners’ rents are recycled in the local urban economy through increased household incomes. This corresponds to a case whereby, = ( ) . This is equivalent to assuming that one dollar has the same value for tenants and for landowners, or that both groups have the same marginal utility of consumption. While this representation is still a simplification, it does make sense for Argentina where the rate of dwelling ownership is very high, close to 80% over all income quintiles (Fay 2005, pp 93) reported for the early 2000s. It also allows us to take into account the impacts of transit subsidies and lump sum-transfers on land rents in the form of a welfare impact.
With a fully closed city model with public ownership of land, it can be shown that the optimal subsidization/taxation level is zero (Figure 3), which is consistent with findings from Brueckner (2005) and Gusdorf and Hallegatte (2007) among others.
13
Figure 3: Comparison of household consumption-related welfare with transport subsidies and lump sum transfers in a Closed City model with Public ownership of land (CCP).
While the uncompensated removal of the transit subsidy (equivalent to two-thirds of the transport costs) leads to 22.6% decrease in household utility, the compensation in the form of a lump sum transfer yields a 5.7% increase compared to the baseline scenario with transport subsidies. This result confirms the economic intuition that cash transfers are preferable to subsidies because they allow households to choose how to use them, thereby providing them with a supplementary degree of liberty.
But these results should be interpreted with caution for a number of reasons. First, the increase in consumption-related welfare triggered by switching from a transport subsidy to a lump sum transfer depends on the level of recycling of land rents into the local economy. Second, this increase in welfare depends equally on the rate of subsidization of the transport system. In both cases, welfare improvements from replacing the subsidy by cash transfers are higher when 1/ the ratio of land rents recycling into the local urban economy is high and 2/ the transport subsidization rate is high. Both these effects are depicted in Table 1:
14
Transport subsidization rate
1/3 1/2 2/3
Share of land rents recycled in
the local urban economy 0: Absentee landowners (cca) 0.2% 1.3% 5.2% 0.2 0.3% 1.4% 5.4% 0.5 0.4% 1.6% 5.7% 0.8 0.4% 1.7% 5.9% 1: Public ownership of land (ccp) 0.5% 1.8% 6.1%
Table 1: Consumption-related welfare impacts of replacing a transport subsidy by a lump sum transfer as a function of subsidization rates and ratio of land rents which are recycled into the local urban economy.
Table 1 shows that potential welfare gains are large with a lump sum transfer rather than a transport subsidy, especially if subsidization rates are high and land rents are recycled in the local urban economy, which is the case in Buenos Aires. This warrants a more in depth exploration of the welfare impact of transit subsidies in a more realistic model tailored for the urban area of Buenos Aires.
This picture omits two important dimensions of the discussion. The first is the dynamics of urbanization and in particular how each policy influences urban sprawl and its associated infrastructure costs and transport emissions. The second is the re-distributional impacts of each policy. To look into these dimensions we need a model which is spatially explicit so as to capture realistically the urbanization trajectory of the urban area of Buenos Aires and how the poor will be affected by an increase in public transport fares. The next section will present the model that we use in the rest of this paper while sections 6 and 7 will address the urban sprawl, environmental, welfare and political economy issues involved with public transit subsidies and other alternative policy options.
5 Dynamic model NEDUM-2D
5.1 General principles of NEDUM-2D
A theoretical framework that reflects the interplay between households’ localization decisions, project developers’ construction decisions and transport costs is required to evaluate the impacts of removing public transport subsidies in an urban area. The NEDUM-2D model (Non Equilibrium Dynamic Urban Model) developed in CIRED (Viguié and Hallegatte 2012) is well suited to conduct such a study.
This tool is an extension of the standard urban economic model such as defined by Fujita (1989) building on the pioneering works of Alonso, Mills and Muth at the end of the 1960s (Alonso 1964; Mills 1967; Muth 1969). It aims at explaining the variation in land costs in cities and thus the level of real estate prices together with the distribution of the households and buildings in an urban area. Classically, it is based on two very simplified, yet realistic, fundamental mechanisms. First, households, when choosing where to live, trade off between the proximity to the city center and the level of real estate prices (or equivalently between the proximity to the city center and the size of the dwelling they will occupy). Second, the project developers (or landowners4) maximize their profits and choose to build more or less housing surface in a
given place depending on the level of real estate prices. The higher the real estate prices, the denser the developers choose to build. We assume that the land is publicly owned (or equivalently owned in equal value shares by all households of the urban area) and that the annual rents generated are entirely recycled
4 A standard calculation (Fujita, 1989) proves that this hypothesis does not change the results of the model : in the
model, the reasoning and the calculations that are conducted are identical whether project developers have to rent or buy the land from landowners.
15
into the local economy in the form of increased income. A description of the analytical framework used to express these mechanisms can be found in Appendix 10.1 which goes into the details of the main analytic relationships but section 4.1 has already introduced these in their most basic form.
NEDUM-2D differs from the standard model developed in Fujita (1989) for three main reasons. First, it can be used dynamically, which enables to take into account the effect of a global change in income or population. As explained in Gusdorf et al. (2008), urban economics has mostly been used to explore the characteristics of long run equilibria. However, the existence of urban stationary equilibria is questionable: when population, transport prices, or income vary (sometimes in unpredictable ways), housing infrastructure cannot adapt instantaneously to changing conditions. NEDUM-2D explicitly takes these dynamics into account and describes cities as non-equilibrium systems. The model can also be run at the equilibrium for a specific year if data for a larger time period are not available.
Second, the theoretical model described by Fujita (1989) represents spatial differences solely as a function of the distance to the city center. As the name suggests NEDUM-2D is two dimensional meaning that it is an urban model that represents urbanization on a map rather than on a single axis. NEDUM-2D uses a grid with cells of variable size (classically 1km²). It can therefore account for spatial differences in land use and accessibility at a much finer scale. The model can represent differences between two cells situated at the same distance from the city center such as the amount of land that can be built upon or the proximity to public transport.
Third, the classic urban economy model only represents one means of transport. In NEDUM-2D there are three main transport options: private cars, public transport and walking. For each location in the urban area, citizens choose between walking, public transport and private vehicles, or a combination of these as a means for commuting. The competition between these modes is organized on the basis of their generalized costs (i.e. the total cost including both the cost of time and the monetary costs incurred during the trip to the city center). It is assumed in this study that modal switch does not affect congestion levels and therefore leaves commuting times unchanged. In order to reflect the heterogeneity of citizens’ preferences in terms of transport modes we employ a discrete choice model (De Palma and Thisse 1987). We follow a common approach in transportation economics by using a multinomial logit model which assigns usage probabilities to each transport mode (see Salon 2009; Washbrook, Haider, and Jaccard 2006). This method ensures that even when one mode is much cheaper than the others, it will not be used by all residents in a location for all trips.
In the present study, we use this model with a certain number of simplifying hypotheses. First, we assume that all households commute every day to the center of the Ciudad Autónoma de Buenos Aires (CABA), where jobs are assumed to be located. This mono-centric hypothesis is a clear simplification but one that is widely used in the literature and that finds some support in the data for the specific case of Buenos Aires. Indeed, the Buenos Aires region displays a strong mono-centric structure. For instance, in 2012 more than 40% of all jobs in the Buenos Aires region are localized in CABA even though CABA only represents 5.3% of Region Metropolitana’s area (see Appendix 10.1.5 for a more in-depth discussion about the validity of the mono-centric assumption for the Buenos Aires urban area) 5.
Second, NEDUM-2D also relies on the hypothesis that all households within the urban area earn the same average income. It does not currently account for multiple household types and thus ignores income
5 Projections for 2012 based on Censo Nacional Economic 04/05 (CNE 04/05) and Encuesta Permanente de Hogares,
16
inequalities6. This simplification is acceptable for some indicators such as the extent of urbanization.
However it can have some impacts for NEDUM-2D’s ability to capture the dispersion in rents and real estate prices around an average. Indeed, real estate prices are strongly affected by neighborhood characteristics among which social segregation can play a role. We will overcome this limitation to a certain degree below by interacting our results with a map of current income dispersion.
5.2 Geographic scope of the study
The study area is slightly larger than what the INDEC (Instituto Nacional de Estadística y Censos de la República Argentina) defines as the Gran Buenos Aires (GBA). GBA encompasses 24 fully or partially urbanized partidos and the City of Buenos Aires (CABA). Supplementary to the 24 partidos of GBA, our study area also includes 3 other partidos. Altogether the study area that we will name GBA+ in the rest of this report can be broken down as follows:
The city of Buenos Aires (CABA)
14 fully urbanized partidos that belong to GBA:
Avellaneda Lanús San Isidro
General San Martín Lomas de Zamora San Miguel
Hurlingham Malvinas Argentinas Tres de Febrero
Ituzaingó Morón Vicente López
José C. Paz Quilmes
10 partially urbanized partidos that belong to GBA:
Almirante Brown Florencio Varela San Fernando
Berazategui La Matanza Tigre
Esteban Echeverría Merlo
Ezeiza Moreno 3 partidos that do not belong to GBA
Escobar Pilar Presidente Perón
The Gran Buenos Aires covers more than 3,800 km² of land and the GBA+ area is close to 4,000 km².
5.3 Validation of NEDUM-2D on the urban area of Buenos Aires (GBA+)
With a limited amount of data describing the size of the population, households’ income, the transport system, land use, construction costs, households and developers’ behavior, the mechanisms described above can reproduce the structure of an urban area in a fairly accurate way. This section aims at demonstrating this for the Buenos Aires region7. Appendix 10.2 provides an in-depth description of the
data and parameters used in the simulations both for 2012 and for the projections.
The last phase in applying the NEDUM model to a city is to run a calibration procedure. This is done by comparing results (map of urbanized area, real estate/rents, population and housing density) to observed
6 A version of NEDUM-2D that is able to represent multiple household types differing by annual average income is
currently being developed in CIRED.
7 The model has been successfully applied to the urban area of Paris (Avner, Rentschler, and Hallegatte 2014; Viguié
17
data. Overall, the NEDUM-2D model is very robust as it relies on very simple basic economic behaviors that are likely to remain true both through space and time. As a consequence the calibration process is mostly done through refining the data that are used to inform the model. However, a very limited number of parameters can then be marginally modified so as to minimize the discrepancies between observations and model results.
Map 1 : The simulated and real urban area of the GBA+ region in 2012. The green shade corresponds to the simulation whilst the black is geographic data. The dark green shade shows areas where the model accurately predicts urbanization. Light green shows areas where the model inaccurately predicts urbanization. Black stands for areas where the model fails to reproduce urbanization. Finally where the map is yellow, there is no urbanization and the model agrees with the data.
It can be seen from Map 1 that the simulated and the actual urban area in 2012 coincide quite well within the GBA+ region (which appears in light yellow). The model captures the general size of urbanized area but also its shape and specific urbanization directions along the transportation network. There are however some discrepancies even within the GBA+ boundaries. In particular it can be seen that the map misses some areas towards the North and the North West of the GBA+ region. This can mainly be explained either by the existence of local secondary employment centers that attract settlements or the presence of local amenities.
The shape and size is one among other features of an urban area. Below we compare data with simulations for the distribution of land values and population densities.
18
Figure 4 : Simulated and actual land values as a function of the distance to the city center.
Figure 4 shows the classic result that land values decline as the distance to the city center increases both in the data and the simulations. It shows land value data represented by grey circles as well as the average of the data (dashed blue line). The green area captures the spread of the simulations for a given distance to the CBD, while the red plotted line represents the average of the simulation. The one dimensional R2
coefficient – comparing the averages of the simulation and the data – is 0.68 meaning that the model can explain 68% of the one dimensional variance in the data. The two-dimensional R2 coefficient – comparing
the each pair of simulation and data points locally – is lower at 34%. As we move closer to the city center, the model tends to either underestimate or overestimate land values. In particular, the model fails to reproduce the spike in land values visible around km 10. There is also quite a lot of dispersion in the data (grey dots) which is only partially captured by the model (simulation boundaries are represented by the light green area). This dispersion in the data is highest in the vicinity to the city center.
This phenomenon is likely to be explained by social segregation processes and the existence of amenities (such as good schools). As the NEDUM-2D version we use in this study only accounts for one average social group it fails to reproduce the segregation mechanisms. More generally land values are in reality not only determined by land developers’ behavior. Land is subject to speculation and performs a ‘reserve value’ function that the model does not account for. Indeed, within the urban economics framework, the value of land is determined only by its value as an input in housing production. It is likely that this partial representation of the value of land leads to some discrepancies as the ones discussed above. For this reason, where they are available (not the case in Buenos Aires), it is better to calibrate land use transport models based on rents rather than land values. They indeed display much more regularity across time and space and are less subject to speculative behaviors.
19
Figure 5 : Simulated and actual population densities for all radios in GBA+ as a function of the distance to the city center.
Figure 5 has the same color codes and purpose as Figure 4 but looks into whether and to what extent the simulations and the data agree for population densities at the census tract level (households/km2). A
similar conclusion can be drawn from the figure, that there is a general agreement on the shape of the two curves representing the averages of the data and the simulations. In particular, toward the city center, both curves display similar spikes and slumps. The model’s spread also captures a large share of the data points (grey circles), although there is a greater dispersion in population densities of radios (census tracts) within 10km of the CBD that the model only partially accounts for. The one-dimensional R2 coefficient is
high at 0.95 meaning that the model can explain 95% of the variance between the simulation and data average. The two-dimensional R2 coefficient comparing data and simulation at the census tract level, and
20
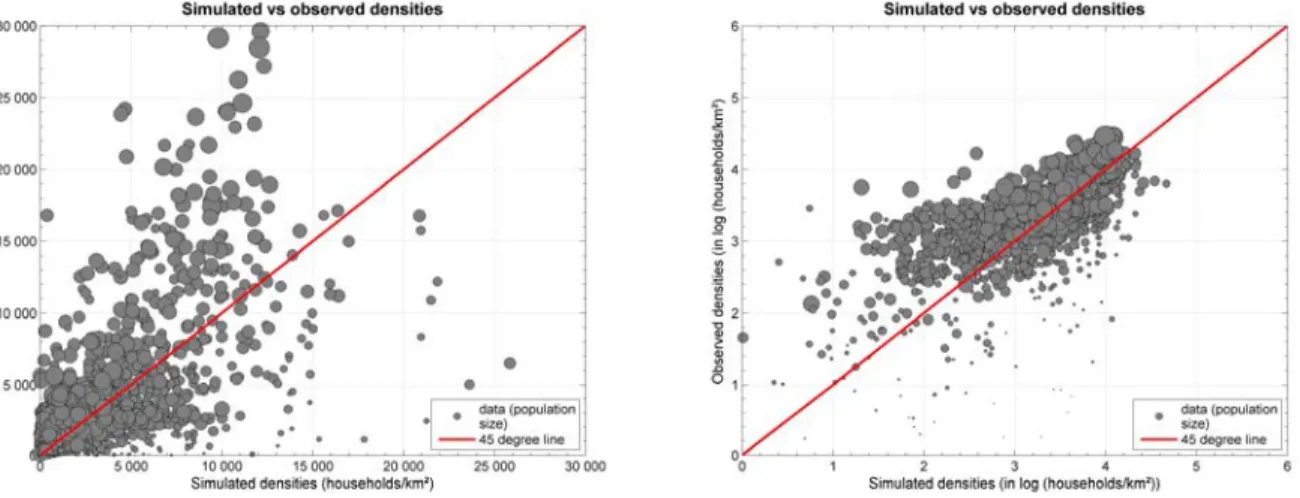
Figure 6: Comparison of simulated (on the x-axis) and observed (on the y-axis) population densities (densities on the left and log10 numbers on the right) at the zonificaciòn administrative level. The size of the bubbles is proportional to the population in each administrative unit.
Figure 6 usefully complements Figure 5. It shows on a scatter plot the differences and agreement between simulated and observed population densities at the zonificaciòn administrative level, which is slightly larger than a census tract. The closer the grey bubbles are to the 45 degree line, the better the correspondence between simulated and observed densities. Bubbles above the red line indicate that the model underestimates densities while bubbles below indicate overestimation. The left panel of Figure 6 shows a clustering of points toward the bottom left quadrant around the 45 degree line, indicating small discrepancies in absolute terms. The model however struggles to reproduce higher densities. It can indeed be seen that as the observed population densities increase beyond 15,000 households per square.km, corresponding simulated densities tend to remain around the 10,000 household per square.km threshold. The right panel of Figure 6 shows the same comparison in log format and is a useful complement to the right panel. It shows the clustering of points along the 45 degree line but indicates that, although small in absolute terms, the discrepancies are highest in relative terms for lower densities which the model tends to underestimate. Overall, when excluding areas where population density is low, below 10 households per hectare, in 46% of the census tracts (radio censales) and 51% of the slightly larger administrative units (zonificaciòn), the absolute variation between simulated and observed density is below 50%8.
The model is reasonably accurate (i.e. less than 50% variation) at medium distances (around 10 km from the city center). However it tends to overestimate population densities going towards the south of the city center and the North. It also clearly underestimates population densities as we move towards the urban fringe of the GBA+ region. As argued above, spatial discrepancies, in particular towards the urban area edge can be explained by the existence of secondary employment centers, social segregation or local amenities that NEDUM-2D does not model, and which attract households. Some major employment centers, indeed exist toward the North, Northwest and West of the urban area, precisely where it appears that NEDUM-2D underestimates population densities.
Finally, the model is also validated against several figures that describe mobility behaviors for households in the Buenos Aires metropolitan area. The mode share for public transportation, which is determined
8 If the population density threshold is lower, for example one and five households per hectare, then the agreement
between the model goes down to 44% and 45% at the census tract level but remains stable at 50% and 51% at the zonificaciòn level. If the population density threshold is increased to 20 households per hectare, the agreement goes up to 49% at the radio level and stays at 51% at the zonificaciòn level.
21
endogenously in NEDUM-2D, is 56%, very close to the 57% average figure reported by the ENMODO mobility survey for the AMBA region (Ministerio del Interior y Transporte 2010). The average commuting times computed by the model is 54 minutes so slightly higher than, yet in the same magnitude order as the 44 to 49 minutes reported by ENMODO.
While we have shown some local discrepancies between model results and data, the calibration of NEDUM-2D is satisfactory overall for the main features of the internal structure of Buenos Aires urban area: size and shape of the urban footprint, population distribution, land values, average commuting times and mode shares. Improving the NEDUM-2D modelling framework so that it can account for multiple employment centers would improve the fit of the model to data. This endeavor is left for the future, with the belief that although it will add some realism, it will not modify the main conclusions of the current analysis.
6 Policy analysis: Urban sprawl, emissions and welfare
6.1 Evolution of the urban area in the baseline
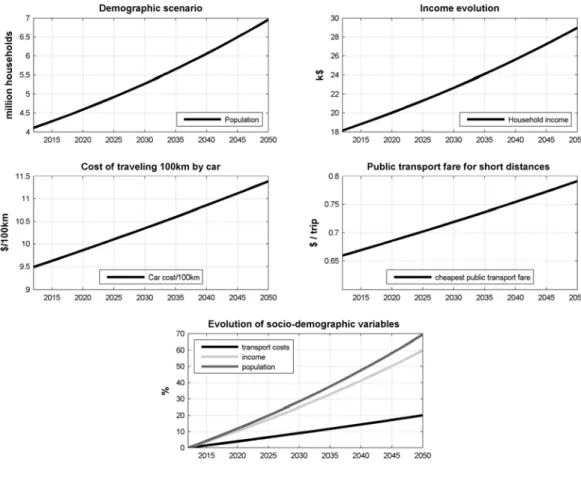
In order to investigate the impact over time of the removal of public transport subsidies and alternative scenarios, our study relies on projections of various inputs to the NEDUM-2D model from 2012 to 2050; in particular the future evolution of transport prices, income and population. In the baseline scenario population and income are supposed to pursue their recent trends over the next four decades. In particular, incomes are assumed to grow at the same average annual rate as Argentina’s per capita net income over the 1970 – 2015 period (in constant 2010$), i.e. 1.24%, starting at US$ 18,140 in 2012 and reaching close to US$ 29,000 in 2050. The number of households in the urban area will evolve at the same annual pace as it did over the 2001 – 2012 period, reaching a little over 6.96 million in 2050. In the baseline scenario the prices of fuel and public transport fares increase at an identical pace to reach 120% of their 2012 levels in 2050. The evolution of these demographic and economic variables are summarized in Figure 7. It is also supposed that the current subsidization rate of public transport remains unchanged over time – around 2/3 of public transport fares. These inputs are a priori identical in the alternative counterfactual scenarios, unless the policies investigated explicitly impact some variables such as transit fares. Robustness to these assumptions on the evolution of main socio-economic variables is explored below with a high growth scenario.
22
Figure 7: Evolution of the population, income and transport costs in the urban area of Buenos Aires over the 2012 – 2050 period in the baseline scenario.
With these main input variables feeding the NEDUM-2D modeling framework we can show the evolution of the urban area over time. It can be seen from Map 2 that, as the population and incomes increase so does the consumption of land in the urban area. The extra urbanization in the simulations occurs mainly in the North along the major transport corridors. The urbanized area increases from 2568 km2 in 2012 to
2750 in 2050. This 7.1% increase can seem low. It can be explained by two main reasons. First, whereas population increases always lead to more land consumption in an urban area, income increases have an ambiguous effect. On one hand higher incomes increase the demand for housing space which will translate into more construction and floor space throughout the urban area but also into housing consumption at the fringe which pushes the boundaries of the urban area. On the other hand, higher incomes also mean higher opportunity costs of time thereby increasing the generalized transport costs and promoting density. This effect is far from being negligible as on average in the urban area of Buenos Aires time costs represent 72% of the generalized transport costs in 2012 and increase over time, as time opportunity costs increase more than monetary transport costs, to reach 76% in 2050. So time costs are a strong limit to sprawl.
Second, the model underestimates future urban expansion because it misses urbanization that occurs outside of the GBA+ area, represented as the light yellow background layer in Map 2, due to lack of data on public transport costs and times beyond these boundaries.
23
Map 2: Evolution of the Buenos Aires urbanized area over time in the baseline scenario.
We also built a second baseline scenario, to test how sensitive the urban expansion is to our assumptions about the evolution of the main datasets in the model. In this scenario, population in the urban area and the average household income double between 2012 and 2050 reaching respectively 8.2 million households and US$ 36,290. The monetary transport costs for cars and public transport evolve in parallel and decline by 10% over the simulation period. This scenario, by combining a decrease in transport costs and high growth rates of both population and incomes – all factors conducive to sprawl (Brueckner 2001), naturally leads to an increase in the urbanized area. This increase however, here again remains moderate with 396 extra urbanized km2 between 2012 and 2050 (compared to 182 km2 in the previous scenario), a
still modest 15% growth over the period. These results are indicative that the amount of new urbanization that is likely to take place over the next four decades in the Buenos Aires urban area is not very sensitive to socio-economic and demographic evolutions to come, that is if the spatial structure of the urban area remains reasonably similar to what it is today.
24
Map 3: Evolution of the Buenos Aires urbanized area over time in the baseline scenario with higher population and income growth as well as a decrease in transport monetary costs.
6.2 Description of alternative policy scenarios
6.2.1 Public transport subsidy removal
In this scenario, after 2012, public transport subsidies are removed which translates into a tripling of the public transport fares paid in the baseline scenario. This scenario is an extreme as any policy is likely both to increase fares less drastically and, in any case, more gradually. It is however useful to understand clearly the impacts of removing public transport subsidies and the resulting new urban trajectory. The results from this scenario can thus be interpreted as the maximum impact any public transport subsidy phasing out policy could likely entail. The transit subsidies, which are removed in this scenario, amount to US$ 4.22 billion. This figure is of the same order of magnitude as the reported transit subsidy volume for the urban area of Buenos Aires of US$ 5.4 billion (see section 3). As this figure emerges endogenously from NEDUM-2D, it is one supplementary indication of the realism of the model.
6.2.2 Lump sum transfers of the public transport subsidy to households
In this scenario where public transport subsidies are removed, the total savings are channeled to households on a lump sum basis. Note that we assume the money does not go to the rest of the country. As a result each household receives US$ 1,030 – 1,230 extra annually or, presented differently, around 4-5% of the average household income depending on the year in the urban area per year. This operation is neutral for local government budget but will reduce the incentive for public transport ridership. We will document the impact of this lump sum transfer on households’ location decisions and well-being.


![[PDF] Cours complet pour debuter avec GarageBand 3 | Cours informatique](data:image/gif;base64,R0lGODlhAQABAIAAAP///wAAACH5BAEAAAAALAAAAAABAAEAAAICRAEAOw==)