Publisher’s version / Version de l'éditeur:
Journal of Architectural Engineering, 12, December 4, pp. 178-186, 2006-12-01
READ THESE TERMS AND CONDITIONS CAREFULLY BEFORE USING THIS WEBSITE.
https://nrc-publications.canada.ca/eng/copyright
Vous avez des questions? Nous pouvons vous aider. Pour communiquer directement avec un auteur, consultez la
première page de la revue dans laquelle son article a été publié afin de trouver ses coordonnées. Si vous n’arrivez pas à les repérer, communiquez avec nous à PublicationsArchive-ArchivesPublications@nrc-cnrc.gc.ca.
Questions? Contact the NRC Publications Archive team at
PublicationsArchive-ArchivesPublications@nrc-cnrc.gc.ca. If you wish to email the authors directly, please see the first page of the publication for their contact information.
NRC Publications Archive
Archives des publications du CNRC
This publication could be one of several versions: author’s original, accepted manuscript or the publisher’s version. / La version de cette publication peut être l’une des suivantes : la version prépublication de l’auteur, la version acceptée du manuscrit ou la version de l’éditeur.
For the publisher’s version, please access the DOI link below./ Pour consulter la version de l’éditeur, utilisez le lien DOI ci-dessous.
https://doi.org/10.1061/(ASCE)1076-0431(2006)12:4(178)
Access and use of this website and the material on it are subject to the Terms and Conditions set forth at
Application of hygrothermal modeling tool to assess moisture response of exterior walls
Mukhopadhyaya, P.; Kumaran, M. K.; Tariku, F.; Van Reenen, D.
https://publications-cnrc.canada.ca/fra/droits
L’accès à ce site Web et l’utilisation de son contenu sont assujettis aux conditions présentées dans le site LISEZ CES CONDITIONS ATTENTIVEMENT AVANT D’UTILISER CE SITE WEB.
NRC Publications Record / Notice d'Archives des publications de CNRC:
https://nrc-publications.canada.ca/eng/view/object/?id=1bd752a4-e856-40a6-863b-93c3f9222446 https://publications-cnrc.canada.ca/fra/voir/objet/?id=1bd752a4-e856-40a6-863b-93c3f9222446
http://irc.nrc-cnrc.gc.ca
Applic at ion of hygrot he r m a l m ode ling
t ool t o a sse ss m oist ure re sponse of
ex t e rior w a lls
N R C C - 4 7 6 8 4
M u k h o p a d h y a y a , P . ; K u m a r a n , K . ; T a r i k u , F . ;
v a n R e e n e n , D .
A v e r s i o n o f t h i s d o c u m e n t i s p u b l i s h e d i n
/ U n e v e r s i o n d e c e d o c u m e n t s e t r o u v e
d a n s : J o u r n a l o f A r c h i t e c t u r a l
E n g i n e e r i n g , v . 1 2 , n o . 4 , D e c . 2 0 0 6 , p p .
1 7 8 - 1 8 6 d o i :
1 0 . 1 0 6 1 / ( A S C E ) 1 0 7 6 -0 4 3 1 ( 2 -0 -0 6 ) 1 2 : 4 ( 1 7 8 )A
PPLICATION OF
H
YGROTHERMAL
M
ODELING
T
OOL TO
A
SSESS
M
OISTURE
R
ESPONSE OF
E
XTERIOR
W
ALLS
By Phalguni Mukhopadhyaya
1, Kumar Kumaran
2, Fitsum Tariku
3and
David van Reenen
3ABSTRACT
The moisture design of exterior walls in a building envelope is an important task that needs to be carried out systematically to generate a sustainable and healthy built environment. Many conventional methods or practice guidelines are available for this purpose, based primarily on local traditions and with limited performance assessment records. In recent years, with the rapid development of global free trade and economy, new wall systems and unconventional materials have been introduced in every part of the world for reasons such as aesthetic appeal, cost-effectiveness and so on. However, neither the long-term moisture management performance of these new wall systems nor the uses of unconventional materials have been assessed in a systematic way. The primary reason for this lack of assessment is the absence of a design-oriented methodology to perform the task. This paper presents selected results from a recently completed research project that demonstrate that it is indeed possible to assess the moisture management performance of exterior walls in a systematic way, using a hygrothermal modeling tool together with key inputs from a limited number of laboratory and field investigations. In this project the hygrothermal responses of exterior walls and their components were
1
Research Officer, Institute for Research in Construction, NRC Canada, Ottawa, Ontario, Canada. 2
Principal Research Officer, Institute for Research in Construction, NRC Canada, Ottawa, Ontario, Canada.
assessed with a novel moisture response indicator, called the RHT index, which is derived from relative humidity and temperature data over a time period. The results and discussion presented in this paper clearly show the need and usefulness of the application of hygrothermal simulation tool for the optimum moisture design of exterior wall systems in various geographic locations, when sufficient information is available from laboratory and field experiments.
CE DATABASE SUBJECT HEADINGS: Application Method; Building Envelope;
Building Design; Moisture; Performance Characteristics.
INTRODUCTION
Since the inception of the design-based approach for the generation of modern infrastructure, the building construction industry has focused mostly on the safe design of structures against natural, accidental and mechanical loads. However, functional modern buildings not only need to be structurally sound but they also should be durable, sustainable, energy efficient, environment friendly and a healthy comfortable place for the occupants. These essential performance requirements for the functional role of a building require a multidisciplinary approach to be adopted for building design. From this point of view, moisture design for the exterior building envelope is a very important component in the overall design process of the building. Inappropriate design for moisture management can seriously compromise the long-term performance of the building envelope and comfort of the occupants as was evident from the recent failures in Vancouver, British Columbia, Canada (Barrett, 1998).
The design of exterior walls is becoming more and more complicated owing to more stringent requirements for air-tightness and thermal resistance. Increased air-tightness and
thermal resistance certainly make the building a more energy-efficient system. However, they also bring new considerations for appropriate vapor diffusion control strategy and moisture management.
The role of the building envelope is to protect the indoor environment from external forces arising from outdoor weather loads. The exterior walls are primarily subjected to moisture and thermal (i.e. hygrothermal) load gradients in addition to wind loads. The moisture and thermal gradients basically arise from the differences in outdoor and indoor relative humidity (RH) and temperature (T) conditions. The temperature of the exterior wall surface is also influenced by the solar radiation and long-wave sky radiation. The magnitude and nature of the hygrothermal loads vary with time and the hygrothermal response of building materials and wall systems are also time-dependent. As a result, water vapor or liquid moisture is transferred across the exterior building envelope. As such, the movement of water vapor across the wall assembly does not inherently cause any undesirable effects on the building envelope. However, if the presence of vapor inside the wall assembly coincides with the dew-point temperature, condensation of water vapor takes place. Liquid water from rainfall can penetrate inside the wall through leakage paths and water vapor condensation can also happen due to air leakage. A high concentration of moisture inside the building envelope assembly for a prolonged duration is not acceptable as it can cause severe damage to the structure and environment. In order to avoid such eventualities designers and building envelope practitioners have used various manual analytical tools (TenWolde, 2001) such as the Dew Point Method, Glaser Diagram, and Kieper Diagram, to predict the condensation plane in the exterior wall assembly based on steady-state calculations of heat and moisture transfer. It is quite
obvious that outputs from these tools are not time dependent and, hence, have limited utility for assessment of the long-term moisture response of the wall assembly. However, in the recent past, with the advent of modern computers and advanced numerical algorithms, the prospect of using hygrothermal modeling tools having the capacity to perform transient heat and moisture transfer calculations has become a reality (Trechsel, 2001). These models have many advanced features such as use of recorded field weather data for defining boundary conditions, variable material properties, and other useful inputs that are based on laboratory and field observations.. The outputs from these modeling tools can be used to identify moisture and temperature distribution patterns in the wall assembly over a period of time. The transient nature of the calculations and outputs provides a designer an opportunity to assess the long-term moisture performance of the exterior wall assembly. More specifically, it gives the opportunity not only to identify the wettest area of the wall assembly but also the duration of the wetting period. However, this is only a first step towards assessing the long-term moisture performance of the wall assembly. During the design process, usually the performance of a material or system is expressed in terms of 'reference values' (Hendricks & Hens 2000) or a yardstick value. Hence, it is necessary to further analyze the hygrothermal simulation outputs so that the performance of various wall components, construction techniques and wall systems can be assessed in an objective manner that can help to optimize various design considerations for the exterior wall assembly. This paper outlines one approach that uses hygrothermal simulation tool and the results from the laboratory and field observations to optimize the moisture management capability of the exterior wall systems.
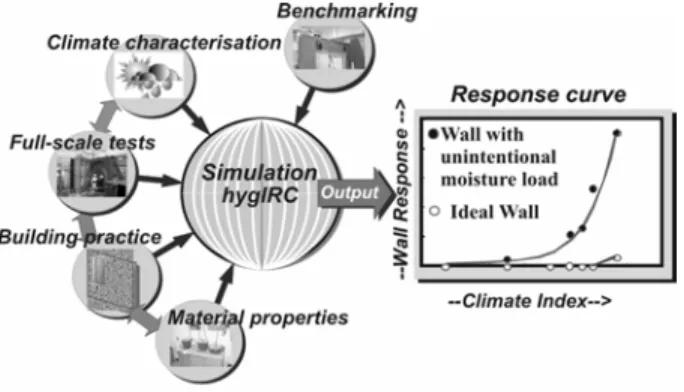
At the Institute for Research in Construction (IRC), National Research Council (NRC) of Canada, a research consortium project called ‘Moisture Management for Exterior Wall Systems (MEWS)’ was initiated to technically support the development of guidelines for moisture management strategies applicable to low-rise wood-frame exterior wall systems in North America. The project has resulted in a novel methodology that leads to design considerations for improved moisture management strategies (Kumaran et al. 2003) for any exterior wall assembly in any geographic location. This methodology effectively integrates (Figure 1) observations from field practices (Rousseau et al., 2002), measured hygrothermal properties of building materials (Kumaran et al., 2002a), defined environmental loads (Cornick et al., 2002), results from the penetration of simulated wind-driven rain experiments (Lacasse et al., 2003) and results from parametric analyses using a benchmarked hygrothermal modeling tool called hygIRC-2D (Maref et al., 2002, Mukhopadhyaya et al., 2003a,b). The overall outline of this methodology has already been published elsewhere (Kumaran et al. 2002b, 2003).
This paper presents selected results from the MEWS project that demonstrate the strength and utility of a hygrothermal simulation tool (e.g., hygIRC-2D) for the moisture design of exterior wall assemblies when adequate experimental observations, required as input to the simulation tool, are available. The outputs from these hygrothermal simulations are further analyzed using a novel moisture response indicator, called the RHT index (Kumaran et al. 2002b and Mukhopadhyaya et al. 2002), derived from relative humidity (RH) and temperature (T). At this moment, in absence of experimental benchmarking, RHT index can only be used for relative comparison of moisture responses of various wall systems. However, when the benchmarking exercise for the RHT index is completed
RHT index could be an absolute indicator of moisture performance. This novel approach of using a modeling tool and a moisture response indicator (i.e. RHT index) for investigating the moisture management characteristics of the exterior building envelope and the selection of appropriate building materials for optimum moisture management has the potential for useful applications in building envelope construction.
Why Modeling?
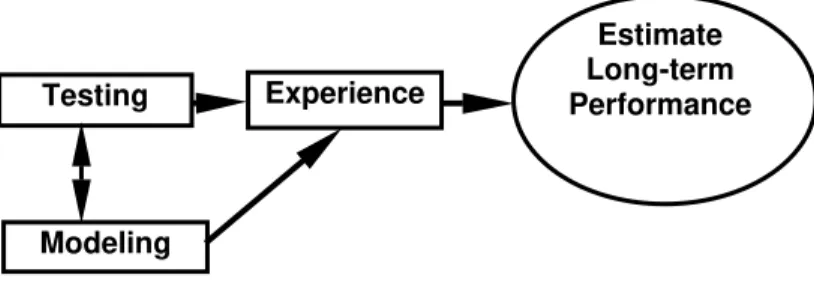
Modeling tools provide a designer with the flexibility and independence to experiment with various feasible design options before zeroing in on the most promising ones. When considering the significance of moisture in the design of wall assemblies, modeling tools can help identify building components that stay 'too wet' for 'too long’. The criteria that define 'too wet' and 'too long’ conditions, for all material components of the wall assembly, have to be determined either through laboratory experiments and/or field observations. However, at this moment the criteria for 'too wet' and 'too long’ conditions are not easily available. Nevertheless, even in absence of these criteria, the modeling tool can help assess the relative risk of moisture problems that arise due to climatic variations and construction practices. However, it is important to recognize that the results obtained using modeling tools can only help a building envelope designer estimate the long-term moisture performance of exterior walls when those results are supported by adequate laboratory experiments and field experiences (Figure 2). The advantage then is that the same set of information can form the basis of any number of sets of numerical analysis. No separate sets of laboratory and field information need to be generated.
Hygrothermal models are mathematical tools that can be used for moisture design of building envelopes (Hens 1996). IRC/NRC's modeling tool for hygrothermal simulation,
hygIRC-2D, is continuously evolving as a research tool. Interested readers can refer to the
publications by Karagiozis, 1993,1997; Karagiozis et al., 1996; and Djebbar et al., 2002a,b for further details. These publications outline the formulation of the combined heat, air and moisture transport equations used in hygIRC-2D and the techniques used to solve them numerically. The reliability of hygIRC-2D outputs has been established through laboratory measurements and benchmarking exercises (Maref et al. 2002).
The hygrothermal modeling tool hygIRC-2D accommodates many advanced features, such as transient heat, air and moisture (liquid and vapor) transport, two-dimensional spatial formulation, variable material properties with moisture content and temperature, air flow through building materials, the effect of solar radiation, presence of moisture source inside the material, freeze-thaw effect, and many other useful features.
In addition, hygIRC-2D can define accidental moisture entry of any quantity into the wall assembly as a function of time at any location on the wall. This moisture entry function is the final outcome of a laboratory experiment and no detailed run-off and drainage are modeled at present. This feature has been used extensively in this study.
To define the construction of the wall system, hygIRC-2D has a pre-processor that allows the user to divide a wall into a number of layers, both in the horizontal and vertical directions.
The effective use of this type of advanced numerical tool to analyze and obtain meaningful results, however, demands a proper physical understanding of the problem,
an appropriate definition of input parameters and the ability to judiciously interpret the results.
There are a number of major input parameters required for hygIRC-2D simulation, such as:
1. Wall construction details 2. Material properties 3. Boundary conditions 4. Exposure duration
5. Initial moisture content and temperature
6. Accidental moisture entry, quantity and location
The following sections outline these input parameters as applicable for this study.
Inputs for Hygrothermal Simulation
Wall Construction Details
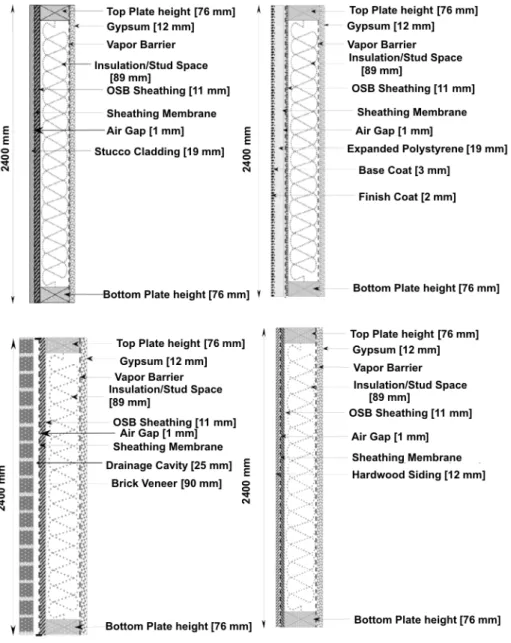
Figure 3 describes the construction details of four basic types of wood-frame walls considered with different exterior cladding systems: Stucco, Exterior Insulation and Finish Systems (EIFS), Masonry, and Hardboard or Vinyl siding.
Material Properties
Simulation using hygIRC-2D requires eight sets of material properties: air permeability, thermal conductivity, dry density, heat capacity, sorption characteristics, suction pressure, liquid diffusivity, and water vapor permeability. These properties were taken from the MEWS material properties database (Kumaran et al. 2002a). They were carefully determined in IRC's Thermal and Moisture Performance Laboratory following current
practices or standard test procedures. The materials considered are also representative of currently available building materials that are commonly used in North America.
Boundary Conditions
The two main boundary conditions are the outdoor/exterior condition and the indoor/interior condition.
The exterior boundary condition is defined by specific weather data and has seven components: temperature, relative humidity, wind velocity, wind direction, radiation (direct, diffused and reflective components), horizontal rainfall, and cloud index.
Three typical weather years, representing a Wet, Average and Dry year, were selected for this study. The selection methodology for these years is described in the publication by
Cornick et al. (2002).
The interior boundary conditions considered are the indoor temperature (T) and the indoor relative humidity (RH). A summer and winter setting of RH and T were simulated in accordance with ASHRAE recommendations (ASHRAE Applications Handbook, Chapter 3) as:
25% RH (constant) and 22°C temperature for winter, and 55% RH (constant) and 25°C temperature for summer.
The summer and winter seasons were identified according to the criteria specified in "Specifications to National (Canada) Energy Code for Houses”, (Swinton & Sander,
1994), and are defined as follows:
Mean monthly outdoor temperature < 11ºC for winter, and Mean monthly outdoor temperature > 11ºC for summer.
This study considers a total of three years of exposure duration. In all cases, the first two years are wet years (same year repeated), while the third year is an average or dry year. The exposure duration for each year started on 1 January and ended on 31 December.
Initial Moisture Content and Temperature
In any hygrothermal simulation, the user defines the initial moisture content of each wall component at the beginning of the first year. It is assumed in this study that the initial moisture content of each wall component is equivalent to the corresponding relative humidity of 50 percent, derived from the sorption isotherm of the respective materials. The first year of the simulation is considered to be an initial conditioning period, and all the observations are made on the basis of the hygrothermal response of the wall assembly during the second and third years. Similarly, the initial temperature across the entire cross section of the wall is assumed to be 20°C.
Accidental Moisture Entry, Quantity and Location
hygIRC-2D has the capability to inject a certain quantity of moisture that has entered
accidentally at any location of the wall and at any time (hourly). The quantity of accidentally entered moisture inside the wall and its location were determined from the output of full-scale and small-scale laboratory tests done in the MEWS project (Lacasse
et al. 2003), and from external weather data (rainfall, wind speed and wind direction). In
other words, the rate of accidental moisture entry is a function of the rate of wind-driven rain, the air-pressure difference and the type of deficiency in the wall system.
As observed in the full-scale and small-scale tests, a typical location for accidentally entered moisture to settle down is at the bottom of the insulated stud cavity. Hence, the quantity of accidentally entered moisture, determined from the laboratory observation
and exterior weather data, is injected at every hour and evenly distributed inside the thin insulation layer of thickness 57.5 mm at the bottom of the stud cavity, on the top of the bottom plate. Due to the high open-porosity of the glass fiber insulation the injected moisture quantity could be accommodated without surpassing its saturation moisture content. There is no provision in the hygIRC-2D model at this moment for liquid water drainage or runoff. Moisture can transport to the surrounding elements through diffusion mechanisms (vapor or liquid water) and gravitational free liquid water flow is not permitted in the model.
ANALYSES OF HYGROTHERMAL SIMULATION RESULTS
Approximately 450 simulations were done for the MEWS project on four types of walls (i.e. stucco, EIFS, masonry and siding). A significant amount of data was generated by
hygIRC-2D simulations and subsequently post-processed for the detailed evaluation of
the hygrothermal response of the walls. However, this paper will discuss only selected results from the walls with stucco and masonry claddings to demonstrate the applicability of hygrothermal modeling for the moisture management design. A comprehensive documentation of all results for all four basic wall types is available in Mukhopadhyaya et al. 2003a.
Typical Outputs from hygIRC-2D
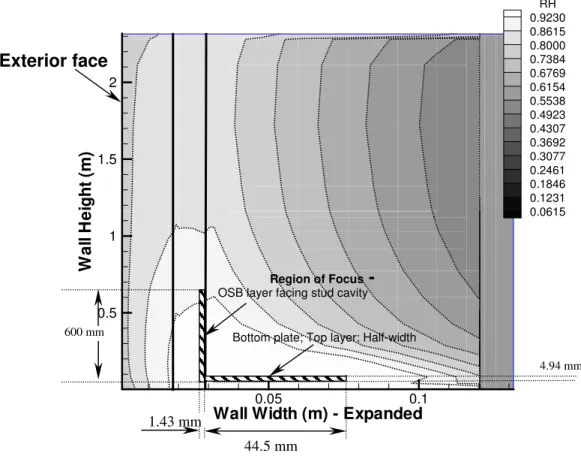
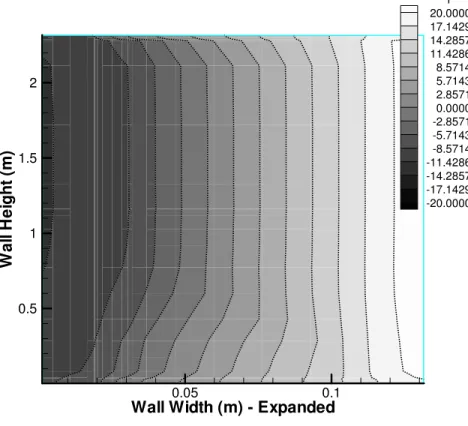
The basic outputs considered for the parametric analyses are the relative humidity (RH) and temperature (T) contour plots (Figure 4) across the vertical cross-section of the wall assembly. These contour plots were generated at midnight, every 10th day for the duration of the simulation/exposure period. The user of the model can choose any other desired interval for the output. It is obvious from these contour plots that both RH and T vary
across the cross section. The critical area of the wall cross-section is the one where both RH and T cross certain threshold values for a prolonged time. Extracting RH and T values, at different time intervals, of the critical cross-section area (also called ‘region of focus’) can easily characterize this phenomenon (Figure 5).
RHT Index - Assessing Excessive Risk of Deterioration
As shown in Figure 5, the extracts from the hygrothermal simulation results provide an opportunity to have a close look at RH and T conditions inside the wall assembly over a specified period of time. Although these RH and T outputs are of great use to assess the hygrothermal response or moisture management capacity of the wall assembly qualitatively, there is a great need to quantify these responses into a single value. This study uses a novel long-term moisture response indicator called the RHT index derived from the RH and T contour plots (Figure 4) over a period of time for any specific area of the wall cross-section. RH and T are given linear weight in the RHT index. It is to be noted that for many materials this may not always be the case when assessing their long-term performance while subjected to varying and heightened moisture conditions. A different weighting for RH and T can be determined only through controlled long-term experiments. Investigations are currently being conducted to generate additional information on specific building materials and components (Mukhopadhyaya 2003c). However, the RHT index as defined in this study is:
Cumulative (2nd & 3rd year) RHT=∑ (RH-RHX)×(T-TX), [1]
for RH>RHX% and T>TX°C at every 10 days interval.
Where, RHX and TX are the threshold values for relative humidity and temperature
During any time step when either or both RH ≤ RHX% and T ≤ TX°C, the RHT value for
that time step is zero. As well, for this parametric study the following user-defined threshold values have been chosen: for RHX = 95% and TX = 5°C. This is based on a
consensus that was arrived at among the MEWS consortium members as indicative of biological activities in wood and wood based products. If future investigations provide other T and RH threshold values those can be appropriately used. However, the approach described here remains the same.
The "region of focus" is the area for which the RHT index is calculated. This area should be the wettest portion of the wall assembly most of the time (Figure 4a). For all simulations presented in this paper, the "region of focus" is either a thin slice (5 mm) of the top surface of the bottom plate, extending 53 mm from the sheathing board or a thin slice (1.4 mm) of the OSB sheathing board, 600 mm in height from the bottom of the stud cavity, facing the insulation layer (Figure. 4a). The selection of the dimension of a particular “region of focus” is based on the visual observation of the relative humidity contour plots at different time intervals.
The results presented in the following section use the cumulative two-year RHT index as the single-value moisture response indicator. A higher value of RHT index indicates a greater potential for moisture-related deterioration. It is to be noted here that the threshold RHT index value that borders a safe and unsafe hygrothermal design of a wall system is yet to be defined. The authors are continuing to work on this issue as a part of the IRC’s overall on-going research on the moisture response assessment of exterior walls. It is also to be mentioned here that RHT index is one user-friendly measure of wall performance
and there are other indices (Freeze Thaw Index, Damage Function etc.) that can also be used to measure the wall performance (Djebbar et al. 2002a; Nofal and Morris 2003).
EXAMPLE – APPLICATION OF HYGROTHERMAL MODELING TOOL
The major parameters considered in the MEWS project were: (1) accidental moisture entry or water leakage inside the wall, (2) quantity of accidental moisture entry, (3) different geographic locations, (4) exterior cladding type (5) sheathing membrane type, (6) sheathing board type, and (7) vapor barrier type. It is beyond the scope of this paper to report the detailed observations from the parametric study. Interested readers may obtain the detailed outcome from the parametric study from other publications (Mukhopadhyaya et al. 2003a, 2003b). However, the discussion presented here on selected results obtained from the parametric analyses focuses on two very important issues concerning the moisture design of exterior walls and they are: (1) effect of water leakage on the exterior walls, and (2) selection of appropriate materials for the exterior walls to obtain optimum moisture management.
Effect of Water Leakage
With prevalent construction practices it is very likely that in certain instances liquid water could pass through the second line of defense. As a result there will be unwanted accumulation of moisture inside the wall assembly. The basic challenge for the building envelope designer here is to determine the extent, location and duration of long-term moisture accumulation inside the wall assembly, and control or prevent it if possible through appropriate design steps. While experimental investigation helps to identify the location and approximate the quantity of instantaneous moisture entry inside the wall (Lacasse et al. 2003) the application of a hygrothermal simulation tool can be very useful
to determine the long-term distribution and accumulation pattern of unwanted moisture inside the wall assembly during the service life.
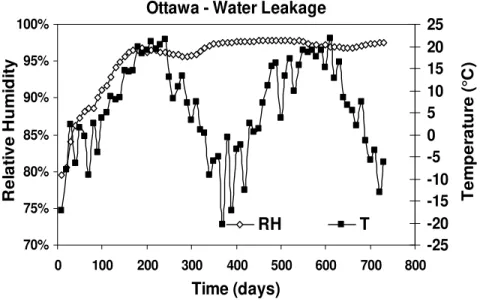
Typical output plots obtained from hygrothermal simulations of stucco walls subjected to three selected years of local Ottawa (Canada) climate are shown in Figures 5 and 6.
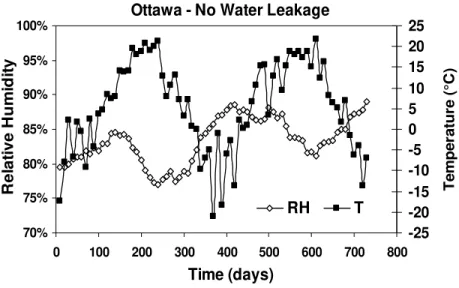
Figure 6 displays thevariation, for a period of two years, oftemperature (T) and relative humidity (RH) at a spot (i.e. region of focus) inside the wall assembly where moisture is most likely to accumulate due to accidental moisture entry inside the insulation stud cavity, as was shown in lab experiments (Lacasse et al. 2003). Figure 5 shows a plot of the response of the same stucco wall when there is no accidental moisture entry inside the wall. These figures in essence depict the most severe hygrothermal condition inside the wall assembly. In this case, accidental liquid moisture entry has certainly inflated the moisture response (RH level) but the temperature response remains the same (Figures 5 and 6). This higher intensity of moisture response (Figure 6) due to accidental moisture entry has resulted in a situation where both T and RH cross the set threshold values (95% RH and 5°C T) for the RHT index calculation. In this particular case the RHT index has changed from zero to 652 owing to accidental moisture entry. Similar simulations were done for the all four wall systems (wood-frame stucco, EIFS, masonry and siding) at five geographic locations (Phoenix, Winnipeg, Ottawa, Seattle and Wilmington) and they all showed similar effects on the hygrothermal response of the wall assembly due to accidental moisture entry. It is beyond the scope of this paper to discuss or present those results (Mukhopadhyaya et al. 2003a) in them entirety. However, selected results have been used to help explain the moisture response of stucco walls located in different
geographic locations to various quantities of accidental water entry into the wall assemblies.
Different Geographic Locations
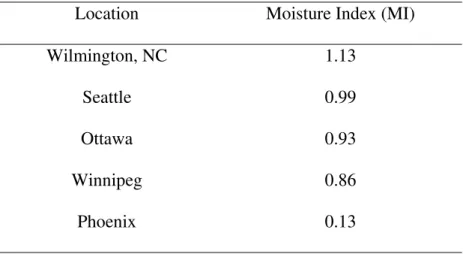
The moisture management strategy for a wall system is climate specific. The five North American locations used for this study were selected on the basis of moisture load characteristics. The moisture load characteristic of any geographic location is expressed in terms of the moisture index, or MI, and is derived from an analysis of recorded weather data for 30 or more years (Cornick et al. 2002). The MI describes the climatic moisture load and is a function of two terms, the potential for wetting (i.e. Wetting Index (WI)) and the potential for drying (i.e. Drying Index (DI)). The higher the value of MI, the more severe the moisture loading. WI is based on annual rainfall whereas DI is based on annual evaporation potential. The MI is independent of wall characteristics and design strategies that might be used to manage moisture loading. To assign rankings on the basis of climate analysis at any location in North America, the following definition is used (Cornick et al. 2002): 2 normalized 2 normalized (1 DI ) WI MI= + − [2]
The details of the normalization procedure are given in Cornick et al. 2002. The MI values for these five selected cities vary over a wide range as shown in Table 1.
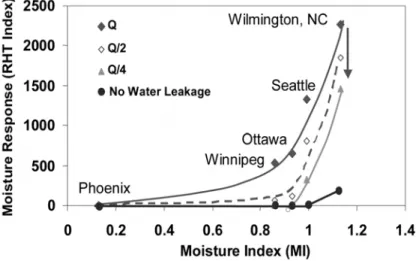
The variation in the RHT index value with the change in the MI indicates a pattern of increasing order as shown in Figure 7. As the severity of the climate moisture load increases, so does the hygrothermal response of the wall. Without accidental moisture entry or water leakage into the stud cavity, the RHT index value becomes greater than zero when the MI of a location is larger than a certain threshold value. For each of the
five North American locations, stucco walls having accidentally entered moisture show higher values of RHT index when compared with the same wall without any accidentally entered moisture. The relationship between the RHT index and MI is the basis for the MEWS methodology, further details of which can be found in related publications (e.g.
Beaulieu et al., 2002, Kumaran et al., 2002b).
Quantity of Accidental Moisture Entry
The amount of accidental moisture intrusion inside the wall's insulation cavity was determined from experimental observations in the laboratory as described earlier and their correlation with simulated wind-driven rain (Lacasse et al. 2003). It is imperative to note that the quantity of accidentally entered moisture can vary widely. To investigate the effect of such variation, simulations were completed with a specified quantity of accidental moisture entry, determined from laboratory observation and given as Q, and likewise done with moisture entry of Q/2 and Q/4 respectively.
As one would expect, the results from these simulations (Figure 7) show that the value of RHT index is decreased with a corresponding reduction in the quantity of accidentally entered moisture. From a construction and design point of view this observation alludes to: (1) the importance of detailing the junctions and joints in the construction of exterior walls, (2) the need for strategies to reduce/prevent deficiencies during the service life of the building envelope, and (3) the effectiveness of rapid drainage of the leaked water out of the wall assembly. In addition, these observations also indicate the possibility to establish a critical amount water leakage that a wall could handle at a specific geographic location before any moisture damage occurs. However, for each wall system, this critical amount of water leakage would not only be the geographic location specific but also
dependent on the location of the water leakage inside the wall system. The authors are continuing to work on this issue as a part of the IRC’s overall on-going research on the moisture response assessment of exterior walls and the results will be reported in due course.
Selection of Appropriate Materials
The selection of appropriate materials for optimum hygrothermal response or moisture management is always an important task and a great challenge for the building envelope designer. Hygrothermal simulation tools can be of great assistance in this regard. Two examples of material selection are chosen to demonstrate the versatility and utility of hygrothermal analysis using hygIRC-2D and include:
(1) Selection of cladding material properties for stucco walls, and (2) Selection of sheathing material properties for masonry walls.
Cladding Material Properties for Stucco Walls
Stucco cladding is the first component of the wall assembly to protect the indoor environment from the outdoor or external climate. Stucco (also known as ‘portland cement plaster’), as a material, has different mix-designs and components (e.g. admixtures) and the choice of mix may vary depending on where in North America it is used. Likewise, the hygrothermal properties of stucco can vary significantly (Mukhopadhyaya et al. 2002) depending on the mix-design and admixtures used.
Here, for example, a designer has to select a stucco material from the two available samples, stucco I and stucco II. Figure 8 shows the plots of RHT index vs. Moisture index (MI) for the stucco walls with these two different stucco materials at five different geographic locations. It is very clear from these plots that use of stucco II reduces the
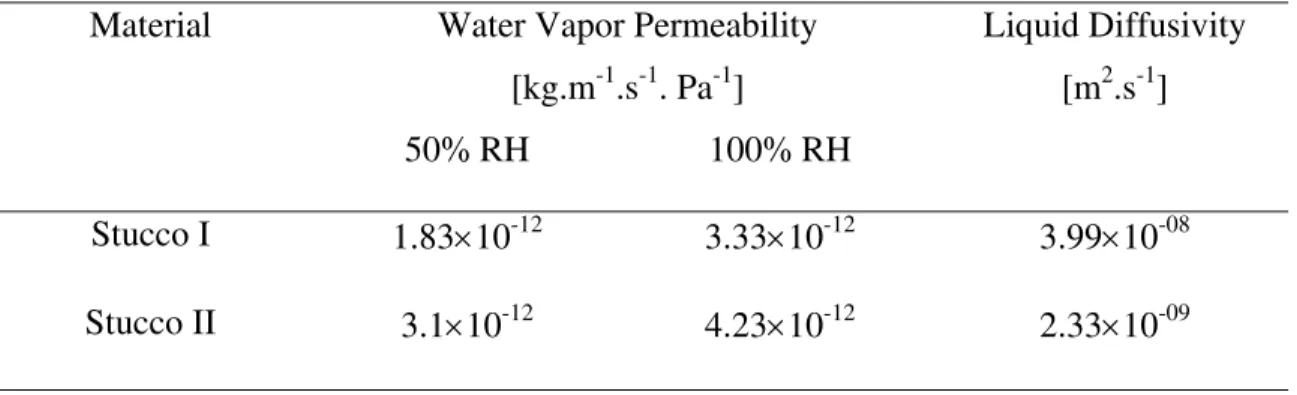
intensity of the hygrothermal response (i.e. lower RHT index) of the stucco wall. Hence, for improved moisture management, the designer might select stucco II as a material of choice. In this way, by using the hygrothermal simulation tool (i.e. hygIRC-2D) and the RHT index as the indicator for moisture management efficiency, appropriate materials can be chosen from a pool of available materials for optimum moisture management. In addition, it would be interesting and useful to explain why the use of stucco II results in improved moisture management. In order to do that, one needs to review and compare the hygrothermal properties of stucco I and stucco II. Following a review of the hygrothermal properties in question (i.e. air permeability, thermal conductivity, dry density, heat capacity, sorption characteristics, suction pressure, liquid diffusivity, and water vapor permeability) particular to stucco I and stucco II, it is evident that in this instance, liquid water diffusivity is the material property that differs significantly. Stucco II has a value of liquid diffusivity that is one order of magnitude less than that of stucco I but their water vapor permeability values are of the same order of magnitude (Table 2). The significance of a lower liquid diffusivity is illustrated in the schematics presented in
Figures 9a, 9b and 9c. Figures 9a and 9b indicate that a lower liquid diffusivity leads to lower moisture content in the stucco when it is in surface contact with water for a specified time Δt1. In practical terms, this implies that the lower liquid diffusivity in
stucco reduces the amount of moisture uptake in a given period of time. For example, as shown in Figure 9c, water deposited on the vertical exterior cladding surface due to wind-driven rain would be absorbed less in that stucco having a lower as compared to a higher liquid diffusivity.
Wood-based products are widely used in North America as sheathing board for the construction of exterior walls (Figure 3). Hygrothermal analysis of various wall assemblies using hygIRC-2D shows that the moisture response of sheathing board is very sensitive to the external climate and it accumulates moisture while exposed to an environment with high moisture loads (Mukhopadhyaya et al. 2003a). Hence, it is very important to use the most appropriate sheathing board to achieve optimum moisture management in the exterior wall assembly. An example of the selection of sheathing board for masonry walls (Figure 3) using the hygrothermal simulation tool and the RHT index is provided in the following paragraphs.
Two wood-based sheathing boards have been considered as possible components for the construction of brick masonry veneer wood-frame wall assemblies. The interest in this instance is to determine which of these two components provides acceptable moisture management or of the two, which provides enhanced performance in relation to the other. The results of hygrothermal simulation of masonry walls constructed with two different sheathing boards (board I and board II) at five different geographic locations are shown in Figure 10. These plots clearly demonstrate that the RHT index increases with the moisture index (MI) of the location and that sheathing board II consistently shows a lower intensity of moisture response (i.e. lower RHT index) at all five locations considered. Hence, it is evident that sheathing board II provides and enhanced level of performance in relation to board I. And this could be the choice of a designer when assessing moisture management in this type of wall assembly.
It is useful to understand the underlying reasons for enhanced moisture response; the hygrothermal properties of the sheathing board materials are particularly relevant. In this
case, a careful comparisons between material properties of the two sheathing boards determined that sheathing board II has a water vapor permeance (water vapor permeability: 2.08 × 10⁻¹¹
kg.m-1.s-1.Pa-1 at 50% RH, and 2.30 × 10⁻¹¹ kg.m-1.s-1.Pa-1at 100% RH) that is one or two orders of magnitude greater than sheathing board I (water vapor permeability: 8.17 × 10⁻¹³
kg.m-1.s-1.Pa-1 at 50% RH, and 5.96 × 10⁻¹² kg.m-1.s-1.Pa
-1
at 100% RH). Hence, in this case, higher water vapor permeance of the sheathing board contributed to the enhanced moisture response in these masonry wall assemblies.
It is to be mentioned that the overall moisture response of any exterior wall assembly is very much related to the hygrothermal properties of the constitutive building materials. As shown in the above paragraphs, application of a hygrothermal simulation tool (i.e.
hygIRC-2D) and use of a newly introduced moisture response indicator, the RHT index,
can help a building envelope designer to select a more suitable building material to achieve the enhanced moisture management strategies that can lead to the construction of durable and sustainable exterior building envelopes. Hence, the reliability of the approach depends on the quality of inputs that are based on several sets of laboratory experiments and field observations.
CONCLUSIONS
The selected results presented in this paper are part of a much broader study that intended to develop design considerations for moisture management in exterior walls. The results and discussion presented in this paper clearly demonstrate:
(1) The hygrothermal modeling tools are flexible and adaptable to many scenarios of construction design and moisture loads. Indeed the reliability of the simulation results
depends on the assumptions made to define the simulation input and the mechanisms related to the heat, air and moisture transport phenomenon.
(2) A novel hygrothermal response indicator, referred to as the RHT index, has been introduced for use as the yardstick for parametric evaluation.
Important features of the RHT index include:
(i) Temperature (T), Relative Humidity (RH) and duration effects are all reflected in a single value indicator;
(ii) The user defines the threshold values for T and RH, as well as duration;
(iii) The hygrothermal response at any location in or on the wall assembly can be assessed using the RHT index;
(v) The higher RHT index values indicate an increased severity of the hygrothermal response.
(3) The newly introduced RHT index can be used as a moisture response indicator to assess the long-term moisture management capability of a wall assembly and its components.
(4) Use of the hygrothermal simulation tool together with the RHT index can help building envelope designers reduce the risk of moisture mismanagement in exterior walls by:
(i) Selecting the most appropriate building materials for optimum long-term moisture management.
(ii) Identifying appropriate building envelope systems for different climates.
(iii) Developing a more clear understanding of the desirable hygrothermal properties of building materials.
(5) More specific observations or verifications of well-known building-science design principles from the modeling exercises presented in this paper are presented below. However it is to be noted that these observations are valid only with the wall systems and/or materials used in this study and may or may not be valid with other wall systems or materials
(i) The moisture response of the exterior wall system, in terms of the RHT index, is directly related to the climatic moisture load characteristics, in terms of the Moisture index (MI).
(ii) Uncontrolled water leakage into the stud cavity will lead to moisture mismanagement;
(iii) Drainage or deflection of the liquid water out of the wall assembly must be ensured for optimum moisture management;
(iv) Lower water absorption capacity of the exterior cladding can be beneficial for moisture management;
(v) Higher water vapor permeance of the sheathing material and exterior cladding can help to dry out water that has leaked into the wall assembly.
ACKNOWLEDGEMENTS
MEWS was a joint research project between IRC/NRC Canada and the following external partners:
Louisiana Pacific Corporation, Marriott International Inc., Fortifiber Corporation, EIFS Industry Members Association, EI DuPont de Nemours & Co., Canadian Wood Council, Fiberboard Manufacturers Association, Canada, Masonry Canada, Canadian Plastic
Industry Association, Canada Mortgage and Housing Corporation, and Forintek Canada Corporation.
REFERENCES
ASHRAE Applications Handbook, (1999). Chapter 3 - Commercial and Public Buildings,
American Heating, Refrigerating and Air-Conditioning Engineerrs, Inc., Atlanta.
Beaulieu, P., Cornick, S.M., Dalgliesh, W.A., Djebbar, R., Kumaran, M.K., Lacasse, M.A., Lackey, J., Maref, W., Mukhopadhyaya, P., Nofal, M., Normandin, N., Nichols, M., O'Connor, T., Quirt, J.D., Rousseau, M.Z., Said, M.N., Swinton, M.C., Tariku, F. and van Reenen, D. (2002). “MEWS Task 8 Report, Institute for Research in Construction”, National Research Council, Ottawa, Canada.
Barrett, D. (1998). “The renewal of trust in residential construction - Commission of inquiry into the quality of condominium construction in British Columbia” Submitted to the Lieutenant-Governor in Council Government of British Columbia http://www.hpo.bc.ca/Overview/Barrett1/.
Cornick, S. M., Dalgliesh, W. A., Said, N. M., Djebbar, R., Tariku, F. and Kumaran, M. K. (2002). “Task 4- Environmental conditions’. Institute for Research in Construction,
National Research Council, Ottawa, Canada, (NRCC-45222), pp. 1-106.
Djebbar, R., Kumaran, M.K., Van Reenen, D. and Tariku, F. (2002a). “Hygrothermal modeling of building envelope retrofit measures in multi-unit residential and commercial office buildings”. IRC/NRC, National Research Council, Ottawa, Canada, Client Final Report B-1110.3, pp. 187.
Djebbar, R., Kumaran, M.K., Van Reenen, D. and Tariku, F. (2002b). “Use of hygrothermal numerical modeling to identify optimal retrofit options for high-rise buildings”, 12th International Heat Transfer Conference, Grenoble, France, Aug, 2002, (NRCC-45215), pp. 1-6.
Hendriks, L. and Hens, H. (2000). “Building envelopes in a holistic perspective – Methodology”. International Energy Agency Annex 32, Task A, Amsterdam, Netherlands.
Hens, H. (1996). Heat, Air and Moisture Transport, Final Report, Vol. 1, Task 1: Modeling. International Energy Agency Annex 24, Laboratorium Bouwfysica, K. U.-Leuven, Belgium.
Karagiozis, A., Salonvaara, M. and Kumaran, M. K. (1996). ‘Numerical simulation of experimental freeze conditions in glass fibre insulation’. Building Physics in the Nordic
Countries, Finland, August.
Karagiozis, A. (1993). ‘Overview of the 2-D hygrothermal heat-moisture transport model LATENITE’. Internal IRC/BPL Report, IRC/NRC, National Research Council Canada, Ottawa.
Karagiozis, A. (1997). ‘Analysis of the hygrothermal behavior of residential high-rise building components’. Client report A-3052.4, IRC/NRC, National Research Council
Canada, Ottawa.
Kumaran, K., Lackey, J., Normandin, N., van Reenen, D. and Tariku, F. (2002a). “Summary report from Task 3 of MEWS project”. Institute for Research in Construction,
Kumaran M. K., Mukhopadhyaya P., Cornick S. M., Lacasse, M. A., Maref W., Rousseau M., Nofal M., Quirt J. D. and Dalgliesh W. A. (2002b). ‘A methodology to develop moisture management strategies for wood-frame walls in North America: application to stucco-clad walls’. 6th Nordic Building Physics Symposium 2002, Trondheim, Norway, pp. 651-658.
Kumaran M. K., Mukhopadhyaya P., Cornick S. M., Lacasse, M. A., Maref W., Rousseau M., Nofal M., Quirt J. D. and Dalgliesh W. A. (2003). ‘An integrated methodology to develop moisture management strategies for exterior wall systems’. 9th
Conference on Building Science and Technology, Vancouver, Canada, pp. 16.
Lacasse, M.A., O'Connor, T., Nunes, S.C., and Beaulieu, P. (2003). “Report from Task 6 of MEWS Project : Experimental Assessment of Water Penetration and Entry into Wood-Frame Wall Specimens - Final Report”, Research Report, Institute for Research in Construction, National Research Council Canada, 133, pp. 1 v. (various pagings), February 01, 2003, (IRC-RR-133), URL: http://irc.nrc-cnrc.gc.ca/fulltext/rr133/.
Maref, W., Kumaran, M. K., Lacasse, M. A. Swinton, M. C. and van Reenen, D. (2002). “Advanced hygrothermal model- hygIRC: Laboratory Measurements and Bench Marking”. 12th International Heat Transfer Conference, Grenoble, pp. 1-6.
Mukhopadhyaya, P., Goudreau, P., Kumaran, M. K. and van Reenen, D. (2002). “Influence of material properties on the hygrothermal response of an ideal stucco wall - Results from hygrothermal simulations”. 6th Nordic Building Physics Symposium 2002, Trondheim, Norway, pp. 611-618.
Mukhopadhyaya, P., Kumaran, M.K., Tariku, F., and van Reenen, D. (2003a). “Final Report from Task 7 of MEWS Project at the Institute for Research in Construction :
Long-Term Performance: Predict the Moisture Management Performance of Wall Systems as a Function of Climate, Material Properties, etc. Through Mathematical Modeling”, Research Report, Institute for Research in Construction, National Research
Council Canada, 132, pp. 384, February 01, 2003, (IRC-RR-132), URL:
http://irc.nrc-cnrc.gc.ca/fulltext/rr132/.
Mukhopadhyaya, P., Kumaran, M.K., Rousseau, M.Z., Tariku, F., van Reenen, D., and Dalgliesh, W.A. (2003b). "Application of hygrothermal analyses to optimise exterior wall design," 2nd International Conference on Research in Building Physics (Leuven, Belgium, 9/14/2003), pp. 417-426, September 01, 2003, (NRCC-46100), URL: http://irc.nrc-cnrc.gc.ca/fulltext/nrcc46100/.
Mukhopadhyaya, P. (2003c). “MEWS project produces long-term moisture response indicator”, Construction Innovation. Volume 8, No. 1, pp. 6-7.
Nofal, M., and Morris, P.I. (2003). “Criteria for unacceptable damage on wood systems," Japan-Canada Conference on Building Envelope (Vancouver, Canada, 6/4/2003), pp. 1-14, June 01, (NRCC-45140), URL: http://irc.nrc-cnrc.gc.ca/fulltext/nrcc45140/.
Rousseau, M., Bomberg, M. T. and Desmarais, G. (2002). ‘Review of Common Approaches for Exterior Moisture Management’, MEWS Task 2 final report. Institute for Research in Construction, National Research Council Canada, Ottawa.
Swinton, M.C. and Sander, D.M. (1994). “Trade-off compliance for houses: specifications for calculation procedures for demonstrating compliance to the National Energy Code for Houses”, Institute for Research in Construction, National Research
TenWolde, A. (2001). “Manual Analysis Tools. Moisture analysis and condensation control in building envelopes”, American Society for Testing and Materials, MNL40. West Conshohocken, PA, USA, pp. 107-115.
Trechsel, H. R. (editor) (2001). “Moisture analysis and condensation control in building envelopes”, American Society for Testing and Materials. MNL40. West Conshohocken, PA, USA.
Table 1. Moisture Index (MI) for five locations Location Moisture Index (MI) Wilmington, NC 1.13
Seattle 0.99
Ottawa 0.93
Winnipeg 0.86 Phoenix 0.13
Table 2. Water Vapor Permeability and Liquid Diffusivity of Stucco Materials Material Water Vapor Permeability
[kg.m-1.s-1. Pa-1] Liquid Diffusivity [m2.s-1] 50% RH 100% RH Stucco I 1.83×10⁻¹² 3.33×10⁻¹² 3.99×10-08 Stucco II 3.1×10⁻¹² 4.23×10⁻¹² 2.33×10-09
Testing Modeling Experience Estimate Long-term Performance
Wall Width (m) - Expanded W a ll H e ig h t (m ) 0.05 0.1 0.5 1 1.5 2 RH 0.9230 0.8615 0.8000 0.7384 0.6769 0.6154 0.5538 0.4923 0.4307 0.3692 0.3077 0.2461 0.1846 0.1231 0.0615
OSB layer facing stud cavity Exterior face
Region of Focus
-600 mm Bottom plate; Top layer; Half-width
4.94 mm
1.43 mm
44.5 mm
Figure 4a – Relative humidity contour plot (hygIRC-2D output) for stucco wall with water leakage
Wall Width (m) - Expanded W a ll H e ig h t (m ) 0.05 0.1 0.5 1 1.5 2 T 20.0000 17.1429 14.2857 11.4286 8.5714 5.7143 2.8571 0.0000 -2.8571 -5.7143 -8.5714 -11.4286 -14.2857 -17.1429 -20.0000
Figure 4b – Temperature contour plot (hygIRC-2D output) for stucco wall with water leakage
Ottawa - No Water Leakage 70% 75% 80% 85% 90% 95% 100% 0 100 200 300 400 500 600 700 800 Time (days) R e la tiv e H u m id ity -25 -20 -15 -10 -5 0 5 10 15 20 25 T emp er a tu re ( °C ) RH T
Figure 5 – RH and T variation with time at the region of focus for stucco wall with no water leakage (‘region of focus’ - ‘OSB layer facing stud cavity’)
Ottawa - Water Leakage 70% 75% 80% 85% 90% 95% 100% 0 100 200 300 400 500 600 700 800 Time (days) Re la ti v e Hu m id it y -25 -20 -15 -10 -5 0 5 10 15 20 25 Tem p er at ur e ( °C ) RH T
Figure 6 – RH and T variation with time at the region of focus for stucco wall with water leakage (‘region of focus’ - ‘OSB layer facing stud cavity’)
Figure 7 – Moisture response due to different moisture loads at various geographic locations for stucco wall with water leakage (‘region of focus’ - ‘OSB layer facing stud
0 500 1000 1500 2000 2500 0 0.2 0.4 0.6 0.8 1 1.2
Moisture index (MI)
R H T I n de x Phoenix Winnipeg Ottawa Seattle Wilmington
I
II
Figure 8 – Selection of stucco materials I and II for stucco wall with water leakage (‘region of focus’ - ‘OSB layer facing stud cavity’)
Liquid Water Liquid ater (a) (b) (c)
0 500 1000 1500 2000 2500 3000 0 0.2 0.4 0.6 0.8 1 1.2
Moisture index (MI)
RHT In d e x Phoenix Winnipeg Ottawa Seattle Wilmington
I
I
Figure 10 – Selection of sheathing board materials I and II for brick wall with water leakage (‘region of focus’ - ‘Top of the bottom plate’)