HAL Id: hal-01594937
https://hal.archives-ouvertes.fr/hal-01594937
Submitted on 25 May 2020HAL is a multi-disciplinary open access
archive for the deposit and dissemination of sci-entific research documents, whether they are pub-lished or not. The documents may come from teaching and research institutions in France or abroad, or from public or private research centers.
L’archive ouverte pluridisciplinaire HAL, est destinée au dépôt et à la diffusion de documents scientifiques de niveau recherche, publiés ou non, émanant des établissements d’enseignement et de recherche français ou étrangers, des laboratoires publics ou privés.
Domestication rewired gene expression and nucleotide
diversity patterns in tomato
Christopher Sauvage, Andrea Rau, Charlotte Aichholz, Joel Chadoeuf,
Gautier Sarah, Manuel Ruiz, Sylvain Santoni, Mathilde Causse, Jacques
David, Sylvain Glémin
To cite this version:
Christopher Sauvage, Andrea Rau, Charlotte Aichholz, Joel Chadoeuf, Gautier Sarah, et al.. Domes-tication rewired gene expression and nucleotide diversity patterns in tomato. Plant Journal, Wiley, 2017, 91 (4), pp.631-645. �10.1111/tpj.13592�. �hal-01594937�
Version postprint
Accepted
Article
This article has been accepted for publication and undergone full peer review but has not
been through the copyediting, typesetting, pagination and proofreading process, which may
lead to differences between this version and the Version of Record. Please cite this article as
Article type : Original Article
Domestication rewired gene expression and nucleotide diversity patterns in tomato
Christopher Sauvage – INRA, UR1052, Génétique et Amélioration des Fruits et
Légumes (GAFL) Domaine St Maurice – 67 Allée des Chênes - CS 60094, 84143 Montfavet Cedex, France
Andrea Rau – GABI, INRA, AgroParisTech, Université Paris-Saclay, 78350 Jouy-en-Josas, France
Charlotte Aichholz – INRA, UR1052, Génétique et Amélioration des Fruits et Légumes (GAFL) Domaine St Maurice – 67 Allée des Chênes - CS 60094 F-84143 Montfavet Cedex, France
Current Address : Sativa Seeds Sativa Rheinau AG Klosterplatz CH-8462 Rheinau Switzerland.
Joël Chadoeuf – INRA, UR1052, Génétique et Amélioration des Fruits et Légumes (GAFL) Domaine St Maurice – 67 Allée des Chênes - CS 60094 F-84143 Montfavet Cedex, France
Gautier Sarah – CIRAD, UMR AGAP, Baillarguet, F- 34980 Montferrier-sur-Lez, France
Version postprint
Accepted
Article
Sylvain Santoni – Montpellier SupAgro, UMR 1334, Amélioration Génétique et Adaptation des Plantes Méditerranéennes et Tropicales, F-34398 Montpellier, France
Mathilde Causse – INRA, UR1052, Génétique et Amélioration des Fruits et
Légumes (GAFL) Domaine St Maurice – 67 Allée des Chênes - CS 60094, 84143 Montfavet Cedex, France
Jacques David – Montpellier SupAgro, UMR 1334, Amélioration Génétique et Adaptation des Plantes Méditerranéennes et Tropicales, F-34398 Montpellier, France
Sylvain Glémin – Institut des Sciences de l’Evolution de Montpellier, ISEM— M niversit de Montpellier- CNRS-IRD-EPHE), F-34095 Montpellier, France - Department of Ecology and Genetics, Evolutionary Biology Center and Science for Life Laboratory,
Uppsala University, 75236 Uppsala, Sweden
Correspondance :
Sauvage Christopher
[email protected] INRA Centre de recherche PACA 67 allée des chênes
CS 60094
84140 MONTFAVET Cedex Tél : +33 (0)4 32 72 27 54 Fax +33 (0)4 32 72 27 02
Version postprint
Accepted
Article
Key words: Domestication, gene co-expression, comparative genomics, selective sweep,
tomato
Abstract
Plant domestication has led to considerable phenotypic modifications from wild species to modern varieties. However, although changes in key traits have been well documented, less is known about the underlying molecular mechanisms, such as the reduction of molecular diversity or global gene co-expression patterns. In this study, we used a combination of gene expression and population genetics in wild and crop tomato to decipher the footprints of domestication. We found a set of 1,729 differentially expressed genes (DEG) between the two genetic groups, belonging to 17 clusters of co-expressed DEG, suggesting that domestication affected not only individual genes but also regulatory networks. Five co-expression clusters were enriched in functional terms involving carbohydrate metabolism or epigenetic regulation of gene expression. We detected differences in nucleotide diversity between the crop and wild groups specific to DEG. Our study provides an extensive profiling of the rewiring of gene co-expression induced by the domestication syndrome in one of the main crop species.
Introduction
Although the study of domestication processes was once largely the domain of archaeologists and agricultural scientists, it is now the focus of transdisciplinary research combining physical, biological and social sciences (Zeder, 2015). During the domestication process, humans modified wild species through breeding to improve a large variety of heritable traits. Plant domestication targeted advantageous traits for humans and thus became early domesticates. In the early 1930’s, selective breeding turned these into modern varieties to sustain agricultural productivity. The most common improved targeted
Version postprint
Accepted
Article
phenotypes are notably seed dispersal and dormancy (Zohary & Hopf, 2000), flowering time (Cockram et al., 2007), plant architecture (Clark et al., 2004), and fruit and seed sizes (Frary
et al., 2000).
Using quantitative trait locus (QTL) analyses, numerous domestication loci have been characterized in major crops, including tb1 in maize (Doebley et al., 1995; Studer et al., 2011), Q in wheat (Simons et al., 2006) and fw2.2 in tomato (Frary et al., 2000), responsible for plant branching, free-threshing and fruit weight, respectively. At the genome-wide scale, the reduction of nucleotide diversity has been investigated in crops such as maize (Wright et
al., 2005), rices (Caicedo et al., 2007; Nabholz et al., 2014), soybean (Li et al., 2010) and
tomato (Koenig et al., 2013). Genome scan approaches have also helped pinpoint genes that were potentially positively selected during the domestication process (Wright et al., 2005).
The consequences of domestication provide a unique opportunity to analyse evolutionary forces acting at the genomic as well as transcriptomic levels. Major domestication traits are the result of gene expression rewiring, for example in cotton (Rapp
et al., 2010) or maize (Hufford et al., 2012), but the global molecular consequences of
domestication on the patterns of gene expression and their co-expression remain largely unknown. In particular, RNA-seq data have rarely been used to investigate the extent to which co-expression patterns are affected by factors such as domestication, especially when grouping biological features (i.e., genes) rather than biological samples. Through a comparative genomic approach, Bellucci et al. (2014) addressed this question in the common bean (Phaseolus vulgaris) by studying both the pattern of nucleotide and gene co-expression shifts between one crop and one wild population. Briefly, they demonstrated that domestication reduced the nucleotide diversity and, to a lesser extent, gene expression at the genome-wide scale but also altered co-expression networks, with both populations showing distinct community structures enriched for genes involved in many phenotypes.
Version postprint
Accepted
Article
Using the autogamous cultivated tomato (Solanum lycopersicum, SL and S.
lycopersicum var cerasiforme, SLC) and its closest wild relative, Solanum pimpinellifolium
(SP, Rick & Fobes, 1975), we conducted a comparative transcriptomic approach to study alterations of genome-wide nucleotide diversity and gene expression and co-expression potentially due to domestication. Phenotypic evidence of the domestication syndrome has been largely documented, notably the typical 100-fold increase in fruit weight between the wild and crop forms (Frary et al., 2000; Liu et al., 2002; Xiao et al., 2008; The Tomato Genome Consortium, 2012; Chakrabarti et al., 2013). However, for the latter species, little is known about the alteration of genome-wide expression profiles induced by domestication. One recent exception is a study from Koenig et al. (Koenig et al., 2013), which focused on the alteration of co-expression network topologies at the genome-wide scale. Although conducted across 6 species of tomato, the aforementioned study was limited to one accession per species and thus cannot provide information on the magnitude of intra-species nucleotide diversity and gene expression variability, nor on the link between co-expression profiles and phenotypic data.
In this context, we used RNA-seq based polymorphism and expression data to (1) identify differentially expressed genes (DEG) associated with an enrichment in biological functions; (2) investigate whether co-expression patterns were altered in both groups using an innovative statistical approach based on a Poisson mixture model; (3) quantify the loss of genetic diversity and global change in gene expression associated with domestication; and (4) compare the genomic and transcriptomic signatures of domestication to provide an overall biological interpretation of the consequences of domestication.
Version postprint
Accepted
Article
Results
RNA sequencing data mapping, SNP calling and read count estimation
To study the transcriptional differences between crop and wild tomato, we used two groups of 9 accessions each. From these 18 accessions, RNA of pooled tissues was sequenced and mapped on the tomato reference genome (v2.4) to provide raw read counts as a proxy for gene expression levels and identify polymorphic sites. For the 18 tomato accessions, the minimal, maximal and average amount of raw sequencing data obtained were 1.071×10⁹bp (Crop7), 5.046×10⁹bp (Wild6) and 2.537×10⁹bp, respectively (Supplementary Table 1). On average, data cleaning removed 1.81% of the data, ranging from 0.67% (Wild9) to 2.98% (Crop8) of the data. Then, 65.9 % to 76.9% of the cleaned data were successfully mapped to the tomato reference CDS set. No significant difference (p>0.05) was observed in the percentage of mapped reads onto the reference genome (S. lycopersicum cv. Heinz 1706) between crop and wild accessions. The average coverage per position per individual was estimated to be 53.2×, ranging from 23.4× to 94.8×. The SNP calling identified 143,097 polymorphic sites. From these polymorphic sites, 41.2% were removed after applying filters (Material and Methods). Then, a final set of 84,155 polymorphic sites, identified in 12,168 CDS (representing 35% of all known CDS), was retained for subsequent nucleotide diversity analyses. These 12,168 CDS represent 15.1% (109.9Mb/728Mb) of the sequenced fraction of the reference tomato genome.
Population genetic analyses
To get insight into the demographic history of the tomato domestication, we ran population genetic analyses to (1) characterize population structure and (2) get estimates of silent and non-synonymous nucleotide diversity and Tajima’s D statistic across the genome. Out of the 84,155 detected polymorphic sites, a genomic position was assigned to 83,809 loci (99.5%) onto the twelve tomato chromosomes. The remaining 0.5% of the loci (346) was assigned to the virtual chromosome 0. A visual inspection of the first two components of a principal
Version postprint
Accepted
Article
components analysis (PCA) on polymorphism data indicates a clear separation between the crop and wild groups; these two components explained 32.2% and 9.6% of the genetic variance, respectively (Figure 1a). The inference of population ancestry revealed two populations (K=2), respectively composed of the 9 wild and the 9 crop individuals. However, a substructure distinguishing 3 ancestral populations can be observed when setting K=3 (see Supplementary Figure 1).
At the intra-species level, the genome-wide πCrop/πWild ratio was estimated to be
0.642. More precisely, the average synonymous (πS) and non-synonymous (πN)
polymorphism rates were estimated to be 8.60×10⁻⁴ and 2.17×10⁻⁴ in the crop group, and 1.53×10⁻³ and 3.6×10⁻⁴ in the wild group, respectively. The profiles of πS and πN varied
across the genome, identifying regions with higher nucleotide diversity in the crop group compared to the wild group, especially on chromosomes 9 and 11. At the genome-wide scale, the average Tajima’s D was estimated to be -0.573 (± 0.930) and -0.294 (± 0.937) in the crop and wild groups, respectively. Figures 2a, 2b and 2c provide a graphical representation of these πN, πS and Tajima’s D genomic patterns for both groups (population
genetics statistics are provided in Supplementary Table 2).
Identification of DEG between wild and crop, enrichment analysis and gene expression variability
Domestication may have rewired gene expression levels and variability for specific molecular functions. To identify the targets of this rewiring, we identified DEG between the crop and wild tomato groups. Following this, we identified over-represented molecular functions within the set of DEG with a gene ontology enrichment test. Non-zero total read counts (RC) were obtained for 34,010 CDS (97.9%) of the known CDS in tomato. After filtering to remove genes with total RC less than 5000 across all 18 samples, gene expression data were composed of 12,270 genes. Subsequent analyses were performed on this dataset (normalized read counts are provided in Supplementary Table 3). A PCA
Version postprint
Accepted
Article
analysis of the 18 individuals based on the transformed normalized gene expression levels revealed two distinct groups, respectively composed of the 9 crop accessions and the 9 wild accessions (Supplementary Figure 2). The first (PC1) and second (PC2) principal components explained 36% and 20% of the total variance, respectively (Figure 1b). For the gene expression data (n=12,270), we examined the biological coefficient of variation (BCV), computed as the square root of the mean gene expression dispersion (a proxy of the gene expression variance) in both crop and wild and estimated these BCV to 0.31 and to 0.23 in each group respectively. After correction for multiple testing (adjusted p-value < 0.01), a differential analysis revealed 1,729 DEG with a moderated log2 fold change (LFC) ranging
from -1.9 to 3.3 (Supplemental Table 4). Among these 1,729 DEG, 863 (49.7%) were up-regulated in crop accessions, while 866 (50.3%) were up-up-regulated in wild accessions. For the set of DEG genes, the BCV were estimated to 0.32 and 0.27 in the crop and wild group, respectively. We also compared the PCA coordinates of the individuals obtained from the polymorphism data (X-axis) and the expression levels of the DEG (Y-axis). As previously stated, in both cases, the graphical representation distinguished between the two separate groups (Figures 1a and 1b). The scatter diagram of the paired coordinates representing the individuals in the polymorphism and DEG expression levels similarly indicated a clear separation of crop vs wild, but not a large re-ranking of the individuals between the two axes.
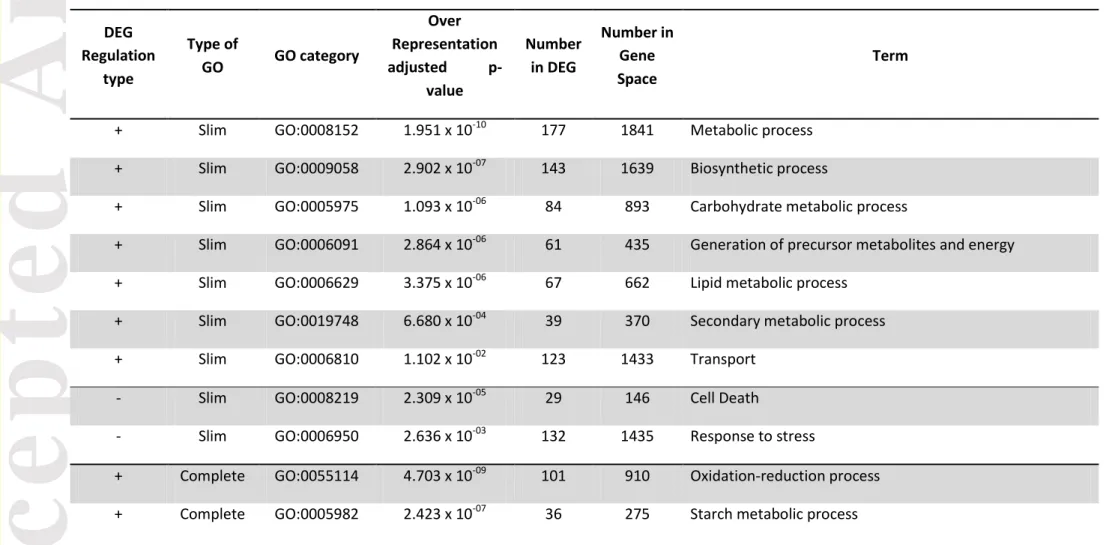
An enrichment test revealed several significantly over-represented gene ontologies. The gene space was composed of 24,970 annotated genes (71.9% of the known CDS) while the test set was composed of 1,515 annotated genes (87.6% of the 1,729 DEG). Among the 863 DEG up-regulated in crop vs wild, a total of 7 GO were found to be over-represented, notably linked to the oxidation-reduction, L-ascorbic acid metabolic, sucrose processes or linked to the cell wall biogenesis, the fatty acid biosynthetic and diterpenoid biosynthetic processes (Table 1). Within the 866 DEG down-regulated in crop vs wild, 2 GO terms were over-represented. These terms were linked to cell death and the response to stress. The complete list of over-represented GO terms associated with up- and down-regulated DEG is
Version postprint
Accepted
Article
provided in Table 1. Note that in the data published by Koenig (2013), 1938 DEG were identified between S. lycopersicum and S. pimpinellifolium, of which 242 DEG (12.5% of the 1938 DEG) were found in common with our study.
A differential variability analysis revealed seven genes that are differentially variable between crop and wild groups (adjusted p-values < 0.05). Among these genes, a single gene (Solyc07g061750, Figure 3) has a larger variability in wild as compared to crop, while the remaining six have larger variability in crop versus wild. Figure 3 provides the representation of the log-normalized counts (Log2CPM) corresponding to these seven
differentially variable genes. It is interesting to note that, of these seven differentially variable genes, four were not detected by the differential expression analysis. The functional annotation of these seven genes curated from the literature revealed that they are primarily involved in plant immunity, flowering, fruit development, and ripening, while one of these seven genes remains poorly annotated.
Clustering of the DEG genes and associated enriched gene ontologies
Alteration of co-expression patterns of DEG may have occurred during domestication, especially for specific biological processes. To identify such alterations, we built co-expression clusters of DEG using an innovative statistical approach and associated over-represented gene ontologies to these clusters. The 1,729 DEG were clustered into groups of co-expressed genes using the HTSCluster approach (Rau et al., 2015). Using the data-driven slope estimation (DDSE) calibration of the slope heuristics for model selection, K=23 clusters were identified among the 1,729 DEG. However, because the model with K=17 clusters was found to yield a substantially similar clustering result to the model with K=23 clusters (estimated adjusted Rand Index equal to 0.893) while being more parsimonious, it was instead retained for subsequent analyses. For this model, the distribution of maximum conditional probabilities was characterized by a substantial mass of values close to 1 (Supplementary Figure 2), with a maximum conditional probability > 0.95 assigned to 97.9%
Version postprint
Accepted
Article
of the DEG (1,694/1,729). The per-cluster log10(normalized read counts+1) of each of the 18
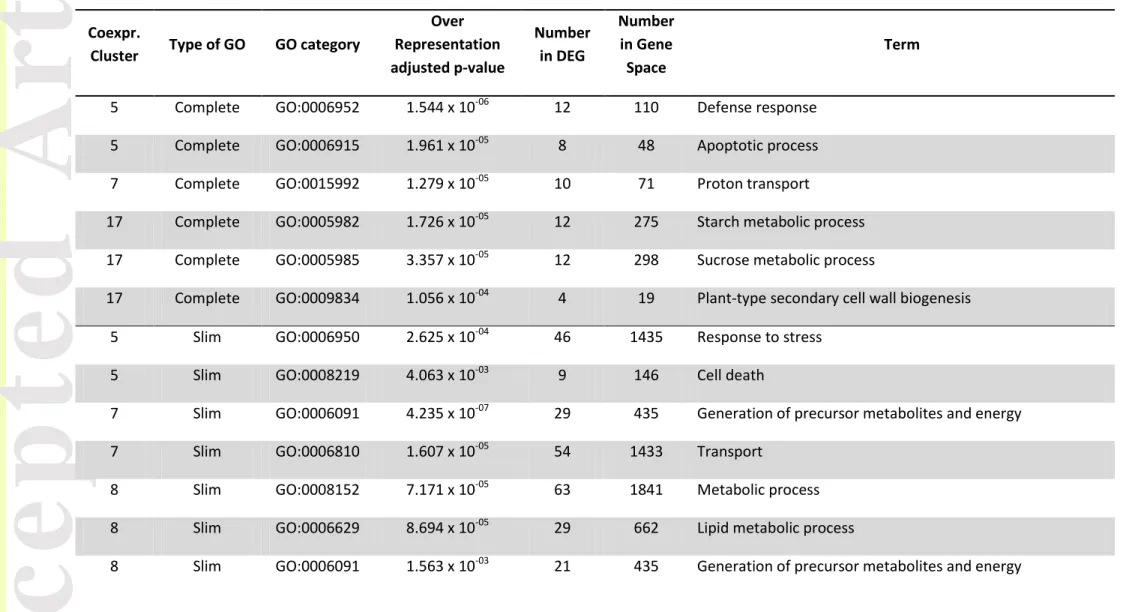
accessions are shown in Figure 4. In addition, we performed a GO enrichment analysis in each of the co-expression clusters that contained more DEG than the number of accessions {K=1, 2, 5, 7, 8, 10, 11, 17}. This analysis revealed that 5 clusters were significantly enriched in biological process (BP) terms, notably related to the response to stress (K=5), the generation of precursor metabolites and energy (K=7), metabolic process (K=8), the epigenetic regulation of gene expression (K=11), and carbohydrate metabolism (K=17). The complete list of enriched GO terms (both slim and complete terms) is provided in Table 2.
Identification of genes potentially selected during the domestication process
During domestication, the rapid fixation of haplotypes carrying favourable polymorphisms may occur and print the genome. To identify these footprints, we identified ortholog genes from an outgroup species to determine the derived/ancestral state of the SNP data and compare the homozygosity along the genome between the crop and the wild group. Differences in haplotype sizes are a clue for selective sweeps. The best BLAST mutual hit (BBMH) approach identified a set of 9408 orthologous genes (at a threshold of 1×10-90) between the tomato and the outgroup species, the eggplant transcriptome (Solanum
melongena, assembled according to (Sarah et al., 2016)). We searched for selective sweeps
by analysing the genome-wide Rsb index at each polymorphic site within the 9378 tomato-eggplant orthologs. This index is defined as the ratio (crop over wild) of the integrated EHH (Extended Haplotype Homozigosity) profiles in both groups. Figures 2d and 2e represent the genome-wide Rsb and its associated log10(p-values) computed assuming a Gaussian
distribution of the integrated haplotype score (iHS) values in both groups. Thus, a strongly negative Rsb corresponds to a derived allele that has increased in frequency (selective sweep). However, a selective sweep can also produce highly positive Rsb values at neighbouring SNPs if the ancestral allele hitchhiked with the allele under selection at the
Version postprint
Accepted
Article
focal SNP. At p-values less than 0.01, we identified a set of 153 potentially selected genes grouped in a total of 27 sweep regions (of two or more genes). From this set of genes, the GO enrichment analysis was conducted on 139 genes (90.8%) and did not reveal any enriched gene ontology term.
Comparison between genomic and expression footprints
We investigated whether the nucleotide diversity (πS orπN) of the DEG included in the
co-expression clusters was affected during the domestication process. Using three ANOVA models, we tested 1) the effect of differential status (DEG versus non-DEG) on ; 2)
the effect of differential status on
; and 3) the effect of differential status and group
(crop versus wild) on . Based on these models, we found that both synonymous and
non-synonymous polymorphism rates tended to be larger in the wild group than the crop group, and this trend was significantly more pronounced for DEG than for non-DEG (p-value = 2.44× 10⁻⁵ and p-value = 8.65 × 10⁻⁵ in models 1 and 2, respectively – Figure 5). Similarly, when considering the ratio , which provides an idea of the efficiency of purifying
selection, we found that DEG had significantly smaller values as compared to non-DEG (p-value = 1.10 × 10⁻⁷ ; model 3) as did the wild group as compared to crop (p-value = 2.20 × 10⁻¹⁶; model 3), although their interaction was not significant. This suggests that purifying selection tended to be stronger among DEG as well as in the wild group. Finally, from the set of 153 genes within the selective sweeps and the set of 1729 DEG, 23 genes were found to be in common (15.03% of the 153 genes), with 10 regulated in crop and 13 up-regulated in wild. These 23 candidate genes mostly belong to co-expression clusters {5,7,8,11} with 5, 4, 3 and 7 candidate genes, respectively.
Version postprint
Accepted
Article
Discussion
Global changes in gene expression levels and co-expression patterns are associated with shift in nucleotide diversity between wild and crop groups
Understanding the domestication process is a key to crop breeding but also a unique opportunity to study rapid evolutionary processes on a short time scale that occurred at the phenotypic and molecular levels. For instance, the number of genes that are involved in domestication and artificial selection, as well as their identification, is still unsolved for many crops. Changes in regulation of gene expression likely play a key role but remain poorly understood. Methodological developments such as the clustering of co-expressed genes offer new opportunities to dissect the regulatory changes induced by this process.
In addition to the loss of diversity (-34%) induced by the domestication process we also found major shifts in individual gene expression levels but also in co-expression patterns. Recent studies in maize (Swanson-Wagner et al., 2012), tomato (Koenig et al., 2013) and the common bean (Bellucci et al., 2014) have also found major changes in the regulation of gene expression consistent with the hypothesis that regulatory differences are fundamental to the evolution of morphological and developmental diversity (Carroll, 2008). As in the common bean, where a drastic reduction in nucleotide diversity (-60%) was associated with a reduction in the diversity of gene expression levels (-26%), we found a modification in the biological coefficient of variation (BCV) of gene expression of 25% between the crop and the wild group. This means that, the gene expression values for all the expressed genes varied up and down by 31% and by 23% and by 32% and 27%, in the set of DEG in the crop and wild groups, respectively. More importantly, this means that domestication may have favoured gene expression variance. Changes in gene expression have been already found in tomato, where thousands of shifts in gene expression levels related to environmental response and stress tolerance were identified (Koenig et al., 2013). Compared to Koenig et al. (2013), we identified a similar number of DEG between crop and
Version postprint
Accepted
Article
wild accessions (1,729 DEG vs 1,938 DEG for the S. lycopersicum vs S. pimpinellifolium comparison, at the 5% significance threshold) in spite of a different sampling strategy, while only 242 DEG were common to both studies. The study by Koenig et al. was based on the analysis of six different tissues, while in our case pools of three tissues were sequenced.
Co-expression analysis is a powerful approach to investigate the concerted action of genes, infer gene functions, and provide novel insights into the understanding of cellular processes. In our study, 17 co-expression clusters were identified, of which 14 were composed of DEG characterized by a lower average level of expression in crop vs wild (Figure 4); in related work in the common bean (Bellucci et al., 2014), such an alteration of entire networks was observed by studying the proximity network of gene co-expression in two populations. This study in common bean demonstrated that the intersection of the networks built in each population shared only a few edges, indicating weak similarity in networks between groups.
A severe reduction in nucleotide diversity is typically associated with the domestication syndrome. This reduction has been characterized at the locus level (e.g., candidate genes) and revisited at the genome-wide level in numerous crops such as maize (Hufford et al. 2012), rice (Huang et al., 2012), soybean (Zhou et al., 2015), common bean (Schmutz et al., 2014) and cucumber (Qi et al., 2013). The severity of this reduction was substantially variable, with a range of loss estimated from 17% to 49% of the nucleotide diversity of the wild compartment in maize and cucumber, respectively. In the present study, the multi-locus estimates of silent nucleotide diversity are low, with πS,CROP and πS,WILD estimated at
9.948×10⁻⁴ and 1.528×10⁻³, respectively, supporting a reduction of nucleotide diversity of nearly 34% (
= 0.651). However, this result must be cautiously interpreted, as this
reduction may be underestimated compared to previous results (Roselius et al., 2005; The Tomato Genome Consortium, 2012). Here, our strategy relies only on protein-coding regions of the genome (RNA-seq data), which are known to be under stabilizing or negative
Version postprint
Accepted
Article
selection compared to 5’-UTR or other non-coding regions of the genome (Bustamante et
al., 2005); this would affect πN as it reflects selection effects, but notπS as it reflects the
demography of the populations.
Evidences of selective sweep (corresponding to the rapid fixation of one or several haplotypes carrying favourable polymorphism) have been observed in various crop species including maize, rice at the tb1 (Wang et al., 1999; Clark et al., 2004) and the waxy (Olsen et
al., 2006) loci, respectively. In tomato, domestication sweeps were related to fruit size (Cong et al., 2002; Paran & van der Knaap, 2007). In the high-throughput genomic era, Lin et al.
(Lin et al., 2014) argued that the domestication processes resulted in the fixation of a large proportion of the tomato genome, corresponding to nearly 200Mb (25.6% of the assembled genome). Here, two underlying processes are at play. The domestication and improvement sweeps and linkage drags associated with introgression jointly limit further improvement via conventional breeding. As expected, and despite a reduced number of accessions per group, we revealed severe selective sweeps that reflect the strength of selected experienced through domestication and breeding.
To compare genomic and expression footprints, we built a scatter diagram for the paired coordinates of PCA on both polymorphism and DEG expression data for each of the accessions (Figure 1c). This diagram is characterized by much longer arrows in the crop group compared to the wild group, suggesting gene expression levels were more highly perturbed in the former than the latter, as demonstrated notably by the greater overall under-expression of DEG in this group.
Significant differences in were identified between the genetic groups and between
DEG and non-DEG. More precisely, we observed a significantly smaller ratio not only in
the wild group compared to crop, but also among DEG compared to non-DEG. This suggests that selective pressures occurred that affected DEG during domestication.
Version postprint
Accepted
Article
However, no interaction among differential status and group was observed, suggesting that the effect of these selective pressures on DEG was similar in both the wild and crop groups.
It can be argued that traits of interest in tomato were improved from the tweaking of gene expression regulation rather than the maintenance of nucleotide diversity as a source of adaptation and novelty. Finally, a set of 23 candidate genes was found to be common to the DEG and the sweep regions. Outside of chromosomes 9 and 12, this reduced set of candidate genes was spread across the genome, meaning that they did not tend to cluster around a particular locus.
What is the functional interpretation of the candidate genes revealed by their expression levels and co-expression patterns?
By exploring the variability in gene expression levels, seven genes were identified using the DiffVar approach, suggesting that the domestication of tomato both altered and rewired gene expression levels through an increase or decrease in variability. Thus, this rewiring may be associated with phenotypes more adapted to human needs and preferences in tomato as it moves towards its diversification. The large spectrum of fruit shape of tomato is an example of this diversification (Rodriguez et al., 2011). Interestingly, four out of the seven differentially variable (DV) genes were not detected as DEG. Such a limited overlap between DV and DEG sets was previously reported and can in part be interpreted as being due to a small available sample size (N<20 per group) (Ho et al., 2008). Thus, the detection power for DV genes is correlated to the number of available replicates, meaning that future larger experimental designs will tend to yield a larger number of detected DV genes.
These seven DV genes are involved in flowering (Solyc00g009120.2.1; MacAlister et al., 2012), immunity (Solyc04g078290.2.1, (Pombo et al., 2014)), ripening (Solyc07g066630.2.1, (Zhong et al., 2013); Solyc07g032080.2.1 and Solyc07g061750.2.1, (Park et al., 2014), fruit development (Solyc09g009830.2.1, (Karlova et al., 2013)), while Solyc08g082980.2.1 is described as a potential serine/threonine protein kinase WNK4 like
Version postprint
Accepted
Article
(http://bioinfo.bti.cornell.edu/cgi-bin/itak/db_gene_seq.cgi?trans_ID=Solyc08g082980.2.1). Briefly, in plants, serine/threonine protein kinase WNK4 like genes may regulate flowering time by modulating the photoperiod pathway (http://www.uniprot.org/uniprot/Q9LVL5). Interestingly, the only gene (Solyc07g061750) showing a higher expression variability in wild compared to crop is described as an Ankyrin like protein (GO:0005515 – protein binding), that is part of the superfamily of the ankyrin protein (130 genes identified in the tomato, (Yuan et al., 2013)) that is crucial for growth and development but also for plant response to biotic and abiotic stresses. Thus, in this latter case, we hypothesize that such a reduction of expression variability in crop has been induced by directional selection for a reduction in cis-regulatory variation, supporting previous observations in maize (Hufford et al., 2012; Lemmon et al., 2014).
The GO term enrichment analysis revealed that over-expressed and under-expressed DEG in crop vs wild were enriched in 7 and 2 Slim GO terms, respectively. Among the set of 7 GO in the former case, the underlying molecular functions are mainly associated with carbohydrate, lipid, metabolic and biosynthetic processes while the complete GO terms were associated with oxidation-reduction, starch metabolic, L-ascorbic acid, sucrose, fatty acid biosynthesis and diterpenoid biosynthesis processes (Table 2 for more details).
When examining the ascorbate biological pathway, the oxidation-reduction process may be associated with the L-ascorbic acid (also known as Vitamin C), starch and sucrose (carbohydrate complete GO Term) biosynthetic processes. Indeed, L-ascorbic acid and starch are anti-correlated traits (Baxter et al., 2005), as starch is a major contributor to the soluble solids content (SSC) of mature fruits, while sugars are the precursor of the L-ascorbic acid pathway. This latter acid plays a major protective role against Reactive Oxygen Species. Failure in this role may lead to cell death, which is one of the over-represented Slim GO terms in the present study and associated with under-expression in crop vs wild groups. Many previous studies investigated the synthesis and content of L-ascorbic acid at the molecular level in the tomato through linkage mapping or GWA (Stevens
Version postprint
Accepted
Article
et al., 2007; Sauvage et al., 2014), revealing its polygenic genetic architecture. Major
change in L-ascorbic content was induced by domestication, leading to low content in the crop compared to its wild counterpart and thus reducing the plant’s adaptation potential to stressful environments (Gest et al., 2013), but also reducing the benefit for human health.
The over-representation of DEG genes involved in the diterpenoid biosynthetic process revealed that domestication affected specialized metabolism like the diterpenoid biosynthesis. Indeed, Matsuba et al. (Matsuba et al., 2013) demonstrated that a functional cluster on chromosome 8 containing five Terpene synthases (TPSs) shared the same organization in the crop (S. Lycopersicum) and the wild (S. pimpinellifolium) groups, but differed in biochemical and tissue specific expression. Thus we provide evidence that domestication altered specialized metabolism such as the Terpene volatiles, as recently demonstrated in (Tieman et al., 2017) or the anti-nutritional Alkaloids (Itkin et al., 2013).
On the other hand, the under-expressed genes in crop vs wild are involved in biological processes related to basal functions, such as response to stress and cell death. We can argue that, in a controlled growing environment, selective pressures were relaxed on these under-expressed DEG genes in crop vs wild. Furthermore, the bottleneck that affected these genes may have induced a similar relaxation of the selective pressure, as illustrated by the differences of the
ratio in the DEG and the non-DEG sets. Globally, we observed that the
molecular estimates of nucleotide diversity and the associated functional annotation corroborate the fact that domestication selected trade-offs between traits associated with sugar and ascorbate metabolism and traits related to the response to stress.
Within the 17 co-expression clusters identified, up to 14 GO terms were over-represented in clusters {5,7,8,11,17}. This indicates that domestication globally lowered the gene expression levels of hundreds of genes, acting on entire gene networks, notably related to plant defense and cell death (as previously described), lipid and carbohydrate metabolisms, and more interestingly to the epigenetic regulation of gene expression (see Table 3).
Version postprint
Accepted
Article
Epigenetic effects notably regulate gene expression through repression (Wolffe & Matzke, 1999), making epialleles contributors to phenotypic diversity in plants, as demonstrated in
Arabidopsis EpiRils populations (Kooke et al., 2015). In tomato, it has been demonstrated
that epigenetic effects trigger fruit ripening (Manning et al., 2006; Zhong et al., 2013). Thus our results support the fact that key phenotypes such as flowering, productivity (Latzel et al., 2013) or fruit shape, may have been finely tuned by epigenetically modulating of gene expression through modification of DNA methylation. This in turn may have led to participate to morphological variation that can be observed in tomato for these key phenotypes.
Three major modules of highly co-expressed genes were identified in Koenig et al. (2013) using a slightly different approach based on the comparison of co-expression networks built in S. lycopersicum and S. pennellii, one of its wild green-fruited relatives. In their study, only 3 co-expression clusters were identified (in comparison to 17 in our current study). The largest module (composed of 852 DEG) was enriched for GO terms related to photosynthesis, carbon metabolism, and response to light, while the second and third modules, composed of 272 genes and 144 DEG, were enriched in GO terms related to root tissues and in cell division, respectively. These observations are not fully consistent with the over-represented GO terms associated with the co-expression clusters identified in the present study. However, the sampling schemes and analytical and clustering approaches are quite different, explaining the poor overlap between both studies in terms of biological interpretation.
From the set of 153 candidate genes under selection, we also conducted a GO term enrichment analysis by refining our analysis to the most significant Rsb values. Thus these candidate genes partly overlapped the domestication and improvement selective sweep detected in Lin et al. (2014), especially on chromosomes 2, 6 and 9. However, the GO term enrichment analysis did not reveal any over-represented biological processes for these candidate genes, strongly limiting our interpretation of this result. In addition, the GO term
Version postprint
Accepted
Article
enrichment analysis conducted on the set of 23 genes overlapping the diversity and expression footprints did not reveal any over-represented biological processes.
In conclusion, this work showed that the effects of domestication are genome-wide and have affected both primary and specialized biological functions, through the rewiring of gene co-expressions levels. This rewiring is associated to a reduction of nucleotide diversity partially originating from the fixation of useful mutations. Thus we highlight the crucial role of crop wild relative to support further breeding strategies and avoid the reduction of adaptive potential in crop species.
Material and Methods
Biological samples and RNA sequencing
A set of 18 tomato accessions was chosen to represent a broad spectrum of nucleotide diversity in the crop tomato (Solanum lycopersicum – SL and S.l. cerasiforme - SLC) and its closest wild relative (S. pimpinellifolium – SP). Details regarding these 18 accessions are reported in Supplementary Table 1. The 18 accessions were grown in triplicate in a greenhouse in 2012. Leaf, flower (40 days post-anthesis) and fruit (red ripening stage) tissues were sampled. RNA was extracted using the DNAeasy plant QIAGEN kit according to the manufacturer’s protocol. The RNA extraction was conducted for all tomato accessions as follows. For each tissue sample of each accession, RNA integrity and quality were checked on Nanodrop N1000 and on an Agilent Bioanalyser. Then, RNA of each tissue was pooled in a 65/20/15 proportion (inflorescence, fruit, and leaves, respectively) constitute the sample related to one accession, representing a total quantity of 2 μg. These 18 RNA-seq libraries were prepared to obtain tagged (6bp) and paired-end 101bp sequences, following the Illumina TrueSeq protocol and recommendations. Libraries were then sequenced using the HiSeq 2000 Illumina sequencing system. Raw reads are hosted online on the Southgreen platform (http://arcad-bioinformatics.southgreen.fr).
Version postprint
Accepted
Article
Bioinformatic analysis workflow
The complete bioinformatic workflow is available on GitHub (https://github.com/SouthGreenPlatform/arcad-hts). Briefly, data quality checking and
trimming was conducted using FastQC (0.10.2,
http://www.bioinformatics.babraham.ac.uk/projects/fastqc) and CutAdapt (v1.8.5, (Martin, 2011)), while BWA (v0.7.3, (Li & Durbin, 2009) was used to process the mapping step onto the tomato reference CDS set (build v2.4). A fixed Anova model (value~group) tested any difference in read mappings between the crop and the wild accessions. Then, the variant calling tool GATK (Unified Genotyper – (McKenna et al., 2010)) performed base quality score recalibration, indel realignment, duplicate removal according to GATK Best Practices recommendations (Van der Auwera et al., 2002; DePristo et al., 2011). The VCFtools (v0.1.10, (Danecek et al., 2011)) filtered the output variant calling file (vcf) to retain sites showing a minimal coverage of 8x per individual and a MAF of 0.05. Finally the raw read count estimation was obtained using the samtools idxstats option (v0.1.19, (Li et al., 2009)).
Differential expression and variability analyses between the cultivated and wild groups
The table of raw mapped read counts (RC) per accession (9 replicates each for the crop and wild groups) and per gene was built from the mapping statistics provided by GATK. In order to remove noise from expression patterns associated with very weakly expressed genes as recommended in Rau et al. (2015), only genes with a total RC greater than 5000 across all samples (or equivalently, a mean RC greater than 278) were retained for further analysis. Then, the Bioconductor [R] package DESeq2 (Love et al., 2014) was used to identify significantly differentially expressed genes (DEG). Significance was declared after adjusting raw p-values to control the false discovery rate (FDR) at 5% using the Benjamini-Hochberg procedure (Benjamini & Hochberg, 1995). A variance stabilizing transformation was applied to normalized gene expression data prior to performing a principal components analysis
Version postprint
Accepted
Article
(PCA). We subsequently conducted a differential gene expression variability analysis between the cultivated and wild groups using the ‘DiffVar’ approach implemented in the missMethyl R/Bioconductor package (Phipson & Oshlack, 2014). Our objective was to identify candidate genes that differ in terms of expression variability between groups that may be caused by the rewiring of the underlying expression dynamics as illustrated by the co-expression patterns we identified here. Based on Levene’s z-test (Levene, 1960), the method detects differential variability in features measured in high-dimensional ‘omics data. The method is suitable for a broad range of experimental designs and is robust to non-normal distributions of gene expression levels. Briefly, this analysis consists of two steps: (1) Use the voom procedure (Law et al., 2014) to calculate gene-specific precision weights from the mean-variance relationship of normalized log-counts (Log2CPM) for each gene; and (2)
incorporate the per-gene weights into the empirical Bayes modeling framework of the limma R/Bioconductor package (Smyth, 2004) to stabilize t-statistics calculated on absolute deviations of the voom-transformed counts from the group mean. Genes were declared differentially variable after controlling the FDR at 5% using the Benjamini-Hochberg approach.
Clustering normalized gene expression profiles
To reach a high quality clustering, raw read counts were filtered to the stringent threshold of >5000 to remove weakly expressed genes. Here, the normalized expression profiles of DEG were clustered to discover groups of co-expressed genes using the statistical method implemented in the package ‘HTSCluster’ v2.0.8 (Rau et al., 2015). Briefly, the approach relies on an appropriately parameterized Poisson mixture model, a rigorous framework for parameter estimation, and a set of criteria to select the optimal number of clusters. The RC data were assumed to come from K distinct subpopulations (clusters), each of which was modeled separately by its own Poisson log-linear model whose mean was decomposed into three parts: 1) the Trimmed Mean of M-values (TMM) library size factors (scrop,j and swild,j for
Version postprint
Accepted
Article
variations in expression between crop and wild (λcrop,k and λwild,k). These mixture parameters
were estimated using an Expectation-Maximization (EM) algorithm. Each cluster k may then be described by a distinct normalized expression profile:
Λk = (scrop,j × λcrop,k, swild,j × λwild,k), for j = 1, … 9
corresponding to the proportion of normalized reads attributed to each sample; genes were assigned to a cluster using the maximum a posteriori (MAP) rule on the conditional probabilities of cluster membership. Finally, a set of mixture models was fit for a sequence of numbers of clusters K = 1, …, 0, , …, 7 ), and the slope heuristics, a non-asymptotic penalized likelihood criterion calibrated by the data-driven slope estimation (DDSE) approach (Baudry et al., 2011), was used to perform model selection among this set (i.e., the choice of the number of clusters K). The adjusted rand index (ARI) was computed to compare clusters associated with similar mixture models; hierarchical clustering (using complete linkage) on the Euclidean distance among Λk values was used to identify clusters
with similar and dissimilar profiles.
Gene ontology enrichment analyses
Enrichment in gene ontologies (GO) associated to the DEG was assessed using the Wallenius non-central hypergeometric distribution in the /Bioconductor package ‘goseq’ (Young et al., 2010). Gene lengths were retrieved from the ITAG v2.4. Only the biological processes (BP) GO terms were examined using the eval.go function. The gene space and testing list were defined from the tomato genome Slim GO terms and the GO terms associated to the DEG, respectively. Correction for multiple testing was applied using an FDR control of 5%. This procedure was applied similarly in two cases: (1) to identify the enriched molecular functions associated with the set of DEG between the crop and wild groups; and (2) to identify the enriched molecular functions associated with each cluster of DEG built using HTSCluster. Finally, to make a valid comparison between our analysis and the one conducted by Koenig et al. (2013), we extracted the data from the pairwise
gene-Version postprint
Accepted
Article
expression differences (adjusted p-values and log2 fold changes, from Supplementary Table 4) of the DEG identified at the 5% threshold and ran the gene ontology enrichment analysis using identical parameters.
Population genetic analyses and nucleotide diversity estimation
The population structure was inferred using the Structure v2.3 software (FALUSH et al. 2003)
and according to the recommendations proposed in Gilbert et al. (2012) to ensure the reproducibility of the results of this study. In particular, the most likely number of clusters K in all simulations was assumed to be in the range of K = 1 to K = 10. Ten replicates were conducted for each K with a burn-in period of 1×10⁶, followed by 5×10⁶ MCMC steps. The ad hoc statistic DK was used to determine the most probable K (EVANNO et al. 2005).
From the genotyping matrix, used as an input for the population structure analysis (see above), a principal component analysis was run, using the ‘prcomp’ function implemented in R, on all 18 individuals to provide a graphical description of the dataset on the first 2 axes. Similarly a PCA was conducted using the normalized level expression of the set of differentially expressed genes (see below) between the crop and wild group. Then, using the ‘s.match’ function implemented in the ‘mixOmics’ [ ] package v .1.2, (Le Cao et al., 2009)), a scatter diagram for the paired coordinates of both PCA on polymorphism (X-axis) and DEG expression (Y-axis) data represented the individuals in this two-dimensional space.
To determine the ancestral or derived state of each SNP marker, a best blast mutual hit was conducted by blasting (tblastn) the reference tomato CDS against the transcriptome of eggplant (Solanum melongena) (Sarah et al., 2016). The e-value threshold was set to 1×10
-90
, as tomato and eggplant have diverged since ~15.5 Myr (Wu & Tanksley, 2010).
A homemade program based on the Bio++ library (Gueguen et al., 2013) already described in (Nabholz et al., 2014) computed the level of polymorphism in both the crop and wild groups defined as the average number of pairwise nucleotide differences per site between DNA sequences (denoted π). The silent (π) and non-synonymous nucleotide diversity (π )
Version postprint
Accepted
Article
per polymorphic gene are giving information regarding the action of natural selection (i.e. level of constrain) on protein coding genes and, in our case, giving a rough estimation of the magnitude of the loss of diversity during the domestication bottleneck. The Tajima’s D index that quantifies departure from the neutral theory model at equilibrium between mutation and genetic drift was also computed per gene and per genetic group. A negative Tajima’s D value indicates an excess of rare allele (due for example to recent population expansion or selective sweep), while a positive value indicates an excess of alleles in intermediate frequency (ex: population structure or balancing selection). The raw data are provided in Supplementary Table 2.
Scanning for the detection of selective sweeps
To detect selective sweeps that may have occurred during the domestication process, we applied the approach proposed by Tang et al. (2007). Thus, in both groups, haplotypes were defined using Fastphase software (Scheet & Stephens, 2006), v1.2. Eggplant orthologs allowed orientating the SNP states (ancestral or derived). Then, the phased data were implemented in the rehh [R] package (Gautier & Vitalis, 2012) to compute the Rsb statistic for each SNP marker on separate chromosomes. Briefly, the Rsb statistic compared the extended haplotype homozygosity (EHH) between the crop and the wild groups, revealing recent positive selection. Then for a focal SNP, the Rsb statistic was defined for the pair of group as the (standardized) logs of the iES (integrated EHH) for the first population (iESCROP)
and the second population (iESWILD). At the genome-wide level, we examined the genes
included in the 1% of upper and 1% of lower distribution of the Rsb values. Then, from this set of genes, we ran a GO enrichment analysis using the perl module GO::TermFinder, which calculates the significance of GO term over-representation using an hypergeometric test (Boyle et al., 2004) and applied a 5% FDR correction. We compared the overlap between the 2% extreme Rsb values and the DEG (see below) and reran a GO enrichment analysis on this dataset (FDR<5%) using the same tool and parameters. A literature search
Version postprint
Accepted
Article
pinpointed the exact molecular functions of this set of overlapping genes that are both (1) included in selective sweeps and (2) differentially expressed between crop and wild.
Detection of cluster- and DEG-specific nucleotide diversity between crop and wild
We investigated the mean nucleotide diversity both πN and πN) of the genes included in (1)
each type of genes (DEG vs non-DEG, so-called ‘type’ factor) and 2) in each group (wild and crop). To do so, we first replaced 0 values with the smallest estimated nonzero value for πN and πN across all genes in both groups (3.54 × 10⁻⁵), and then calculated
,
, and in the wild and crop groups. We next fit the following linear models,
with model 1 : ~ type; model 2: ~ type; and model 3: ~ type +
group + type×group, where type is the type of gene (DEG or non-DEG). Similarly to the previous models, a type-II Anova table was constructed for each model and F-statistics used to test for significance at a threshold of p < 0.05.
All gene expression, statistical analyses and graphical representations were performed using R v3.2.1 (R Core Team 2013). R scripts are provided as Rmarkdown documents in the supplementary material.
Acknowledgements:
The authors are indebted to numerous people: Hélène Burck and Yolande Carretero (INRA, UR1052) that managed the plant growth and the CRB-Lég for providing the seeds; Muriel Latreille (INRA, SupAgro) for the preparation of the HTS libraries; the MGX and Integragen companies that produced the HTS data and to Benoit Nabholz and Pierre-Alexandre Gagnaire (ISEM, Montpellier) for sharing the Bio++ scripts and [R] scripts to produce the genome-wide visualisation of nucleotide diversity statistics, respectively. We also warmly thank the two anonymous reviewers for their helpful and constructive comments. The Agropolis Fondation supported this work under the ARCAD project No 0900-001
Version postprint
Accepted
Article
(http://www.arcad-project.org/). AR acknowledges the support of the French Agence Nationale de la Recherche (ANR) under grant MixStatSeq (ANR-13-JS01-0001-01).
Competing Interests: The authors have declared that no competing interests exist.
Short Supporting Information Legends
Supp. Figure 1: Ancestry inferred by the structure analysis.
Supp. Figure 2. Maximal conditional probability for the DEGs
Supp. Table 1. Summary description of the biological material and statistics of the
sequencing data
Supp Table 2. Population genetics statistics computed on the 9408 1:1 tomato-eggplant
orthologous genes, using the Bio++ library
Supp Table 3. Table of the raw read counts estimated for the mapping statistics for the 18
tomato accessions.
Supp. Table 4. Table of results from the identification of the differentially expressed genes
the crop and the wild tomato group of accessions, computed using DESeq2.
Supporting Method Files Legends
Supp. Method File 1: Rmarkdown document including the annotated R code used to
Version postprint
Accepted
Article
Supp. Method File 2: Rmarkdown document including the annotated R code used to
perform the identification of differentially expressed genes between the crop and wild tomato groups.
Supp. Method File 3: Rmarkdown document including the annotated R code used to
perform the clustering of co-expression DEG.
Supp. Method File 4: Rmarkdown document including the annotated R code used to
perform the gene ontology enrichment tests using both the DEG and the per-cluster DEG as test sets.
Supp. Method File 5: Rmarkdown document including the annotated R code used to
perform the genetic diversity analyses and genome-wide graphical representation.
Supp. Method File 6: Rmarkdown document including the annotated R code used to test
for cluster specific differences of πN and πS, between crop and wild tomato.
References
Baudry J-P, Maugis C, Michel B. 2011. Slope heuristics: overview and implementation.
Statistics and Computing 22(2): 455-470.
Baxter CJ, Carrari F, Bauke A, Overy S, Hill SA, Quick PW, Fernie AR, Sweetlove LJ. 2005. Fruit carbohydrate metabolism in an introgression line of tomato with increased
fruit soluble solids. Plant Cell Physiol 46(3): 425-437.
Bellucci E, Bitocchi E, Ferrarini A, Benazzo A, Biagetti E, Klie S, Minio A, Rau D, Rodriguez M, Panziera A, Venturini L, Attene G, Albertini E, Jackson SA, Nanni L, Fernie AR, Nikoloski Z, Bertorelle G, Delledonne M, Papa R. 2014. Decreased
nucleotide and expression diversity and modified coexpression patterns characterize domestication in the common bean. The Plant Cell Online.
Benjamini Y, Hochberg Y. 1995. Controlling the false discovery rate: A practical and
powerful approach to multiple testing. Journal of the Royal Statistical Society 57(1): 289 - 300.
Boyle EI, Weng S, Gollub J, Jin H, Botstein D, Cherry JM, Sherlock G. 2004.
GO:TermFinder--open source software for accessing Gene Ontology information and finding significantly enriched Gene Ontology terms associated with a list of genes.
Bioinformatics 20(18): 3710-3715.
Version postprint
Accepted
Article
Cargill M, Clark AG. 2005. Natural selection on protein-coding genes in the human
genome. Nature 437(7062): 1153-1157.
Caicedo AL, Williamson SH, Hernandez RD, Boyko A, Fledel-Alon A, York TL, Polato NR, Olsen KM, Nielsen R, McCouch SR, Bustamante CD, Purugganan MD. 2007. Genome-Wide patterns of nucleotide polymorphism in domesticated Rice.
PLoS Genet 3(9): e163.
Carroll SB. 2008. Evo-Devo and an expanding evolutionary synthesis: A genetic theory of
morphological evolution. Cell 134(1): 25-36.
Chakrabarti M, Zhang N, Sauvage C, Munos S, Blanca J, Canizares J, Diez MJ, Schneider R, Mazourek M, McClead J, Causse M, van der Knaap E. 2013. A
cytochrome P450 regulates a domestication trait in cultivated tomato. Proc Natl Acad
Sci U S A 110(42): 17125-17130.
Clark RM, Linton E, Messing J, Doebley JF. 2004. Pattern of diversity in the genomic
region near the maize domestication gene tb1. Proc Nat Acad Sci USA 101(3): 700-707.
Cockram J, Jones H, Leigh FJ, O'Sullivan D, Powell W, Laurie DA, Greenland AJ. 2007.
Control of flowering time in temperate cereals: genes, domestication, and sustainable productivity. J Exp Bot 58(6): 1231-1244.
Cong B, Liu J, Tanksley SD. 2002. Natural alleles at a tomato fruit size quantitative trait
locus differ by heterochronic regulatory mutations. Proc Natl Acad Sci U S A 99(21): 13606-13611.
Danecek P, Auton A, Abecasis G, Albers CA, Banks E, DePristo MA, Handsaker RE, Lunter G, Marth GT, Sherry ST, McVean G, Durbin R, Genomes Project Analysis G. 2011. The variant call format and VCFtools. Bioinformatics 27(15):
2156-2158.
DePristo MA, Banks E, Poplin R, Garimella KV, Maguire JR, Hartl C, Philippakis AA, del Angel G, Rivas MA, Hanna M, McKenna A, Fennell TJ, Kernytsky AM, Sivachenko AY, Cibulskis K, Gabriel SB, Altshuler D, Daly MJ. 2011. A
framework for variation discovery and genotyping using next-generation DNA sequencing data. Nat Genet 43(5): 491-498.
Doebley J, Stec A, Gustus C. 1995. Teosinte branched1 and the origin of maize: evidence
for epistasis and the evolution of dominance. Genetics 141(1): 333-346.
Evanno G, Regnaut S, Goudet J. 2005 Detecting the number of clusters of individuals
using the software structure: a simulation study. Mol. Ecol. 14: 2611-2620.
Falush D, Stephens M, Pritchard, JK. 2003 Inference of population structure using
multilocus genotype data: linked loci and correlated allele frequencies. Genetics 164: 1567-1587.
Version postprint
Accepted
Article
Frary A, Nesbitt TC, Grandillo S, Knaap E, Cong B, Liu J, Meller J, Elber R, Alpert KB, Tanksley SD. 2000. fw2.2: a quantitative trait locus key to the evolution of tomato
fruit size. Science 289(5476): 85-88.
Gautier M, Vitalis R. 2012. rehh: an R package to detect footprints of selection in
genome-wide SNP data from haplotype structure. Bioinformatics 28(8): 1176-1177.
Gest N, Gautier H, Stevens R. 2013. Ascorbate as seen through plant evolution: the rise of
a successful molecule? J Exp Bot 64(1): 33-53.
Gilbert KJ, Andrew RL, Bock DG, Franklin MT, Kane NC, Moore JS, Moyers BT, Renaut S, Rennison DJ, Veen T Vines TH. 2012 Recommendations for utilizing and
reporting population genetic analyses: the reproducibility of genetic clustering using the program structure. Molecular Ecology 21: 4925-4930.
Gueguen L, Gaillard S, Boussau B, Gouy M, Groussin M, Rochette NC, Bigot T, Fournier D, Pouyet F, Cahais V, Bernard A, Scornavacca C, Nabholz B, Haudry A, Dachary L, Galtier N, Belkhir K, Dutheil JY. 2013. Bio++: efficient extensible
libraries and tools for computational molecular evolution. Mol Biol Evol 30(8): 1745-1750.
Ho JWK, Stefani M, dos Remedios CG, Charleston MA. 2008. Differential variability
analysis of gene expression and its application to human diseases. Bioinformatics
24(13): i390-i398.
Huang X, Kurata N, Wei X, Wang Z-X, Wang A, Zhao Q, Zhao Y, Liu K, Lu H, Li W, Guo Y, Lu Y, Zhou C, Fan D, Weng Q, Zhu C, Huang T, Zhang L, Wang Y, Feng L, Furuumi H, Kubo T, Miyabayashi T, Yuan X, Xu Q, Dong G, Zhan Q, Li C, Fujiyama A, Toyoda A, Lu T, Feng Q, Qian Q, Li J, Han B. 2012. A map of rice
genome variation reveals the origin of cultivated rice. Nature 490(7421): 497-501.
Hufford MB, Xu X, van Heerwaarden J, Pyhajarvi T, Chia JM, Cartwright RA, Elshire RJ, Glaubitz JC, Guill KE, Kaeppler SM, Lai J, Morrell PL, Shannon LM, Song C, Springer NM, Swanson-Wagner RA, Tiffin P, Wang J, Zhang G, Doebley J, McMullen MD, Ware D, Buckler ES, Yang S, Ross-Ibarra J. 2012. Comparative
population genomics of maize domestication and improvement. Nat Genet 44(7): 808-811.
Itkin M, Heinig U, Tzfadia O, Bhide AJ, Shinde B, Cardenas PD, Bocobza SE, Unger T, Malitsky S, Finkers R, Tikunov Y, Bovy A, Chikate Y, Singh P, Rogachev I, Beekwilder J, Giri AP, Aharoni A. 2013. Biosynthesis of antinutritional alkaloids in
solanaceous crops is mediated by clustered genes. Science 341(6142): 175-179.
Karlova R, van Haarst JC, Maliepaard C, van de Geest H, Bovy AG, Lammers M, Angenent GC, de Maagd RA. 2013. Identification of microRNA targets in tomato
fruit development using high-throughput sequencing and degradome analysis. J Exp
Bot.
Koenig D, Jimenez-Gomez JM, Kimura S, Fulop D, Chitwood DH, Headland LR, Kumar R, Covington MF, Devisetty UK, Tat AV, Tohge T, Bolger A, Schneeberger K, Ossowski S, Lanz C, Xiong G, Taylor-Teeples M, Brady SM, Pauly M, Weigel D,
Version postprint
Accepted
Article
Usadel B, Fernie AR, Peng J, Sinha NR, Maloof JN. 2013. Comparative
transcriptomics reveals patterns of selection in domesticated and wild tomato. Proc
Natl Acad Sci U S A 110(28): E2655-2662.
Kooke R, Johannes F, Wardenaar R, Becker F, Etcheverry M, Colot V, Vreugdenhil D, Keurentjes JJB. 2015. Epigenetic basis of morphological variation and phenotypic
plasticity in Arabidopsis thaliana. The Plant Cell 27(2): 337-348.
Latzel Vt, Allan E, Bortolini Silveira A, Colot V, Fischer M, Bossdorf O. 2013. Epigenetic
diversity increases the productivity and stability of plant populations. Nat Com 4: 2875.
Law CW, Chen Y, Shi W, Smyth GK. 2014. voom: precision weights unlock linear model
analysis tools for RNA-seq read counts. Genome Biology 15(2): 1-17.
Le Cao K-A, Gonzalez I, Déjean S. 2009. integrOmics: an R package to unravel
relationships between two omics datasets. Bioinformatics 25(21): 2855-2856.
Lemmon ZH, Bukowski R, Sun Q, Doebley JF. 2014. The Role of cis regulatory evolution
in maize domestication. PLoS Genetics 10(11): e1004745.
Levene H 1960. Robust tests for equality of variances. In: Olkin I, Ghurye SG, Hoeffding W,
Madow WG, Mann HB eds. Contributions to Probability and Statistics. Stanford: Stanford University Press.
Li H, Durbin R. 2009. Fast and accurate short read alignment with Burrows-Wheeler
transform. Bioinformatics 25(14): 1754-1760.
Li H, Handsaker B, Wysoker A, Fennell T, Ruan J, Homer N, Marth G, Abecasis G, Durbin R, Genome Project Data Processing S. 2009. The Sequence
Alignment/Map format and SAMtools. Bioinformatics 25(16): 2078-2079.
Li YH, Li W, Zhang C, Yang L, Chang RZ, Gaut BS, Qiu LJ. 2010. Genetic diversity in
domesticated soybean (Glycine max) and its wild progenitor (Glycine soja) for simple sequence repeat and single-nucleotide polymorphism loci. New Phytol 188(1): 242-253.
Lin T, Zhu G, Zhang J, Xu X, Yu Q, Zheng Z, Zhang Z, Lun Y, Li S, Wang X, Huang Z, Li J, Zhang C, Wang T, Zhang Y, Wang A, Zhang Y, Lin K, Li C, Xiong G, Xue Y, Mazzucato A, Causse M, Fei Z, Giovannoni JJ, Chetelat RT, Zamir D, Stadler T, Li J, Ye Z, Du Y, Huang S. 2014. Genomic analyses provide insights into the history
of tomato breeding. Nat Genet 46(11): 1220-1226.
Liu J, Van Eck J, Cong B, Tanksley SD. 2002. A new class of regulatory genes underlying
the cause of pear-shaped tomato fruit. Proc Natl Acad Sci U S A 99(20): 13302-13306.
Love MI, Huber W, Anders S. 2014. Moderated estimation of fold change and dispersion