no. H'^l-'^3>
^^>''
WORKING
PAPER
ALFRED
P.SLOAN
SCHOOL
OF
MANAGEMENT
CONTINUOUS-REVIEW POLICIES FOR A MULTI-ECHELON
INVENTORY PROBLEM WITH STOCHASTIC DEMAND by Marc De Bodt and Stephen C. Graves ** WP #1441-83 August 19a^-2
MASSACHUSETTS
INSTITUTE
OF
TECHNOLOGY
50MEMORIAL
DRIVE
CAMBRIDGE,
MASSACHUSETTS
02139CONTINUOUS-REVIEW POLICIES FOR A MULTI-ECHELON
INVENTORY PROBLEM WITH STOCHASTIC DEMAND by * Marc De Bodt and ** Stephen C. Graves WP #14Al-83 August 19§/2
CIM-fellow, Katholieke Universiteit Leuven, Afdeling Industrieel Beleid,
Celestijnenlaan 300B, 3030 Heverlee, Belgium
itit
Massachusetts Institute of Technology, Alfred P. Sloan School of
Continuous-Review Policies for a Multi-Echelon
Inventory Problem with Stochastic Demand
by Marc DeBodt
Stephen C. Graves
ABSTRACT
This paper considers an inventory problem on a multi-stage, serial
system. The demand for the end item is stochastic and stationary. The
relevant costs include a fixed ordering cost and an echelon inventory
holding cost for each stage, and a backorder cost for the end item. The
objective is to find a continuous-review inventory control policy that
minimizes the expected costs. We present and analyse an approximate cost
model. This model is an extension to the traditional single-item,
continuous-review inventory model that leads to a reorder point, reorder
quantity policy. The nature of our approximation is identical to that for
the traditional single-item model. The policies that we derive are also
quite analogous to those for the single-item model,
1. Introduction
Most multi-echelon inventory systems have significant stochastic
characteristics. Yet most of the inventory control systems in practice,
such as materials requirements planning (MRP) systems, either ignore these
stochastic elements or deal with them in an overly simplistic manner.
Furthermore in the inventory literature there is very little theory that
can be applied to these problems. In this paper we hope to make a small
step at improving this theory. We consider a simple multi-echelon system,
namely a serial system, for which we determine continuous-review control
policies. We base this analysis on an approximate cost model that is a
direct extension to the approximate cost model used for a single-item,
continuous-review inventory problem. The resulting solution is quite
analogous to that for the single-item model, that being the determination
of a reorder point and a reorder quantity. In the remainder of this
section we give a brief review of some relevant literature.
The most closely-related work is that by Clark and Scarf [ 3 ] , [ 4 ]
.
In this work, they analyse both serial and assembly systems under a periodic
review control system when the end item demand is uncertain. When a fixed
ordering cost is assumed at all stages, their solution procedure only gives
an approximate solution but does provide both upper and lower bounds on the
cost for the optimal solution. Their solution method computes the optimal
policy for each echelon separately, with successive echelons being linked
by a penalty function that represents the cost of not being able to fill a
replenishment request. Extensions to the Clark-Scarf approach are given by
Schmidt and Nahmias [12] who characterize the optimal inventory policy for
a simple assembly system and by Lambrecht et al. [8 ] who examine various
An integral and important aspect of the Clark-Scarf studies is the
use of echelon inventory in the control policies for the multi-echelon
system. The echelon stock for a component is defined as the inventory of
the component plus all of the inventory of downstream items that use or
require the component (e.g. subassemblies or end items). In this paper
we will rely heavily on the use of echelon stock in the control policy.
Additional analytical work on multi-echelon inventory systems has
been done by Simpson [15] and by Hanssman [7], both of whom consider very
specific cases. Simpson treats a serial system with no setup costs and
with all shortages handled exogenously. He provides an analysis for a
periodic-review, base stock control system. Hanssman extends this analysis
for the case where the customer demand level is a function of the service level provided.
Finally there has recently been substantial effort attempting to
determine appropriate safety stock policies for MRP control systems,
(e.g. Carlson and Yano
[2],
[17], Meal [9 ], Miller [lO], New [ll] ,Whybark and Williams [16], Candea [ 1 ]) This work focuses on the questions
of where to place safety stock in a complex production system and how much
safety stock is necessary to provide adequate protection. This body of
research includes both exploratory efforts at characterizing the proper
policy (e.g. Miller [10], Whyback and Williams [16], Candea [1]) as well as
detailed approaches to resolving some of the issues (e.g. Carlson and Yano
2. Problem Description and Assumptions
The problem of interest is to find good inventory control policies
for a multi-echelon production/inventory system with stochastic demand
under continuous review. In Section 3 we present an approximate model
for a two-stage production/inventory system. In Section 4 we show how
this analysis extends to an M-stage serial system. In Section 5 we discuss
how the model might be generalized to more realistic production/inventory
assembly systems. The basic model is a direct extension of the classical
continuous-review model for a single item with stationary, stochastic demand,
i.e. a reorder point, order quantity model (Hadley and Whitin [ 6 ], pp. 159-169)
Below we state the key assumptions describing the operating mechanics of the
system that we model.
(i) We assume primarily a pure serial production/inventory
system. In a serial system each stage has at most one
succeeding stage and at most one preceding stage , Each
stage is both an inventory control point and a production
or processing center. In Section 5 we talk briefly about
applying the model to more complex assembly systems.
(ii) Independent demand occurs only for the end item at the
final stage (item 1) . The demand process for the end
item is a stationary, stochastic process. For convenience,
we might assume that the demand over a fixed time interval
is a random variable with a normal distribution. All other
stages experience demand that is dependent upon the
(iii) Associated with each stage is a deterministic production lead time. Once the production of a lot is initiated at a stage, that lot becomes available for inventory only
after the fixed lead time. Furthermore, the entire lot
is available after the fixed lead time,
(iv) The production of a lot at a stage requires that all
components (immediately preceding stages) be available at
the start of production. Hence, the start of production
results in an immediate draw-down of the component inventories,
(v) The relevant costs at each stage are a fixed setup cost
for the production of a lot and a linear inventory holding
cost. We assume any variable production costs to be linear
in the production lot size and can be ignored,
(vi) End item demand that cannot be satisfied immediately from
inventory is backordered at a cost proportional to the
number of items backordered.
(vii) We desire inventory control policies that minimize expected
cost per unit time. We restrict attention to
continuous-review stationary policies where each stage has a reorder
point and an order quantity. Whenever the echelon inventory
at a stage drops below the stage's reorder point, the stage
initiates production of an order quantity provided that
component stock is available. We require the order quantity
at a stage to be an integral multiple of the order quantity
at the succeeding stage. This latter assumption is consistent
with the policies examined by Crowston et al. [ 5 ] and Schwarz
and Schrage [14] for an analogous deterministic lot-sizing
This set of assumptions clearly describes an idealized setting.
Yet, the assumptions are similar in spirit to those required in the
continuous-review, single-item model with stochastic demand. Alternatively,
we can view these assumptions as describing a continuous-review analog to
the system studied by Clark and Scarf [ 3 ] , [ 4 ] . The most limiting
assumption would seem to be that the production lead times are fixed; this
removes any problem complexity arising from having to plan or allocate
production capacity across the production stages. In addition, by assuming
the form of the control policies, we greatly simplify the analysis. Yet,
we assert that for the operating system described, the proposed control
policies are most reasonable. Indeed we could not conceive of any other
form of control policy. To illustrate the control policy, we discuss next
3. Two Stage Example
Before illustrating the continuous-review policy with a small example,
we need first review the traditional reorder-point, reorder-quantity model
for a continuous review, single stage system (e.g. Hadley and Whitin [6]).
To do this we introduce the following notation:
Q - reorder quantity
R - reorder point
C(Q,R) - expected cost per year as a function of the
parameters Q and R
d - expected annual demand
h - holding cost per unit per year
b - backorder cost per unit
a - setup or ordering cost
f(x|£) - probability density function for lead time demand,
where I denotes the length of the lead time
Now the expected cost function is the sum of the expected setup costs,
holding costs and backorder costs. It is customary to approximate this
cost expression as follows:
00 (1) C(Q,R) =
^
+ h(f + / (R-x)f(x|£)dx) ^ CO+^
/ (x-R)f(x|£)dx RIn this expression the setup cost and backorder cost terms are exact, while
the holding cost term is approximate. The holding cost term consists of
the average cycle stock, hQ/2, and the expected safety stock.
the expected net inventory level just prior to replenishment. The reason
for this approximation is its analytic tractability relative to an exact
expression. From the approximate cost expression, the best choice of
policy parameters is given by the simultaneous solution to the following
two expressions: (2) Q and /2d(a + bz(R)) (3) / f(x|!l)dx =
^
where z(R) = / (x-R)f(x| Jl)dx . RFor most common settings in which the backorder cost is significantly larger
than the inventory holding cost, this solution from the approximate cost
expression is nearly optimal. In what follows for a multi-stage system, we
will use the analogous approximation for the expected holding cost as used
in (1).
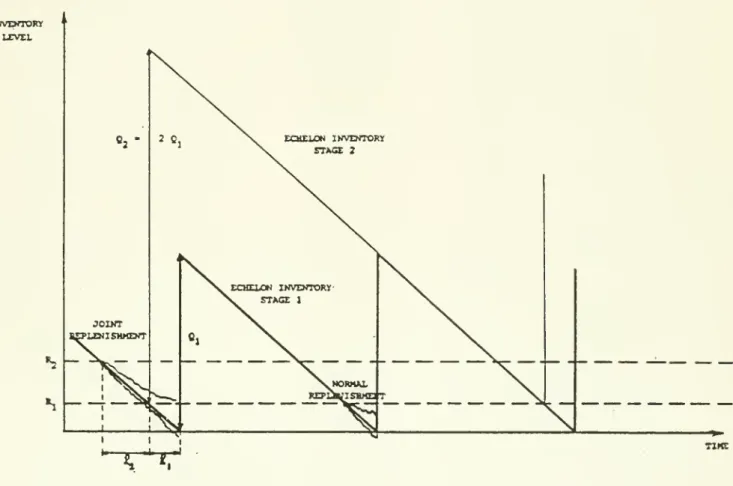
Now consider a two-stage system. The notation is similar to before,
with the subscript denoting the stage: stage one is the downstream stage
and represents the end item; stage two is the upstream stage and represents
the component. We assume that the order quantities are chosen such that
Q„ = nQ^ for n being a positive integer. The reorder point for the component,
R„, applies to the echelon inventory, that being the inventory (on-hand and
on-order) at either stage two (component) or stage one (end item) . After
placing an order, stage two receives its stock replenishment after a fixed
Q units of the component are immediately forwarded for processing to end items, regardless of the inventory status of end items. This order quantity
will arrive in the inventory for end items after £ time units. Hence, a
replenishment for components leads to a replenishment for end items, with the
total lead time for the end-item order quantity being £ + £ time units
after the initiation of the component replenishment. We call this a joint
replenishment. Normal replenishment for end items occurs whenever the
end-item inventory hits its reorder point and sufficient component inventory
is on-hand. A joint replenishment is followed by exactly n-1 normal
replen-ishments by stage one. This cycle then repeats, starting with the next
joint replenishment. We depict this behavior for n=2 in Figure 1.
To derive a cost expression for this system, we consider separately
each of the cost elements. For a given set of policy parameters, the
expected annual ordering cost is easily found to be
ad
ad
(4) -^=- +
-^
To derive the inventory holding cost, we first consider the echelon
inventory for components over a complete order cycle. Just prior to the
arrival of an order quantity of components, the on-hand echelon inventory
is approximated by
/ (R„-x)f(x|£ )dx
where f(x|ii ) is the probability density function for demand over £„ time
units, equal to the lead time at stage two. This expression is approximate
since shortages are treated as negative inventory. Just after the order
arrival, the on-hand echelon inventory is the above quantity plus Q„ = nQ,
INVEWTORy LEVEL
•T-^
10
Since we assume demand to be stationary, the expected echelon inventory
holding cost over a complete order cycle is
nQ
(5) h
(-^
+ / (R -x)f(x|£„)dx),where h„ is the per unit echelon holding cost.
The derivation for stage one is quite similar, but now we must
distinguish between the types of replenishment. Consider an order cycle
at stage one. In n-1 out of n times we have a normal replenishment, and
the on-hand inventory just prior to the order arrival is
oo
/ (R
-x)f(xU
)dx.In one out of n times we have a joint replenishment, and the on-hand
inventory just prior to the order arrival is approximated by
oo
/ (R -x)f(x|2, +«, )dx,
since effectively the lead time is ^-,+^2 ^^^^ ^ reorder point of R„. We
assume here that even though the reorder point R2 applies to the echelon
stock for the component, that all of this stock will have been processed to
end items by the time the replenishment of end items arrives. This will
almost certainly be true for most cases of interest. Again, the on-hand
inventory after an order arrival is the above quantity plus Q^. Hence,
the expected echelon inventory holding cost associated with stage one is
Q 0°
(6) h • C-:^ +
^^
/ (R--x)f(x|£jdx1 2 n Q 1 1
00
11
where now h denotes the echelon holding cost for the end item. A
somewhat-more rigorous justification for this approximation is given in the appendix.
Since backorders occur only for the end items, we must distinguish
between the types of replenishment for the end item to compute the expected
backorder cost. As a consequence of a normal replenishment, the expected
backorder cost is just
b / (x-R )f(x|£ )dx.
^1
Similarly for a joint replenishment we have
oo
b / {x-R„)fix\l +<i^)dx
^2
since the replenishment is triggered at R and requires £,+£„ time units to
complete. We again make the assumption that the entire component inventory
of R„ is available to satisfy end item demand within the joint lead time.
By combining these terms in the proper proportions we get the expected
backorders per replenishment of end items. By weighting this by the annual
number of replenishments, we find the annual expected backorder cost:
oo (7)
YT
'(^^
^ (x-R^)f(x|£.)dx ^1 " R^ 1 ^ OO +-
/ (x-R„)f(x|«,,+«,„)dx) . n 2'12
^2By summing (4-7) we obtain the expected cost as a function of the
parameters, Q , R , R and n, call it C(Q, ,R^ ,R„,n) . This expression is
12
of n > 1 is given, then to minimize the expected cost we choose the remaining
parameters as the simultaneous solution to the following equations:
/2d(a,
+^
+ bz(R ,R„,n)) CO h Q (9) / f(x|£^)dx =-^
(h + nh )Q (10) / f(x|jiT+a„)dx =—
,—
-'12
bd ^2 OO where z(R, ,R„,n) = ^^^- f (x-R, )f(x I £,)dx^2
" R^ ^ ^ 00 +-
/ (x-R„)f(x|£,+£„)dx. " R2 ^^
^For the case with n=l, the problem collapses to a one-stage problem for
which the solution given by (2)-(3) is applicable (i.e. a = a + a„,
h = h + h„, £ = £ + £„) . The solution to the equations (8)-(10) can be
found via an iterative procedure that alternates between solving (8) for Q^
given R and R„, and solving (9)-(10) for R^ and R„ given Q .
We note that the above solution is very similar to that for the
single-stage system. We can interpret the order quantity Q, as an economic
order quantity. The ordering cost has been augmented to reflect the
coordinated replenishments and the expected backorder cost per cycle. The
holding cost also reflects the coordinated replenishments. The reorder
points are found by setting their respective stockout probabilities equal
to a critical ratio. Interestingly, these critical ratios differ, with
13
than for the end item. Although it is possible for R to be less than R ,
we will typically have R„ greater than R^ , as one might expect.
Determining the best choice for n is not as simple. For given values
of Q , R^ and R„, the cost expression C(Q^ ,R-| ,R„,n) is unimodal in n.
Hence, for this case we can easily find the best choice for n by a simple
line search. Conceivably then, one could iterate between finding the best
choice for Q^ , R and R„ for a given value of n and finding the best choice
for n for given values of Q-. , R, and R„. This iterative procedure will
obtain improved solutions at each step and is guaranteed to converge since
we can bound the largest possible choice for n. However, there is no
guarantee that this procedure finds the global optimal solution; rather,
this procedure would only ensure a local optimum. An alternate procedure
might be to search over possible values for n, where for each candidate value
of n the best choice for Q^ , R and R„ are determined from (8)-(10). We
conjecture that the objective value as a function of n, assuming that the
conditionally-optimal choices for Q^ , R^ and R„ are used, is unimodal in n;
hence we could perform the line search quite efficiently. We suggest as a
starting value for n to use the optimal choice for n for the deterministic
14
4. M-Stage Serial System
The analysis of the two-stage system extends directly to M-stage
serial systems for M > 2. We need define the integer variables n. to be
the relative order frequency between stage i and stage i-1, for i = 2, 3, .. . M.
Hence, the order quantity for stage i is Q. = n.Q. ^, and Q. = n.n. , ... n^O-, .
1
11-1
^1 1 1-1 2^1For convenience, we define r. = n.n. , ... n„ so that Q. = r.Q, and r. -,/r. is
1 1 1-1 2 ^1 1^1 1+1 1
an integer. We assume, as in the two-stage example, that the reordering policy
is a "nested" policy. That is, for any two successive stages, say k and k+1,
the lower stage orders exactly n, times for each order by the higher stage.
Furthermore, whenever stage k+1 orders, there is a joint replenishment with
stage k and all lower stages.
We now express the expected annual cost as a function of the policy
parameters. To do this we will again consider separately the three types of
costs: setup or ordering, inventory holding and backorder. The expected
annual ordering cost is now given by
(11)
f
• (a^+^
+^+
...+^).
^1 ^ ^2 ^3 ^M
To express the expected holding cost we consider each stage separately.
For stage one (end item) the derivation is analogous to that for the two-stage
example, but more complex. There are now M types of replenishment at stage one.
A normal replenishment occurs whenever stage one reorders without any other
stage having reordered; a "two-stage" joint replenishment occurs when stage
two reorders followed by stage one reordering; a "k-stage" joint replenishment
occurs when stage k reorders and triggers subsequent reorderings by stage
k-1, k-2, ... 1. The initiation of an "M-stage" joint replenishment is a
15
"M-stage" joint replenishments. A cycle entails r = n„n , . . n^
replenish-ments by stage one. Of these r replenishments by stage one, exactly one
corresponds to an "M-stage" joint replenishment, rL,-l of the replenishments
are from "M-1 stage" joint replenishments, n^(n^_,-l) of the replenishments are from "M-2 stage" joint replenishments, and so on. In general, there are
n,.n,, , . . . n, ,„(n, ^-,-1) = r„( ) replenishments that correspond to
M M-1 k+2 k+1 M r,
^]^+i
"k-stage" joint replenishments. Finally, there are
^j^^ • • • n (n2-l) = r^^Cl -
—
)normal replenishments at stage one. Now by repeating the arguments used in the
two-stage example and in the appendix, we approximate the inventory holding cost
for stage one (end item) by the following:
Q " (12) h .
{^
+ (1 -—
) / (R -x)f(x|£ )dx ^2 CO + (- -) f (R,-x)f(x|£ +£ )dx + . . . 00 M-1 M 00 +—
/ (R^-x)f(x|«. + ... + £ )dx}. '^MThe first term within the brackets is just the average cycle stock. The
remaining terms comprise the expected safety stock level, which is modeled
as a weighted average of the remaining inventory over all types of
replenishments
.
For stage k, k > 1, the derivation of the expected holding cost is
16
the echelon inventory at stage k depends only on the replenishments by stage k
and by higher stages (i.e. stage k+1, ... stage M) . Indeed we can view the
stage-k echelon inventory as if it were the end-item inventory of an (M-k+1)-stage
serial system consisting of stages k, k+1, . . . M. By repeating the arguments
used for the end item, we obtain the following for the expected echelon
inventory holding cost for stage k, k = 2, 3, . . . M:
""k^l ''k (13) h, •
{~^+
(1—)
f (R,-x)f(x|^,)dx ^ ^ ""k+l " oo + r(-^
--^)
/ (R -x)f(x|£ +£ )dx ^ ''k+l ''k+2 ''^ _^^
+ . . . OO 4-r^(-^
- j-) f (R^_,-x)f(xU^^ + ... + £^_^)dx M-1MO
""k " +—
/ (R -x)f(xk, + ... + £-.)dx} rj^ M k MThe interpretation of this term is identical to that given for (12)
.
To represent the expected annual backorder cost we must account for the
different types of replenishments for the end item. By extending the earlier
arguments for the two-stage example, we obtain the following expression:
oo (14)
^
.{(1--L)
/ (x-R)f(xU
)dx ^1^
^1 OO + (- —) I (x-R )f(x|£ +£ )dx ^"2 ^"3 R2 00 +...+—
/ (x-R„)f(x I £-, + ... +O
dx} . ^M R^ >1 ' 1 M def^
z(R;n) ^117
The term z(R;n) is defined above to be the expected backorder per
replenish-ment at stage one.
The total expected cost as a function of the policy parameters is the
sum of (11)-(14). If we assume that the {n.} values are specified, then we
minimize the expected cost by choosing the remaining parameters bythe
simul-taneous solution to the following equations:
2d(a, +
^
+—
i + ...+-^
+ bz(R;n)) 1 r r r (15) Q - '' 1 ? h^ + r^h^ + ...+v^h^
h Q (16) / f(xl£^)dx =-^
^1 (h + r h + ... + r h )Q (17) /f(xk,
+ £„ + ... + £,)dx =—^
7-5 ' 1 / k bd\
for k = 2, . . . MEquation (17) is applicable only when r > r, or equivalently
n,^
> 1.If n, ^ = 1, then the determination of R, is not relevant since stage k reorders
only whenever stage k+1 reorders. We note that the reorder points are such
that the stockout probabilities associated with each stage's replenishments
increases with the stages. Also, although typically R, < R. , -i » it is possible
for R^ > R, ,, as we saw in the two-stage example.
We solve (15)-(17) by the iterative procedure that alternates between
determining the order quantity and determining the reorder points. Determining
the optimal choice for the {n.} values is much more difficult. It would seem
to require an enumeration over all candidate solutions, most likely by a
branch-and-bound procedure. We expect a very good starting solution for such a
procedure would be to use the optimal {n.} values from, the deterministic version
18
5. Extensions
In this section we first present one extension for a specific
two-echelon assembly system, and then discuss the feasibility of more general
extensions
.
Consider a two-echelon, M-stage assembly system as depicted below.
Customer demand
We assume that the order quantities for the components are integral multiples
of the order quantity for end item, i.e. Q. = n.Q for n. being a positive
integer, i = 2, ... M. To develop a cost function for this system, we need
to characterize the types of joint replenishments that can occur. We define
a "stage-k" joint replenishment as a joint replenishment with the end item
in which stage k is the component with the longest replenishment lead time
amongst those components that will be simultaneously replenished. A "stage-k"
replenishment is initiated when the echelon inventory of stage k reaches its
reorder point. If component i is to be simultaneously replenished with
stage k, then it is reordered exactly I - I. time units after the order for k.
A normal replenishment occurs whenever the end item reorders without any
compo-nent having jointly reordered. Without loss of generality, we assume that
l^ > S^^ > ... > l^,.
I
—
i—
—
MSuppose that the order frequencies {n.} are relatively prime. With a
little thought we can see that there is a regenerative cycle consisting of
n n ... n^ replenishments by the end item. Of these replenishments, exactly
n n, • • • i\4 replenishments are "stage- two" joint replenishments with an
effective lead time of I + 8, ; (n -l)n n^ ... n^ of the replenishments are
19
general, (n„-l) (n -1) ... (n -l)n ... ri of the replenishments are
"stage-k" joint replenishments with a lead time of I, + I , for k = 3, ... M-1.
Finally, there are (n -1) (n -1) ... (n^_^-l) "stage-M" joint replenishments
and (n^-1) (n -1) ... (n^-l) normal replenishments.
By knowing the types of joint replenishments in a regenerative cycle,
we can now apply the logic previously used to characterize both the expected
holding costs and the expected backorder cost. With this we can develop a
cost function of the policy parameters. The minimization of this cost function
results in a solution that would be quite analogous to that for a serial system,
namely (15)-(17). Once again we must assume that the order frequencies are
given, and furthermore, that they are relatively prime. If the order
fre-quencies are not relatively prime, then this approach would overstate the
number of "stage-k" joint replenishments for k > 2, and would understate the
number of normal replenishments. As a consequence, the cost function will
tend to be overstated for the range of policy parameters of interest.
Never-theless, optimization of this overstated cost function may lead to a reasonable
choice of policy parameters.
An alternative approach for the case when the order frequencies are
not relatively prime would be to explicitly enumerate the number of joint
replenishments of each type over a regenerative cycle. We could then form
a cost function that we would minimize as in the earlier cases. The
dif-ficulty with this approach is the lack of a closed-form expression for the
number of joint replenishments of a particular type.
For more complex assembly networks, the analysis soon becomes hopeless.
One possible approach is to force the network into behaving like a serial
20
Issue is again to identify the types and to enumerate the occurences of
joint replenishments. In principle, we can always do this. But the task
is quite overwhelming even for networks with modest complexity. Clearly
21
APPENDIX
In this section we provide a general justification for the approximate
expression that we use for the average echelon inventory level for any stage.
Consider a regenerative cycle in which a particular inventory (or echelon
inventory) is replenished exactly n times in each cycle. Each replenishment
quantity is equal to Q, and we assume that the demand is stationary, albeit
stochastic. Assume that just prior to the arrival of the i replenishment
in the cycle, the expected net inventory level is s. , i = 1, 2, ..., n.
The following illustration (n=3) may be of help:
Inventory Level * • • J ^ ^
^
time Duration of CycleNow the nature of the approximation is to use these expectations (s.)
to calculate the average (echelon) inventory level over the regenerative cycle.
Given that the demand process is stationary and continuous, the average inventory
level is just the area in the n trapezoids (one for each replenishment in the
cycle) divided by the length of the regenerative cycle. In general, we state
22
n Q
+
s. + s. ,^ Q + s. - s(Al) ( Z
i^^±i
i^—
^)
.f
i=l
where s = s^ and d is the annual demand rate. After simplification, (Al)
just reduces to
n s.
(A2)
^
+ E—
For instance, in the two-stage system we have
s = / (R -x)f(x|£ +£ )dx
s. = / (R.-x)f(x| 2,,)dx for i=2,3 . . . n.
Then, (A2) is just
2 n n
as was given in Section 3. Similar derivations are possible for the average
23
REFERENCES
1. CANDEA, D., Issues of Hierarchical Planning in Multi-Stage Production
Systems, Technical Report No. 134, O.R.Center, M.I.T., Cambridge,
July 1977.
2. CARLSON, R. C. and YANO, C. A., Buffering Against Demand Uncertainty
in Material Requirements Planning Systems - Systems with Emergency
Setups for Some Components, Technical Report 81-3, Dept. of Industrial
Engineering and Engineering Management, Stanford University, April 1981,
3. CLARK, A. J. and SCARF, H. , Optimal Policies for a Multi-Echelon
Inventory Problem, Management Science, Vol. 6, No, 4, July 1960,
pp. 475-490.
4. CLARK, A.J. and SCARF, H. , Approximate Solutions to a Simple
Multi-Echelon Inventory Problem, in: Arrow, K. J. et. al. (ed.). Studies
in Applied Probability and Management Science, Stanford University
Press, California, 1962, pp. 88-100.
5. CROWSTON, W.B., WAGNER, M. , and WILLIAMS, J. F. , Economic Lot Size
Determination in Multi-Stage Assembly Systems, Management Science,
Vol. 19, No. 5, January 1973, pp. 517-527.
6. HADLEY, G. and WHITIN, T. M., Analysis of Inventory Systems,
Prentice-Hall, Englewood Cliffs, NJ, 1963,
7. HANSSMAN, F,, Optimal Inventory Location and Control in Production
and Distribution Networks, Operations Research, Vol, 7, No, 4,
1959, pp. 483-498,
8. LAMBRECHT, M, R. , LUYTEN, R, , and MUCKSTADT, J,A,, Safety Stock
Policies for Multi-Echelon Production Systems, Onderzoeksrapport
No. 82-08, Dept, of Applied Economics, K,U,Leuven, March 1982.
9. MEAL, H,
C,
Safety Stocks in MRP Systems, Technical Report No. 166,24
10. MILLER, J. G., Hedging the Master Schedule, in: Ritzman, et. al.
,
Disaggregation: Problems in Manufacturing and Service Organizations,
Martinus Nijhoff Publishers, Boston, 1979.
11. NEW,
C,
Safety Stocks for Requirements Planning, Journal forProduction and Inventory Management, 2nd quarter, 1975, pp. 1-18.
12. SCHMIDT, C. P. and NAHMIAS, S., Optimal Policy for a Two Stage
Assembly System Under Random Demand, Working Paper, Dept. of
Quantitative Methods, University of Santa Clara, California, April 1981.
13. SCHWARZ, L. B., A Simple Continuous Review Deterministic One-Warehouse
N-Retailer Inventory Problem, Management Science, Vol. 19, Jan. 1973, pp. 555-f
14. SCHWARZ, L. B. and SCHRAGE, L. , Optimal and System Myopic Policies
for Multi-Echelon Production/Inventory Systems, Management Science,
Vol. 21, No. 11, July 1975, pp. 1285-1294.
15. SIMPSON, K. F., In-Process Inventories, Operations Research, Vol. 6,
1958, pp. 863-873.
16. WHYBARK, D.C. and WILLIAMS, J.
C,
Material Requirements PlanningUnder Uncertainty, Decision Sciences, Vol. 7, 1976, pp. 595-606.
17. YANO, C. A. and CARLSON, R.
C,
Buffering Against Demand Uncertaintyin Material Requirements Planning Systems - Systems with Emergency
Setups, Technical Report 81-2, Dept. of Industrial Engineering
MITIIBRARIFS