HAL Id: hal-01946123
https://hal.archives-ouvertes.fr/hal-01946123
Submitted on 5 Dec 2018HAL is a multi-disciplinary open access archive for the deposit and dissemination of sci-entific research documents, whether they are pub-lished or not. The documents may come from teaching and research institutions in France or abroad, or from public or private research centers.
L’archive ouverte pluridisciplinaire HAL, est destinée au dépôt et à la diffusion de documents scientifiques de niveau recherche, publiés ou non, émanant des établissements d’enseignement et de recherche français ou étrangers, des laboratoires publics ou privés.
A honeycomb seafloor morphology in carbonate
sediment of the Carnegie Ridge (offshore Ecuador):
Formation and potential geodynamic significance
F. Michaud, J.Y. Collot, G. Ratzov, Jean-Noel Proust, A. Dano, J.F. Lebrun,
M.J. Hernández, G. Loayza, A. Khaoulani, Y. Stoll, et al.
To cite this version:
F. Michaud, J.Y. Collot, G. Ratzov, Jean-Noel Proust, A. Dano, et al.. A honeycomb seafloor morphology in carbonate sediment of the Carnegie Ridge (offshore Ecuador): Formation and po-tential geodynamic significance. Geology, Geological Society of America, 2018, 46 (11), pp.979-982. �10.1130/G45285.1�. �hal-01946123�
A honeycomb seafloor morphology in carbonate sediment
1of the Carnegie Ridge (offshore Ecuador): Formation and
2potential geodynamic significance
3F. Michaud1,2*, J.Y. Collot1, G. Ratzov1, J.N. Proust3, A. Dano1, J.F. Lebrun4, M.J. 4
Hernández1,5,6, G. Loayza7, A. Khaoulani1, Y. Stoll1, H. Pouderoux3, and L. De Min4 5
1
Université Côte d’Azur, IRD (Institut de Recherche pour le Développement), Sorbonne
6
Université, CNRS (Centre National de la Recherche Scientifique), Observatoire de la
7
Côte d’Azur, GEOAZUR (laboratoire de Géoazur), 06560 Valbonne, France
8
2
Sorbonne Université, Faculté des Sciences et Ingénierie, F-75252 Paris, France
9
3
CNRS, OSUR (Observatoire des Sciences de l’Univers de Rennes), Géosciences 10
Rennes, Université de Rennes, 35042 Rennes, France
11
4
Université des Antilles et de la Guyane, Département de Géologie, Pointe à Pitre
12
97157, France
13
5
Sorbonne Université, Institut des Sciences de la Terre de Paris (ISTeP), Campus Pierre
14
et Marie Curie, 75252 Paris, France
15
6
Departamento de Geología, Escuela Politécnica Nacional, Quito, Ecuador
16
7
Escuela Superior Politécnica del Litoral, Guayaquil, Ecuador
17 18 *E-mail: micho@geoazur.unice.fr 19 20 ABSTRACT 21
Based on swath bathymetry, two-dimensional, high-resolution seismic reflection profiles, 22
and Ocean Drilling Program/Deep Sea Drilling Project (ODP/DSDP) data, we describe a 23
seafloor honeycomb pattern and propose a model for its formation in Pliocene–Miocene 24
carbonate deposited on the uneven oceanic basement of the Carnegie Ridge (offshore 25
Ecuador). Hydrothermal fluids derived from the basement aquifer fractured and dissolved 26
carbonate sediment, creating seafloor pits above basements highs. Fluids expelled along 27
polygonal faults may have assisted the nucleation of seafloor depressions. At the 28
Pliocene-Pleistocene boundary, strong bottom currents scoured previously damaged 29
sediments, enlarging the initial depressions and producing the seafloor honeycomb 30
pattern. This regional erosive episode was contemporaneous with the final closing of the 31
Isthmus of Panama and the clogging of the Ecuador Trench by the subduction of the 32
Carnegie Ridge, so that the honeycomb pattern may be viewed as a regional marker of 33
these two geodynamic events. 34
35
INTRODUCTION 36
Only a few cases of kilometer-scale honeycomb pattern (HP) on the seafloor have 37
been reported along continental margins and generally into siliceous or mudstone-38
dominated sediments. The main examples are (1) kilometer-scale seabed high-centered 39
polygons (Berndt et al., 2012) outlined by 20-m-deep, elongated pockmarks, formed by 40
sediment contraction related to fluid circulation along polygonal faults; and (2) polygonal 41
crests separating hectometer- to kilometer-scale, 60-m-deep depressions formed by long-42
term unstable bottom currents (Sun et al., 2017). Here, we used new multibeam data 43
collected during the 2012 ATACAMES cruise (RV L’Atalante) on the Carnegie Ridge 44
offshore Ecuador (http://campagnes.flotteoceanographique.fr/campagnes/12010010/; Fig. 45
1) to report, for the first time, a HP morphology in carbonate sediment. 46
The HP consists of a network of kilometer-scale, hectometer-deep, polygonal depressions 48
(Figs. 2 and 3). Based on a low-resolution bathymetric data set, the depressions were 49
initially reported as densely packed subcircular features (Michaud et al., 2005). The 50
ATACAMES high-resolution multibeam data and seismic profiles (72 tracks, 50–450 51
Hz) allow the nature of the polygonal depressions to be investigated. We present a 52
coherent model for their formation in relation to sedimentation, fluid circulation, and 53
large-scale seafloor erosion. Additionally, we discuss the timing, the origin, and the 54
widespread distribution of the HP in relation to the closing of the Isthmus of Panama and 55
subduction of the Carnegie Ridge. 56
57
CARNEGIE RIDGE FRAMEWORK 58
The interplay of the Galapagos hotspot with the Cocos-Nazca spreading center led 59
to the formation of the Cocos, Malpelo, and Carnegie Ridges (Fig. 1A; Lonsdale and 60
Klitgord, 1978). Deep Sea Drilling Project (DSDP) Site 157 (van Andel et al., 1973), and 61
Ocean Drilling Program (ODP) Sites 1238 and 1239 (Fig. 1B; Mix et al., 2003) reveal a 62
400–500-m-thick Miocene to Pleistocene carbonate sediment cover over the oceanic 63
basement. Two lithologic units were defined at Sites 157 and 1238, an upper unit, 64
consisting of ~300 m of oozes and chalk, and a lower unit, composed of ~100 m of 65
lithified interbedded chalk and chert horizons (Fig. DR1 in the GSA Data Repository1). 66
Subcircular depressions fields are present on the Carnegie, Cocos, and Malpelo Ridges 67
(Fig. 1A), and they have been globally attributed to regional submarine carbonate 68
dissolution processes enhanced by bottom currents (Lonsdale and Fornari, 1980). 69
71
DEPRESSION GEOMETRIES 72
The seafloor depressions of the HP area are typically 0.8–2.0 km wide, separated 73
by 100–250 m high, dominantly linear ridges (supplemental information Table 1) (Fig.2, 74
3, and Fig.S2). The ridges give the depressions their polygonal and, by places, hexagonal 75
shape, and enclose sub-circular depression bottoms (Fig.3). Most polygonal depressions 76
lay in 2100-2800 m of water depth together with isolated, sub-circular to ovoid, larger 77
depressions (3-4 km-wide and 400 m-deep) (Fig.2); the largest being located deeper than 78
2500 m. 79
80
ACOUSTIC BASEMENT AND FEATURES OF SEDIMENTARY COVER UNITS 81
Acoustic Basement 82
The acoustic basement is marked by a set of strong and chaotic reflections (Fig. 4) 83
overlain by a thinly laminated sedimentary cover 0.4–0.8 s two-way traveltime (TWTT) 84
in thickness. The basement shows a remarkable step that is 0.8 s TWTT high and trends 85
east-west in map view (Figs. 2 and 4). South of the step, the acoustic basement is smooth 86
and lies at a 4.3–4.5 s TWTT in depth; the sediment is 0.8 s TWTT thick, locally carved 87
by isolated depressions and moats (Fig. 2). North of the step, the acoustic basement is 88
shallower and locally crops out at the seafloor (stars on Fig. 4B). When probed by 89
seismic data (Fig. 2), the depressions were observed to have preferentially (73%) 90
developed where the acoustic basement is rough (Table DR1). However, where the 91
acoustic basement is smooth, some lows filled with sediment represent channel-fill 92
structures (Fig. 4A, profile ATAC129, zoom1). In the sedimentary cover, we 93
differentiated a lower unit, u1, from an upper unit, u2 (Fig. 4), separated by a major 94 erosional unconformity. 95 Lower Unit u1 96
The lower unit u1 (Fig. 4A) returns subparallel continuous reflectors. Unit u1 97
extends over the entire region, including the acoustic basement step, but it is absent in 98
some depressions. The base of u1 locally shows a thin transparent or poorly reflective 99
layer (Fig. 4A, profile ATAC129, zoom1). South of the basement step, u1 is 0.6 s TWTT 100
thick. There, the poorly reflective lower half of u1 is bounded at the top by a dome-101
shaped reflector crossing the original subparallel reflectors (Fig. 4A, Common Depth 102
Point [CDP] 5000–7000; Fig. DR3, profile ATAC131 CDP 1000– 2500). This dome-103
shaped reflector suggests that a diagenetic front rose in the sediment cover crossing the 104
original strata. To the north of the step, the thickness of u1 varies from 0 to 0.6 s TWTT 105
further north along profile ATAC126 (Fig. 4B). An undulating geometry showing locally 106
internal cutand- fill structures characterizes the unit above the rough basement area (Fig. 107
4B, zoom2 and zoom3; Fig. 4A, profile ATAC130, CDP 2000–4000), suggesting a 108
sediment drift pattern (Faug.res et al., 1999). 109
The major unconformity truncates u1 in the buried depressions (Fig. 4A, ATAC129, CDP 110
1000–3000, zoom1; Fig. 4B, zoom2), and at the walls of most of the seafloor depressions 111
(Fig. 4A, CDP 3600–4000, zoom2; Fig. 4B, CDP 15800–16500). In cross section, this 112
erosional surface outlines the triangular shape of the ridges between the polygonal 113
depressions carved into u1 (Fig. 4B, zoom2 and zoom3). 114
Normal faults with 5- to 20-m-scale vertical offsets (red arrows in Figs. 4A and 4B, 115
zoom1 and zoom4) deform u1. Most of them show characteristics of polygonal faults 116
(Gay et al., 2004) as they disappear upward and downward, do not end at a specific 117
horizon, show a low frequency in lateral distribution, and may link up in polygons in plan 118
view, as demonstrated in other parts of the world where three-dimensional (3-D) seismic 119
control is available (Cartwright et al., 2003). 120
Although time migration with a constant 1500 m/s velocity produced clear seismic 121
imaging, imperfect migration velocities led to poor seismic imaging, preventing local 122
geological interpretation. Indeed, only vertical acoustic anomalies associated with well-123
collapsed diffractions in u1 (Fig. 4A, zoom1 and zoom4) are interpreted as fluid-escape 124
pipes (Cartwright and Santamarina, 2015). 125
126
Upper Unit u2 127
The upper unit u2 is thinly stratified and discontinuous, and its thickness varies from 0 in 128
some depressions to 0.4 s TWTT south of the basement step. Although locally 129
concordant with u1 (Fig. 4A, CDP 5000–7000; Fig. 4B, CDP 2000–4000), unit u2 130
unconformably overlies (Fig. 4, zoom1, zoom2, and zoom3) the erosional topographies 131
carved in u1. Unit u2 shows internal discontinuities and undulating depositional patterns 132
pointing to sediment drift (Fig. 4A, zoom1) and exhibits complex migration and 133
aggradation geometries, especially in the rough acoustic basement areas (Fig. 4B, zoom2, 134
3; Fig. DR3, ATAC128 CDP 7000–8500, ATAC131 CDP 5000–7500). These geometries 135
resemble contourite drifts produced by the interaction between oceanic bottom currents 136
and the seafloor topography. 137
138
DISCUSSION 139
Origin of The Honeycomb Seafloor Morphology 140
A similar kilometer-scale, seafloor HP was previously interpreted to originate from 141
smaller counterparts developed in underlying sedimentary units as a result of a sediment 142
drift depositional pattern (Sun et al., 2017). This pattern is characterized by wave-like 143
geometries corresponding to cut-and-fill erosional features with honeycomb planforms. It 144
was attributed to the action of unsteady bottom currents initiated in the late Miocene in 145
the South China Sea. In our study area, without 3-D seismic data, the HP seafloor cannot 146
be demonstrated to mimic buried honeycomb structures. Nevertheless, this hypothesis is 147
not ruled out, as unit u1 exhibits wave-like geometry where the acoustic basement is 148
rough (zoom2, and basement step along profile ATAC130 in Fig. 4), and depression 3 149
(Fig. 4B) shows that unit u2 sediment drift filled up a polygonal depression carved in u1, 150
reproducing the underlying honeycomb pattern. Many polygonal depressions (Fig. 3A) 151
carved into u1 (Fig. 4B, zoom2 and zoom3) are, however, deeper (~200–300 m) than 152
those (~60 m) described by Sun et al. (2017), suggesting that other important processes 153
are involved. 154
Polygonal faults generally form in mud-rich sediment (Cartwright et al., 2003) by 155
dewatering and, among other processes (Goulty, 2008), by differential compaction of the 156
host sediment (Berndt et al., 2012) related, to either sediment thickness variations 157
(zoom4, Fig. 4; Mayer, 1981) or silica diagenesis (Davies and Ireland, 2011). On the 158
Carnegie Ridge, in the areas where we interpret a diagenetic front (Fig. 4A, CDP 4800– 159
5500; Fig. DR3, ATAC131, CDP 2000–2500), u1 reflectors and the seafloor draw an 160
elongated depression controlled by normal faults, likely relating to diagenesis conversion. 161
Indeed, according to DSDP Leg 16 and ODP Leg 202, the sedimentary cover of the 162
Carnegie and Cocos Ridges is dominantly composed of carbonate, but the sediment close 163
to the basement reveals chert and micrite, indicating significant opal and carbonate 164
diagenesis (Mix et al., 2003; Moore, 2008). Consequently, a polygonal fault network is 165
expected in the studied HP area. According to Gay et al. (2004), furrows are initially 166
produced at the seafloor along polygonal faults, with pockmarks developing above high-167
drainage chimneys at the triple junction of three adjacent hexagonal cells (Figs. 5A and 168
5C). In a carbonate environment, Moore et al. (2007) showed that hydrothermal 169
discharge contributes to sediment fracture and damage, creating pits over oceanic 170
basement highs (Figs. 5B and 5D). Based on a mass balance analysis, Bekins et al. (2007) 171
indicated that the formation of pits in the equatorial Pacific could have been enhanced by 172
dissolution of carbonate sediment by fluids undersaturated with calcite exiting basement 173
vents. Fluids are therefore considered as a key factor in the initiation of seafloor 174
depressions on the Carnegie Ridge. 175
Subsequently, the pockmarks and pits were enlarged and deepened in response to the 176
action of strong bottom currents (Sun et al., 2011), shaping the regional unconformity 177
between u1 and u2 (Lonsdale and Malfait, 1974). The currents preferentially removed 178
sediments weakened by fracturing and fluid circulation, scouring depressions down to the 179
indurated base of u1, or to the top of the oceanic basement (Fig. 5E). In the pit case, the 180
currents action allowed the pit to grow radially, leaving at the end a polygonal depression 181
pattern. In the pockmark case, the impact of current scouring is uneven, because it is 182
controlled by the current direction with respect to the orientation of the hexagonal cell 183
pattern. Indeed, triple junctions of adjacent cells offer both convergent and divergent 184
(Fig. 5A) geometries for current action. The current is funneled and accelerated by the 185
convergent geometry, so that erosion is locally enhanced, initiating subcircular 186
depressions at every other triple junction. This process allows the pockmarks to grow in 187
diameter, leaving at the end an HP that is offset laterally by a half-hexagonal cell with 188
respect to the initial polygonal fault network. Many depressions show elongated or free 189
shapes locally crossed by minor ridges (Fig. 3B) due to irregular basement topography, 190
and partial or full erosion of some interdepression ridges. At the end, u2 sediment drift is 191
plastered against the wall of some polygonal depressions carved in u1 (Fig. 5F). 192
193
Possible Regional Cause for the Scouring of the HP 194
Seismic records collected near DSDP Site 157 (Fig. 1B; Heath and van Andel, 1973; van 195
Andel et al., 1973) show several unconformities in the upper 110–125 m of Pleistocene 196
sediment. DSDP Site 157 drilled u2 immediately west of our study zone (Fig. 1B) and 197
recovered 116 m of Pleistocene sediment above the Pliocene sequence (Fig. DR1). On 198
profile ATAC126, u2 is ~80 m thick (Fig. 4B, CDP 2000–4500) and could then include 199
the entire Pleistocene sequence drilled at DSDP Site 157. Consequently, the highly 200
erosive episode that we associate with new current conditions is likely to have started at 201
the transition between Pliocene and Pleistocene times. 202
At a regional scale, DSDP Site 158 (Fig. 1A), drilled on the Cocos Ridge, revealed a 203
shallow hiatus covering most of the late Pliocene (Heath and van Andel, 1973). Further 204
northeast along the Cocos Ridge, ODP Site 1242 (Fig. 1A) shows a major unconformity 205
(Mix et al., 2003) and a hiatus that encompasses the interval from 13 to 2.5 Ma. On the 206
Malpelo Ridge, kilometer- scale erosional depressions were initiated during the mid-207
Pliocene (Lonsdale and Fornari, 1980). If the origin and the age of the depression fields 208
on the Carnegie, Cocos, and Malpelo Ridges are identical to those proposed in this study, 209
the erosive episode appears to be of regional extent. 210
Major changes in the configuration of ocean gateway and related deep currents are 211
triggered by geodynamic events (Moore et al., 2004). The formation of the Isthmus of 212
Panama stands as one of the greatest geological events driving profound transformations 213
in ocean circulation. The collision of the Carnegie Ridge with the South American 214
margin clogged the subduction trench, contributing, together with the gradually emerging 215
land of Panama, to the enclosure of the Panama Basin, and to the change in the regional 216
bottom current configuration (Lonsdale and Fornari, 1980). 217
In a review, O’Dea et al. (2016) dated the emergence of the Isthmus of Panama at 2.8 218
Ma, close to the inferred age for the beginning of the current- driven, erosive regional 219
episode observed on the Carnegie Ridge that carved and partially filled the honeycomb 220
polygonal depression network. 221
In conclusion, polygonal faults, which are globally scarce in the studied carbonate ooze 222
environment, were not clearly imaged in the HP area, possibly because they disappeared 223
during the scouring process, as suggested in our model. In contrast, seafloor polygonal 224
depressions statistically correlate with the rough basement topography. Hydrothermal 225
fluid circulation and dissolution affecting the carbonate sediment overlying the rough 226
oceanic basement provide support for the pit origin of the depressions. Strong bottom 227
currents acting at the Pliocene-Pleistocene boundary, possibly as a result of the closure of 228
the Isthmus of Panama, were instrumental in scouring the polygonal depressions. 229
230 231
ACKNOWLEDGMENTS 232
We thank the crew of R/V L’Atalante and GENAVIR. This work was supported by 233
Institut National des Sciences de l’Univers (INSU) du Centre National de la Recherche 234
Scientifique (CNRS). Thanks to Institut de la Recherche et du Développement (IRD), to 235
Instituto Oceanográfico de la Armada (INOCAR) and Ministry of Higher Education, 236
Science, Technology and Innovation of Ecuador (SENESCYT). 237
238
REFERENCES CITED 239
Bekins, B.A., Spivack, A.J., Davis, E.E., and Mayer, L.A., 2007, Dissolution of biogenic 240
ooze over basement edifices in the equatorial Pacific with implications for 241
hydrothermal ventilation of the oceanic crust: Geology, v. 35, p. 679–682, 242
https://doi.org/10.1130/G23797A.1. 243
Berndt, C., Jacobs, C., Evans, A., Gay, A., Elliott, G., Long, D., and Hitchen, K., 2012, 244
Kilometre-scale polygonal seabed depressions in the Hatton Basin, NE Atlantic 245
Ocean: Constraints on the origin of polygonal faulting: Marine Geology, v. 332–334, 246
p. 126–133, https://doi.org/10.1016/j.margeo.2012.09.013. 247
Cartwright, J.A., and Santamarina, C., 2015, Seismic characteristics of fluid escape pipes 248
in sedimentary basins: Implications for pipe genesis: Marine and Petroleum Geology, 249
v. 65, p. 126–140, https://doi.org/10.1016/j.marpetgeo.2015.03.023. 250
Cartwright, J.A., James, D., and Bolton, A., 2003, The genesis of polygonal fault 251
systems: A review, in Van Rensbergen, P., et al., eds., Subsurface Sediment 252
Mobilization: Geological Society London Special Publication 216, p. 223–243, 253
https://doi.org/10.1144/GSL.SP.2003.216.01.15. 254
Davies, R.J., and Ireland, M.T., 2011, Initiation and propagation of polygonal fault arrays 255
by thermally triggered volume reduction reactions in siliceous sediment: Marine 256
Geology, v. 289, p. 150–158, https://doi.org/10.1016/j.margeo.2011.05.005. 257
Faugères, J.C., Stow, D.A.V., Imbert, P., and Viana, A., 1999, Seismic features 258
diagnostic of contourite drifts: Marine Geology, v. 162, p. 1–38, 259
https://doi.org/10.1016/S0025-3227(99)00068-7. 260
Gay, A., Lopez, M., Cochonat, P., and Sermondadaz, G., 2004, G. Polygonal faults 261
furrows system related to early stages of compaction Upper Miocene to recent 262
sediments of the Lower Congo Basin: Basin Research, v. 16, p. 101–116, 263
https://doi.org/10.1111/j.1365-2117.2003.00224.x. 264
Goulty, N. R., 2008, Geomechanics of polygonal fault systems: a review: Petroleum 265
Geoscience, 14, p. 389-397. 266
Heath, G.R., and van Andel, T.H., 1973, Tectonics and sedimentation in the Panama 267
basin: Geological results of Leg 16, in van Andel, T.H., and Heath, G.R., eds., Initial 268
Reports of the Deep Sea Drilling Project, Volume 16: Washington, D.C., U.S. 269
Government Printing Office, p. 899–913. 270
Lonsdale, P., and Fornari, D., 1980, Submarine Geology of the Malpelo Ridge, Panama 271
Basin: Marine Geology, v. 36, p. 65–83, https://doi.org/10.1016/0025-272
3227(80)90041-9. 273
Lonsdale, P., and Klitgord, K.D., 1978, Structure and tectonic history of the eastern 274
Panama Basin: Geological Society of America Bulletin, v. 89, p. 981–999, 275
https://doi.org/10.1130/0016-7606(1978)89<981:SATHOT>2.0.CO;2. 276
Lonsdale, P., and Malfait, B.T., 1974, Abyssal dunes of foraminiferal sand on the 277
Carnegie Ridge: Geological Society of America Bulletin, v. 85, p. 1697–1712, 278
https://doi.org/10.1130/0016-7606(1974)85<1697:ADOFSO>2.0.CO;2. 279
Mayer, L., 1981, Erosional troughs in deep-sea carbonates and their relationship to 280
basement structure: Marine Geology, v. 39, p. 59–80, https://doi.org/10.1016/0025-281
3227(81)90028-1. 282
Michaud, F., Chabert, A., Collot, J.Y., Sallarès, V., Flueh, E.R., Charvis, P., Graindorge, 283
D., Gustcher, M.A., and Bialas, J., 2005, Fields of multi-kilometer scale sub-circular 284
depressions in the Carnegie ridge sedimentary blanket: effect of underwater 285
carbonate dissolution?: Marine Geology, v. 216, p. 205–219, 286
https://doi.org/10.1016/j.margeo.2005.01.003. 287
Mix, A.C., Tiedemann, R., Blum, P., et al., 2003, Proceedings of the Ocean Drilling 288
Program Initial Reports, 202: College Station, Texas, Ocean Drilling Program, 145 289
p., doi:10.2973/odp.proc.ir.202.2003. 290
Moore, T.C., 2008, Chert in the Pacific: Biogenic silica and hydrothermal circulation: 291
Palaeogeography, Palaeoclimatology, Palaeoecology, v. 261, p. 87–99, 292
https://doi.org/10.1016/j.palaeo.2008.01.009. 293
Moore, T.C., Backman, J., Raffi, I., Nigrini, C., Sanfilippo, A., Pälike, H., and Lyle, M., 294
2004, Paleogene tropical Pacific: Clues to circulation, productivity, and plate motion: 295
Paleoceanography, v. 19, p. 1–16, https://doi.org/10.1029/2003PA000998. 296
Moore, T.C., Mitchell, J.N.C., Lyle, M., Backman, J., and Pälike, H., 2007, 297
Hydrothermal pits in the biogenic sediments of the equatorial Pacific Ocean: 298
Geochemistry Geophysics Geosystems, v. 8, p. 1–14, 299
https://doi.org/10.1029/2006GC001501. 300
O’Dea, A., et al., 2016, Formation of the Isthmus of Panama: Science Advances, v. 2, 301
p. 1–11. 302
Sun, Q., Wu, S., Hovland, M., Luo, P., Lu, Y., and Qu, T., 2011, The morphologies and 303
genesis of mega-pockmarks near the Xisha Uplift, South China Sea: Marine and 304
Petroleum Geology, v. 28, p. 1146–1156,
305
https://doi.org/10.1016/j.marpetgeo.2011.03.003. 306
Sun, Q., Cartwright, J., Lüdmann, T., Wu, S., and Yao, G., 2017, Three-dimensional 307
seismic characterization of a complex sediment drift in the South China Sea: 308
Evidence for unsteady flow regime: Sedimentology, v. 64, p. 832–853, 309
https://doi.org/10.1111/sed.12330. 310
van Andel, T.H., et al., 1973, Deep Sea Drilling Project Site 157, Initial Reports of the 311
Deep Sea Drilling Project, Volume 16: Washington, D.C., U.S. Government Printing 312 Office, p. 53–150. 313 314 FIGURE CAPTIONS 315
Figure 1. A: Geodynamic setting (CNS—Cocos–Nazca spreading center; HS—hotspot). 316
B: Map of Carnegie Ridge (grid size = 150 m); conventional bathymetry is in pale color; 317
multibeam is dark color. Black dotted lines are areas where dense depressions fields have 318
been identified. Thin black lines show ATACAMES cruise (http://campagnes 319
.flotteoceanographique .fr /campagnes /12010010/) tracks, along which high-resolution 320
multibeam data allow us to recognize polygonal depressions fields (stars). 321
322
Figure 2. Map of studied area (same color scale as that in Fig. 1B). In pale and dark 323
colors, respectively, multibeam data before (grid size = 150 m) and after (grid size = 50 324
m) the ATACAMES cruise (http://campagnes.flotteoceanographique.fr/campagnes 325
/12010010/). Isocontours = 25 m. Thick black lines show locations of seismic lines on 326
Figure 4. S—large seamounts. White dotted line shows location of acoustic basement 327
step; white boxes are locations of Figure 3. 328
329
Figure 3. A–B: Close-ups (zooms) of depressions field (locations in Fig. 2). Red line 330
shows location of seismic profile ATAC124; white line shows location of seismic zoom2 331
in Figure 4B. 332
333
Figure 4. Seismic profiles (see location in Fig. 2). A: Profiles ATAC130–129 showing 334
two regional seismic units, u1 and u2. B: Profiles ATAC124–126 crossing depression 335
field. Dotted blue line is real seafloor depth. Side echoes can appear above seafloor. Red 336
rectangles are locations of close-ups (zooms); u1—lower unit (u1a—poorly reflective; 337
u1b—subparallel continuous reflectors); u2—upper unit; VE—vertical exaggeration; 338
CDP—common depth point. 339
340
Figure 5. Diagram showing two scenarios for origin of honeycomb pattern (HP). A: 341
Polygonal fault network. B: Pits over basement irregularities at initiation of depressions. 342
Red circles show final stage of depressions. Red dotted arrows along polygonal faults in 343
A show bottom current channeled by seafloor furrows formed along fault planes, offering 344
a convergent (c) and divergent (d) geometry every other triple junction. C–F: Successive 345
stages of evolution of HP along cross section X-Y; df—diagenetic front. Pockmarks (C) 346
and pits (D) formed at seafloor evolve toward larger and deeper subcircular depressions 347
(E) in response to scouring action of strong bottom currents on fluid-damaged sediment; 348
this stage initiated at the Pliocene-Pleistocene boundary, contemporaneous with closure 349
of the Panama Basin, leaving a honeycomb pattern of interdepression ridges. (F) Last, u2 350
sediment drift is plastered against the wall of some depressions carved in u1. 351
352
353
FIGURE 1 354
355
FIGURE 2 356
357
FIGURE 3 358
FIGURE 4 359
360 361 FIGURE 5 362 363 364 365
366 367
1
GSA Data Repository item 2018392, Table DR1 (correlation with basement 368
irregularities and the morphological parameters of depressions along the seismic 369
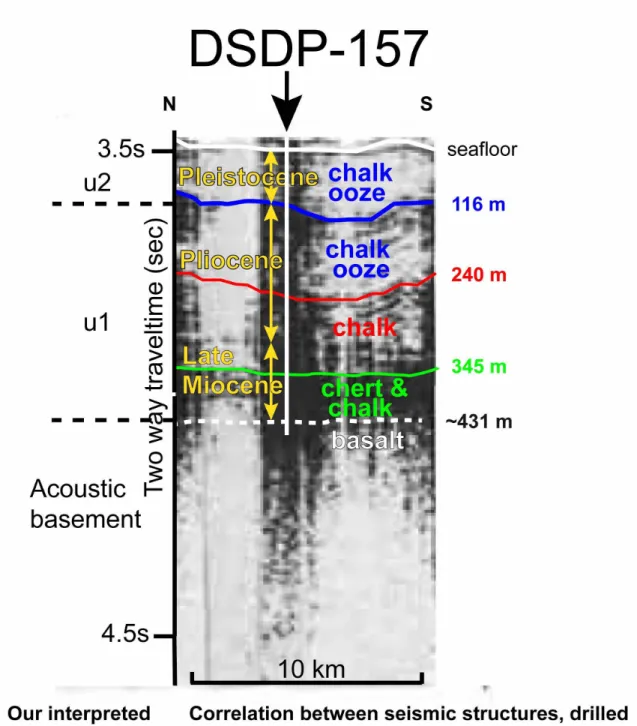
profiles), Figure DR1 (correlation between seismic structures, drilled lithologies and ages 370
from DSDP 157), Figure DR2 (swath bathymetry along the southern flank of the 371
Carnegie Ridge), and Figure DR3 (interpretation of the available ATACAMES cruise 372
seismic profiles), is available online at http://www.geosociety .org /datarepository /2018/ 373
or on request from editing@geosociety.org 374
375 376
GSA Data Repository 2018392 377
378
A honeycomb seafloor morphology in carbonate sediment of the
379Carnegie Ridge (offshore Ecuador): Formation and potential
380geodynamic significance
381382
F. Michaud1,2*, J.Y. Collot1, G. Ratzov1, J.N. Proust3, A. Dano1, J.F. Lebrun4, M.J.
383
4 Hernández1,5,6, G. Loayza7, A. Khaoulani1, Y. Stoll1, H. Pouderoux3, and L. De
384
Min4
385 386
1
Université Côte d’Azur, IRD (Institut de Recherche pour le Développement), Sorbonne
387
Université, CNRS (Centre National de la Recherche Scientifique), Observatoire de la
388
Côte d’Azur, GEOAZUR (laboratoire de Géoazur), 06560 Valbonne, France
389
2 Sorbonne Université, Faculté des Sciences et Ingénierie, F-75252 Paris, France
390
3
CNRS, OSUR (Observatoire des Sciences de l’Univers de Rennes), Géosciences 391
Rennes, Université de Rennes, 35042 Rennes, France
392
4 Université des Antilles et de la Guyane, Département de Géologie, Pointe à Pitre 97157,
393
France
394
5
Sorbonne Université, Institut des Sciences de la Terre de Paris (ISTeP), Campus Pierre
395
et Marie Curie, 75252 Paris, France
396
6
Departamento de Geología, Escuela Politécnica Nacional, Quito, Ecuador
397
7
Escuela Superior Politécnica del Litoral, Guayaquil, Ecuador
398 399 400 *e-mail: michaud@geoazur.unice.fr 401 402
404 supplemental information 405 406 Table of contents 407 408
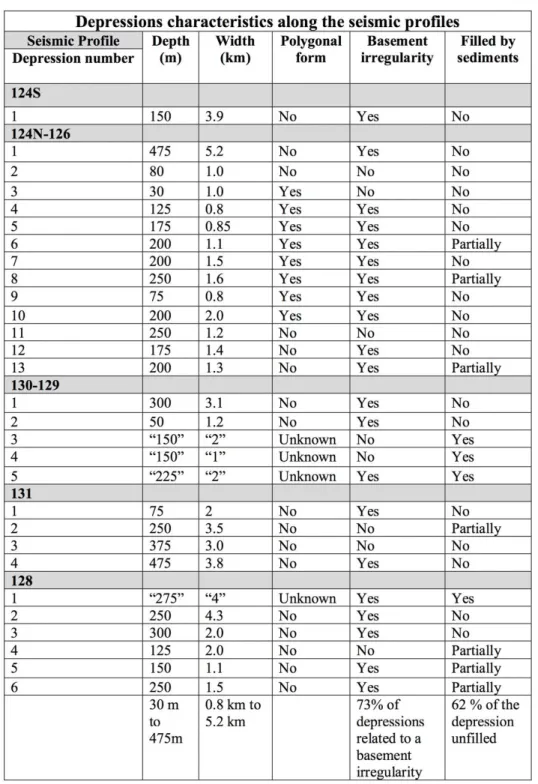
Table DR1: Depressions characteristics along the seismic profiles.
409 410
Figure DR1: Correlation between our seismic units (u1, u2, acoustic basement) with a seismic
411
line, drilled lithology and age from the DSDP 157 (from van Andel et al., 1973).
412 413
Figure DR2: A) Bathymetric map southeast of the studied area along the southern flank of the
414
Carnegie ridge where high resolution multibeam were recorded during the Atacames cruise B) 3D
415
zoom of the high resolution multibeam, showing honeycomb pattern around the seamounts
416 417
Figure DR3: Interpretation of the available seismic profiles (ATAC 131, ATAC 128, ATAC 127
418
and ATAC 124S, location on Figure 2) in the study area in addition to the seismic profiles of
419 Figure 4. 420 421 422 423 424
425
Table DR1: Depressions characteristics along the seismic profiles. The numbers correspond to the
426
depressions along the seismic profiles and located on Figure 2,3, 4 and S1). Semi-quantitative
427
estimation based on all seismic lines crossing the depressions that we have acquired in the area
428
(figure 2 for line location). Some statistic is done about 1) the link between the basement
429
roughness and the depression location (73% of depressions are related to a basement irregularity);
430
and 2) about the sedimentary filling (38% of the depression are filled by u2 sedimentary unit.
433
434
Figure DR1: Correlation between our seismic units (u1, u2, acoustic basement) with a seismic
435
line, drilled lithology and age from the DSDP 157 (from Van Andel et al., 1973).
436 437 438
439 440
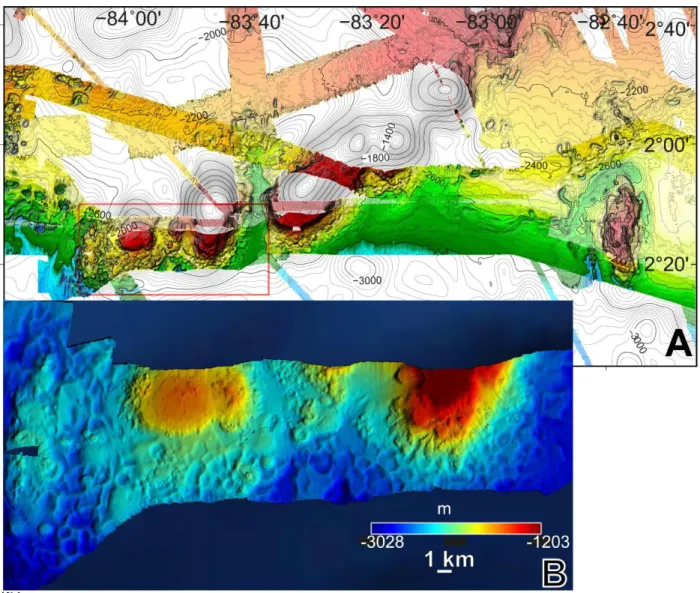
Figure DR2: A) Bathymetric map southeast of the studied area along the southern flank of the
441
Carnegie ridge where high resolution multibeam were recorded during the Atacames cruise (same
442
color scale as that in Fig. 1B and 2). In pale color the multibeam before the Atacames cruise (grid
443
size 150m). In dark shade, multibeam from the Atacames cruise (grid size 50m). Iso
444
contours=25m. B) 3D zoom high resolution multibeam showing honeycomb pattern around the
445
seamounts (location in Fig S2 A). Vertical exaggeration x3. Northward vertical view.
446 447 448
Figure DR3: Interpretation of the available seismic profiles (ATAC 131, ATAC 128, ATAC 127
450
and ATAC 124S, location on Figure 2) in the study area in addition to the seismic profiles of
451
Figure 4. With this additional figure, all available seismic lines are shown. Short dotted black
452
line=acoustic basement; large dotted black line=unconformity between lower and upper seismic
453
units; blue arrows=inferred upper limit of diagenesis and lithification; red rectangle=location of
454
the zooms; u1=lower unit (u1a=poorly reflective; u1b = sub parallel continuous reflectors);
455
u2=upper unit. Se = Side echo related to possible irregularities of the basement. Numbers
456
correspond to the depressions considered in the table 1. Dotted blue line = seafloor depth EM122
457
vertical beam allows to discriminate side echoes figured above the seafloor.
458 459