HAL Id: hal-00843361
https://hal-imt.archives-ouvertes.fr/hal-00843361
Submitted on 11 Jul 2013HAL is a multi-disciplinary open access archive for the deposit and dissemination of sci-entific research documents, whether they are pub-lished or not. The documents may come from teaching and research institutions in France or abroad, or from public or private research centers.
L’archive ouverte pluridisciplinaire HAL, est destinée au dépôt et à la diffusion de documents scientifiques de niveau recherche, publiés ou non, émanant des établissements d’enseignement et de recherche français ou étrangers, des laboratoires publics ou privés.
Breast characterstics and dosimetric data in Xray
mammography - a large sample survey
N. Geeraert, R. Klaus, S. Muller, Isabelle Bloch, H. Bosmans
To cite this version:
N. Geeraert, R. Klaus, S. Muller, Isabelle Bloch, H. Bosmans. Breast characterstics and dosimetric data in Xray mammography - a large sample survey. International Conference on Radiation Protection in Medicine - Setting the Scene for the Next Decade, Dec 2012, Bonn, Germany. pp.15. �hal-00843361�
MAMMOGRAPHY - A LARGE SAMPLE WORLDWIDE SURVEY N. GEERAERTa,b,c, R. KLAUSZa, S. MULLERa, I. BLOCHc, H. BOSMANSb a
GE Healthcare, Buc, France b
Department of Radiology, KU Leuven, Leuven, Belgium c
Telecom ParisTech, CNRS LTCI, Paris, France
Email address of main author: [email protected]
Abstract
Average Glandular Dose (AGD) is the quantity generally accepted for dose monitoring of X ray mammographic examinations. A survey of breast characteristics (compressed breast thickness, peak breast density) and AGD values was carried out on a database describing the acquisition conditions of 147,487 routine mammographic images acquired in Europe, North America and Asia-Pacific on GE Healthcare Senographe DS and Essential mammographic equipment. These systems compute the breast density in the densest part of the image and the related AGD using normalized glandular dose values interpolated from published tables. The correlation between peak breast density and compressed breast thickness was determined for the different geographical zones, as well as the distributions of the AGD. Breasts in Asia-Pacific were on average significantly thinner and denser than in Europe and North America. Breasts in North America were on average significantly thicker and denser than in Europe. The average AGD per image was 1.42mGy in North America and Asia-Pacific, and 1.48mGy in Europe. We computed the difference in AGD values between an individual density correction factor based on the peak breast density and a population-averaged density correction factor, as routinely used for dosimetry surveys in Europe. The resulting collective AGD values derived from the two distributions were similar (difference <5%), while the individual AGD values differed by up to 30%. Breast dosimetry can be improved by replacing the population-averaged breast density by the individual volumetric breast density.
1. INTRODUCTION
In many countries, large-scale breast X ray imaging is used for early detection of breast cancers and for diagnostic purposes. The limited exposure to X rays must allow a good image quality and produce mammographic images with high sensitivity and specificity for the detection and characterization of suspicious lesions. It is generally accepted that risk or detriment from mammographic examinations can be limited to the effects of the exposure to the breast. Based on the assumption that only the glandular cells are radiosensitive, the Average Glandular Dose (AGD) has been defined to quantify the risk from breast irradiation and has been widely accepted for regulations (e.g. MSQA [1]) and guidelines (e.g. European Guidelines [2]).
Since the introduction of digital mammography systems it is easier to acquire and collect automatically large amounts of data worldwide. In this paper we study for different geographical regions the distribution of the peak breast density as a function of the compressed breast thickness, as well as the distribution of the doses.
2. MATERIAL AND METHODS
2.1. Methods to compute AGD
The two most often used methods to calculate the AGD are based on Monte Carlo simulations [3, 4]. The breast is modeled by a semicircular phantom with a homogeneous content and surrounded by a layer of skin-representing tissue. The attenuation coefficient of the content corresponds to the breast density, the ratio of the amount of gland to total breast. The methods compute the AGD as the
GEERAERT,KLAUSZ,MULLER,BLOCH AND BOSMANS
2
dose’. Wu et al. [3, 5] compute values of this normalized dose (DgN) as a function of relevant parameters (spectrum, breast thickness and breast density). Dance et al. [4, 6] factorize the normalized dose in three factors, a conversion factor for a 50% density breast with a Mo/Mo anode/filter combination, one for the spectral differences related to the anode/filter combinations, and one for the breast density. In their model the density correction factor can be calculated for the nominal breast density or it can be retrieved from population-averaged values of breast density as a function of compressed breast thickness and age. The latter approach is based on two UK film-screen mammography surveys [7, 8] (1545 women) where the density was computed from a manually positioned AEC sensor.
2.2. Collected data
We obtained the technical data from acquisitions on Senographe DS™ (FOV:19×23cm) and Essential™ (FOV: 24×31cm and 19×23cm) (GE Healthcare, Chalfont, UK). These GE mammographic systems have an automatic exposure control (automatic optimization of parameters, AOP). From a pre-exposure image the densest area of the breast is found and an attenuation-equivalent thickness is computed from a calibrated model. The density in this area (peak breast density) is computed as a function of equivalent and compressed breast thickness [9] and recorded in the DICOM-header. The system computes the AGD applying the method of Wu et al. [5] with the effective values of DgN interpolated from the published tables using the peak breast density.
The compressed breast thickness, the peak breast density and the AGD were collected from different geographical zones: Europe, North America and Asia-Pacific. Neither individual patient data, such as ID and age, nor the images were accessible. Only data acquired in contact mode with a full-format rigid paddle in CC (cranio-caudal) and MLO (medio-lateral oblique) angulations were retained. We computed the distributions of the breast densities as a function of the compressed breast thickness for the geographical zones and superimposed the population-averaged distributions synthesized earlier by Dance [6]. For each individual exposure we computed the difference between the AGD using the individual breast density and using the population-averaged density from Dance’s method [6]. Comparison of all characteristics was done with tailed t-tests.
3. RESULTS AND DISCUSSION
3.1 Population statistics
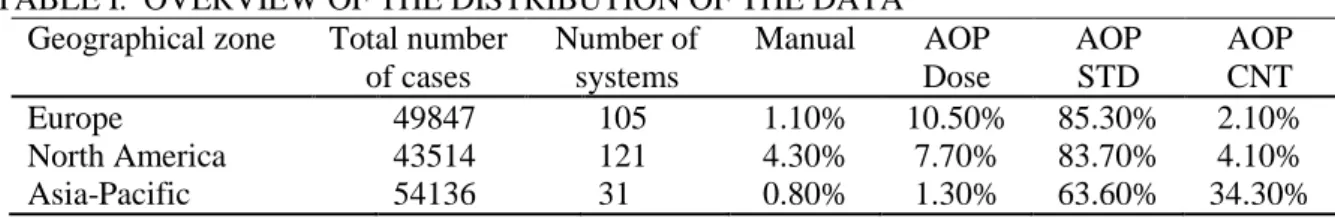
The number of cases retained and their distribution over different exposure modes are represented in Table 1. The different possible modes were Manual and three AOP modes (Dose, STD, CNT).
TABLE I. OVERVIEW OF THE DISTRIBUTION OF THE DATA Geographical zone Total number
of cases Number of systems Manual AOP Dose AOP STD AOP CNT Europe 49847 105 1.10% 10.50% 85.30% 2.10% North America 43514 121 4.30% 7.70% 83.70% 4.10% Asia-Pacific 54136 31 0.80% 1.30% 63.60% 34.30% 3.2 Breast characteristics
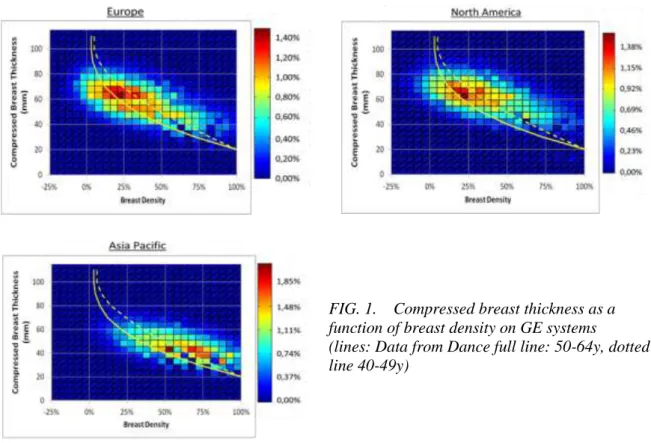
The histogram of compressed breast thickness as a function of peak density is shown in Figure 1 for the different geographical zones together with the distributions used by Dance [6] (dotted line: 40-49y, full line: 50-64y). Negative peak densities were due to errors on the compressed breast thickness, to which the density computation, used by the systems, is very sensitive [9].
ALARGESAMPLEWORLDWIDESURVEY
The Asia-Pacific population has significantly denser, thinner breasts (p<0.0000001) than the European and North-American populations. The North-American population has significantly denser (p=0.0005) and thicker (p<0.0000001) breasts than the European population.
FIG. 1. Compressed breast thickness as a function of breast density on GE systems (lines: Data from Dance full line: 50-64y, dotted line 40-49y)
The statistics on the differences in AGD are presented in Table 2. The average AGD over the population, computed with the peak breast density was slightly higher than when using the 40-49 year population-averaged correction factor (up to 4.4%) and slightly lower than when using the 50-64 year population-averaged correction factor (up to 4.8%). The difference in AGD was less than 10% for 68% of the exposures and less than respectively 23% and 30% for 99.7% of exposures.
TABLE II. THE DIFFERENCES BETWEEN THE AGD COMPUTATIONS USING DANCE WITH THE PEAK BREAST DENSITY AND THE POPULATION-AVERAGED DENSITY Geographical
zone
40-49 year 50-64 year
Average St dev +3 St dev Average St dev +3 St dev
Europe 4.4% 11.0% 31.9% -2.1% 10.2% 23.6%
North America 3.3% 11.4% 30.8% -3.0% 10.6% 23.6%
Asia-Pacific 1.1% 10.1% 26.6% -4.8% 9.7% 17.2%
3.3 Dosimetric data
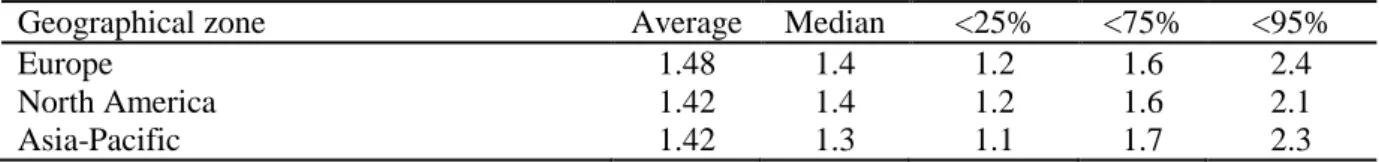
The distribution of the dose per image per zone computed from the system is presented in Figure 2 and statistics are presented in Table 3. The secondary peak around 2mGy on the dose distribution of Asia-Pacific can be explained by the higher proportion of exposures taken using the AOP CNT mode.
GEERAERT,KLAUSZ,MULLER,BLOCH AND BOSMANS
4
FIG. 2. AGD distributions for the different zones
TABLE III. STATISTICS FOR THE AGD DISTRIBUTIONS COMPUTED FROM THE GE SENOGRAPHE DS AND ESSENTIAL (in mGy)
Geographical zone Average Median <25% <75% <95%
Europe 1.48 1.4 1.2 1.6 2.4
North America 1.42 1.4 1.2 1.6 2.1
Asia-Pacific 1.42 1.3 1.1 1.7 2.3
5. CONCLUSION
The average AGD per image (CC and MLO) was between 1.4 and 1.5mGy for all geographical zones, almost 12% lower than the results from Hendrick et al. [10] for the GE Senographe 2000D. The average difference between the doses computed with the two density correction factors from Dance [6] was found negligible (<5%), making the population-averaged correction factor fully applicable for collective dose evaluation. However individual doses were up to 30% higher than the population-based predicted values. In both cases, breast density is estimated in a small area (AEC sensor), and further improvement towards patient specific dosimetry should come from a true estimation of volumetric breast density instead.
REFERENCES [1] US Code of Federal Regulations 21CFR900.12 (MQSA).
[2] EUROPEAN COMMISSION, European guidelines for quality assurance in breast cancer screening and diagnosis, Fourth edition, ISBN 92-79-01258-4, Office for Official Publications of the European Communities, Luxembourg (2006).
[3] WU, X., BARNES, G.T., TUCKER, D.M., Spectral dependence of glandular tissue dose in screen-film mammography, Radiology 179 (1991) 143-148.
[4] DANCE, D.R., Monte Carlo calculation of conversion factors for the estimation of mean glandular breast dose, Phys. Med. Biolog. 35 (1990) 1211-1219.
[5] WU, X., GINGOLD, E.L., BARNES, G.T., TUCKER, D.M., Normalized average glandular dose in molybdenum target-rhodium filter and rhodium target-rhodium filter mammography, Radiology 193 (1994) 83-89.
[6] DANCE, D.R., SKINNER, C.L., YOUNG, K.C., et al., Additional factors for the estimation of mean glandular breast dose using the UK mammography dosimetry protocol, Phys. Med. Biolog. 45 (2000) 3225-3240.
[7] YOUNG, K.C., RAMSDALE, M.L., BIGNELL, F., Review of dosimetric methods for mammography in the UK screening programme, Rad. Prot. Dosim. 80 (1998) 186-187.
[8] BECKETT, J.R., KOTRE, C.J., Dosimetric implications of age related glandular changes in screening mammography, Phys. Med. Biolog. 45 (2000) 801-813.
ALARGESAMPLEWORLDWIDESURVEY
[9] DESPONDS, L., KLAUSZ, R., Automatic estimation of breast composition with mammographic X-ray systems, in 80th Scientific Assembly and Annual Meeting, Radiological Society of North America, Nov. 27 -Dec. 2, 1994, Radiology, 193 P Suppl. (Nov. 1994).
[10] HENDRICK, R.E., PISANO, E.D., AVERBUKH, A., et al., Comparison of acquisition parameters and breast dose in digital mammography and screen-film mammography in the American College of Radiology Imaging Network Digital Mammographic Imaging Screening Trial, Am. J. Roentgen. 194 (2010) 362-369.