Collaboration in Design Optimization
by
Eunice Lin
B.S., Massachusetts Institute of Technology (2016)
Submitted to the Department of Electrical Engineering and Computer
Science
in partial fulfillment of the requirements for the degree of
Master of Engineering in Computer Science and Engineering
at the
MASSACHUSETTS INSTITUTE OF TECHNOLOGY
February 2017
c
Massachusetts Institute of Technology 2017. All rights reserved.
Author . . . .
Department of Electrical Engineering and Computer Science
February 3, 2017
Certified by . . . .
Professor Maria Yang
Director, MIT Ideation Lab
Associate Professor, Department of Mechanical Engineering
Thesis Supervisor
Accepted by . . . .
Professor Christopher Terman
Chairman, Masters of Engineering Thesis Committee
Collaboration in Design Optimization
by
Eunice Lin
Submitted to the Department of Electrical Engineering and Computer Science on February 3, 2017, in partial fulfillment of the
requirements for the degree of
Master of Engineering in Computer Science and Engineering
Abstract
Tacit is a software tool for designing and solving 2D truss structures. The Tacit web application expands these features to allow users to design truss structures with integrated analysis and optimization tools. Tacit was intended for single user inter-action, but much of engineering and design work is team-based and collaborative. To examine the effects of collaboration on design optimization problems, it is crucial for users to be able to easily share and view the structure designs of their teammate. This thesis presents a new version of Tacit with these collaboration features along with a new method for assessing the similarity of pairs of structures created by col-laborators, and the results and analysis of a user study conducted where participants collaborated on design optimization problems with these new functionalities. Results showed that collaboration and the collaborative software tools were both effective in improving performance. The new software functionalities improved the efficiency of collaboration but unintentionally reduced the amount of physical collaboration.
Thesis Supervisor: Professor Maria Yang Title: Director, MIT Ideation Lab
Acknowledgments
It has been a great experience working on this project, and it would not have been possible without the help of Professor Maria Yang, Edward Burnell, and MIT Ideation Lab.
Professor Maria Yang has been incredibly helpful throughout the process, from supporting my research interest in design, to helping me with the direction of this project. I am incredibly lucky to have such a kind and dedicated supervisor for my thesis.
I would like to thank Edward Burnell for all his previous work on Tacit, answering technical questions about the codebase, help with brainstorming ideas and running user studies for this phase of the project. I am always inspired and encouraged by his enthusiasm about the project. I would also like to thank all the other developers who have contributed to the software.
I would like to thank MIT Ideation Lab for supporting this project and partici-pating in the pilot study.
I would like to thank Professor Caitlin Mueller for her advice on the truss similarity algorithm.
I would like to thank all the MIT students who took time out of their busy schedules and participated in the user study.
Finally, I would like to thank my friends and family who have supported and believed in me throughout this journey.
Contents
1 Introduction 17
1.1 Motivation . . . 17
1.2 Goals . . . 18
1.3 Hypothesis . . . 18
1.3.1 Effect of Collaboration on Performance . . . 18
1.3.2 Design Tools for Collaboration . . . 18
1.3.3 Common Patterns in Collaboration . . . 19
1.4 Thesis Summary . . . 19
2 Literature Review 21 2.1 Collaboration in System Design . . . 21
2.2 Effects of Team Structure on Performance . . . 22
3 Tacit Background 23 3.1 Related Design Software . . . 23
3.2 Overview . . . 24 3.3 Data Models . . . 25 3.3.1 Structures . . . 25 3.3.2 Events . . . 25 3.3.3 Nodes . . . 25 3.3.4 Beams . . . 26 3.4 Features . . . 26
3.4.2 History . . . 27
3.4.3 Tools . . . 27
3.4.4 Undo, Redo, and Finish . . . 28
3.5 Initial Individual User Study Results . . . 28
4 Tacit Collaboration Features 31 4.1 Goals . . . 31
4.2 Database Design . . . 31
4.3 Live Preview and Score . . . 33
4.4 Load Teammate Designs . . . 33
4.5 Instant Messaging . . . 34
5 Experimental Design 35 5.1 Group 1: No Collaboration . . . 35
5.2 Group 2: Collaboration with Collaboration Software . . . 36
5.3 Group 3: Collaboration without Collaboration Software . . . 36
5.4 Compensation and Prize Structure . . . 37
5.5 Experimental Method . . . 37
6 Structure Similarity Algorithm 41 6.1 Motivation . . . 41
6.2 Specifications . . . 42
6.3 Algorithm Design . . . 42
6.3.1 Node Matching . . . 43
6.3.2 Beam Matching . . . 44
6.3.3 Additional Nodes and Beams . . . 45
6.4 Alternative Solutions . . . 48
7 User Study Results and Analysis 51 7.1 Effects of Collaboration on Performance . . . 51
7.1.3 Structural Diversity Analysis . . . 55
7.2 Design Tools for Collaboration . . . 59
7.3 Common Patterns in Collaboration . . . 61
8 Future Work 63 8.1 Tacit Software . . . 63 8.1.1 Concurrent Editing . . . 63 8.1.2 Communication Support . . . 63 8.2 Experimental Method . . . 64 8.2.1 Teammate Familiarity . . . 64
8.2.2 Increasing Problem Complexity and Time Limit . . . 64
8.2.3 Exploring Distributed vs. Co-Located Teams . . . 65
8.3 Structural Similarity Algorithm . . . 65
8.3.1 Mirrored Structures . . . 65
8.3.2 Multiple Beam Replacement . . . 65
9 Contributions and Conclusion 67 9.1 Contributions . . . 67
9.2 Conclusion . . . 68
List of Figures
3-1 This depicts the user’s workspace while designing a truss structure
us-ing the previous implementation of the optimized analysis tool of Tacit without the integrated collaboration features. This version supports only individual users. . . 24
3-2 The goal, current score, and time remaining displayed in the center of
the top panel. . . 26
3-3 Example of a user’s history of saved designs. . . 27
3-4 Tools selection panel for users to switch between the move, draw, and
erase tools. . . 27
3-5 Undo, redo, and finish button at the top right of the window. . . 28
3-6 User performance on the road sign problem and the bridge sign
prob-lem, using each tool. The colored line indicates the median and the black line indicates the threshold for additional reward. The darker section indicates the 25th to 75th percentile[2]. . . 29
4-1 Current implementation of Tacit with collaboration features as seen in
the panel at the bottom right of the window. . . 32
5-1 The road sign problem. The red arrows are the forces acting on the
road sign, the dotted brown line is an unsupported beam, and the blue
triangles are the supports where the forces should be grounded. . . . 36
6-1 Example structures components for calculating beam similarity metric. In this example, Structure Component 2 and 3 are both replacements of Structure Component 1. Structure Component 2 is an exact
replace-ment and Structure Component 3 is an inexact replacereplace-ment. . . 45
6-2 Example structures for calculating similarity metrics for additional
nodes and beams. . . 46
7-1 Cumulative distribution function that shows the comparison of the
performance of individual user scores on the road sign problem using the optimized tool. . . 52
7-2 Individual best scores versus the number of times users loaded their
teammate’s structure for users who used the collaboration software tool. The individual best score is the lowest cost for each individual user. . . 53
7-3 Team best scores versus the number of times teammates loaded each
other’s for teams who used the collaboration software tool. The team’s best score is the lower cost of two individual costs from each team member. The number of times users loaded a teammate’s structure is
the sum of the times each user loaded their partner’s structure. . . . 54
7-4 Survey responses from users on how the collaborative load tool changed
their approach to the problem. . . 55
7-5 Survey responses from users on which part of the collaborative features
was the most influential to their design approach. . . 56
7-6 Team best score vs. structural diversity. . . 56
7-7 Example of similarity metrics between teammates’ structures
through-out the problem for the teams with the cheapest structure (best score). 58
through-7-9 Survey results from users on how talking to their teammate changed their approach to the problem. . . 60
7-10 Survey results from users on how often they talked to their teammate. 60
7-11 Survey results from users on when they looked at their partner’s design. 62
List of Tables
6.1 Similarity metrics between example structures. . . 47
Chapter 1
Introduction
1.1
Motivation
Historically, the complexity of designs for products have been limited because of lim-itations in manufacturing technology. However, with the advancements in additive manufacturing in particular, we are now able to manufacture products of high com-plexity and are instead limited by current design and analysis tools[2]. Thus, it is important for software design tools to incorporate analysis and optimization features to help users fully optimize the design, though such tools currently were created for traditional manufacturing methods, not additive[2].
At the same time, collaboration is becoming ubiquitous in both education and in-dustry, as software technologies now allow us to collaborate and develop in distributed teams[4]. Though there have been studies conducted on the impact of types collab-oration and the effectiveness of software collabcollab-oration tools, an interesting area that has not been explored is the influences of collaboration on performance specifically in design optimization[4][6].
In this study, we examined the effects of collaboration through software tools for design optimization. Our approach was to conduct a controlled study to compare users who completed design optimization problems without collaboration, with col-laboration in person via software colcol-laboration tools, and with colcol-laboration in person without collaboration tools.
1.2
Goals
This study strived to better understand the role and effects of collaboration in design optimization. Design optimization differs from other engineering problems because of its clear design goal and objective method of evaluation. By providing teams with live feedback and updates of team progress, we hope to observe the effect on their performance in design optimization problems. In particular, we hope to investigate the following ideas:
• How does collaboration influence performance on design optimization problems?
• How can we make design tools better for collaboration?
• What are some common patterns in collaboration, if any?
1.3
Hypothesis
1.3.1
Effect of Collaboration on Performance
We anticipated that users who collaborate with a teammate will perform better than those who work alone, since they are able to explore different designs in parallel and share ideas. We also expected that users who collaborate with built-in collaboration tools will perform even better since it allows them to more efficiently view, switch between, and build off of each others designs, and thus are able to rapidly explore many prototypes in the early stages before fully implementing one design. As studies have shown, users who explore a larger number of low-fidelity prototypes typically perform better and are more satisfied with their final design[5]. In addition, we believe that the ability for teams to view their teammate’s progress in real time will create an element of friendly competition, which may motivate better team performance.
with more designs faster. We also expected design tools to facilitate collaboration by allowing team members to seamlessly integrate their work environments. Users can easily switch between their own designs and their partner’s design. Design tools can also encourage collaboration by providing real-time information about their team-mates work progress.
1.3.3
Common Patterns in Collaboration
We anticipated to potentially see pairs of users who work together to fall into roles of leader and follower. We believed that in an environment where users collaborating on a design optimization problem do not know each other, people will tend to follow their teammate’s design if it performs well.
1.4
Thesis Summary
Chapter 2 covers a brief literature review of other research that has been conducted on team collaboration in design.
Chapter 3 provides background information on the Tacit software and presents relevant findings from previous user study results.
Chapter 4 discusses the new collaboration features that have been developed for this version of Tacit.
Chapter 5 explains the experimental design of the user study conducted for this research.
Chapter 6 presents the motivation and proceddure of a structure similarity algo-rithm that quantifies the similarity between two truss structures, which was developed to analyze the structures created by participants of the user study.
Chapter 7 presents and analyzes the results from the user study.
Chapter 8 discusses future work that can be done based on this research to further improve and examine the effects of collaboration on design optimization problems.
Chapter 2
Literature Review
2.1
Collaboration in System Design
System design is the process of creating modules and components for a system subject to specifications. In one study, teams of college graduates and engineers currently do not perform well in system design projects. They were not well prepared for large-scale engineering projects that require teams to balance a range of design and decision making skills, even when equipped with common modern collaboration tools, such as shared spreadsheets, Google Documents, and Skype instant messaging[1]. The re-sults showed that teams tend to focus on the optimization of individual parts and subsystems rather than the overall design, and do not consider the effects that these modules have at a system level[1]. Collaborative optimization software may not effec-tively improve performance on complex design problems without the augmentation of more structure or additional feedback to further facilitate the process of making design decisions.
In this study, we elected to focus on simple design optimization problems. By keeping the problem relatively simple, we eliminate the potential problems with col-laboration in system design as described in this study, because designs will not be intricate enough to become modular and not dependent on subsystems optimizations.
2.2
Effects of Team Structure on Performance
Social dynamics and team structure are integral components of a team’s performance. According to another study, co-located teams tend to adopt a social oriented approach to team projects whereas distributed teams are more likely to follow a task oriented approach. This research study found that, based on self-evaluation, co-located teams ranked higher in trust and evaluation[4].
If a team member is perceived to be more knowledgeable or experienced at a particular task, their ideas may be weighted more heavily and more easily accepted by the rest of the team. The study observed a likely example of the Abilene Paradox where some ideas are not opposed because the team member was believed to have more knowledge at the particular subject[1].
According to informal interviews conducted during pilot studies of this experi-ment, participants expressed that knowing their teammate better makes them more comfortable and more likely to communicate and share ideas with team members without fear of judgement. Thus, knowledge of team members’ backgrounds can have a significatn impact on team dynamic.
Although team structure can be highly influential on the performance of a team, design optimization problems differ from regular design problems in that there is a clear goal and method of evaluating the performance of each design. Therefore, while qualities like trust and evaluation are extremely important, teams may function well without these traits when working on a design optimization problem. For example, a distributed-located team who has never worked together before may not have a lot of trust their teammates, but if a design scores well, team members may not have a problem trusting the design of their teammates.
In this study, we focused on the collaboration between a pair of participants, who are task-oriented instead of socially-oriented. The participants who worked together were co-located and were randomly paired together based on their availability.
Chapter 3
Tacit Background
A custom collaborative software was created for this study, which built off of an earlier piece of research software called Tacit. This chapter describes the original version of the software.
3.1
Related Design Software
Similar software that aids users in structural design includes traditional single-user CAD and cloud-based Onshape. Both CAD and Onshape are full featured computer aided design software aimed at professionals to support 3D designs. CAD is a local software and to collaborate, users must share the CAD files with each other. Onshape is a cloud-based CAD system that supports live collaboration. Though these types of software are powerful, they are not appropriate for the type of study we want to conduct.
Tacit was built for research purposes to study design behavior. It is a lot simpler than the available commercial products and has features that integrate analysis and optimization into design and allow real-time collaboration between users.
3.2
Overview
Tacit is a 2D software tool that allows individual users to design and evaluate truss structures. It is a web application built primarily with Coffeescript and is hosted and supported by a Firebase backend.
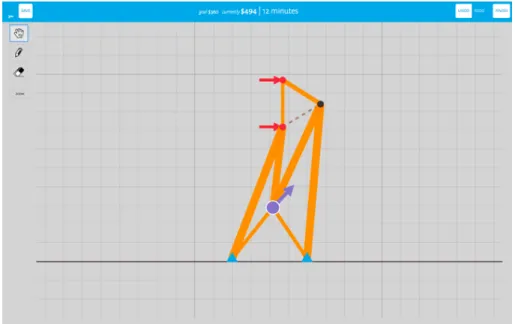
Users can view the score (cost of their structure) as they update it, and can save and load versions of the structures they have built. There are currently three different versions of the tool - manual, automatic, and optimized - designed to investigate how people perform on optimization challenges using the different tools. The manual tool requires the user to click an “analyze” button to see the feedback analysis in a separate panel, the automatic tool provides real-time analysis on the users structure, and the optimized tool automatically adjusts the sizes of the beams in the structure to the optimal size. Figure 3-1 is a screenshot from the single-user version of Tacit.
Figure 3-1: This depicts the user’s workspace while designing a truss structure us-ing the previous implementation of the optimized analysis tool of Tacit without the integrated collaboration features. This version supports only individual users.
3.3
Data Models
Tacit is built primarily with four data models - structures, events, nodes, and beams. These objects are stored in the Firebase database, and this section will describe these data models in detail.
3.3.1
Structures
Structures are created by users throughout the design problem. Every time a structure is created, it is automatically recorded into the database. When the user clicks the “save” button, the structure is saved into the database and added to the user’s history of designs, where it can be loaded later.
Each structure object contains a list of beams and a list of nodes that compose the structure, as well as the count of the number of beams and number of nodes in the structure. It also contains a timestamp of when the structure is created, and the type of tool that it was created with. Structures can be created with the draw, erase, move, or load tool. Each structure also has a weight attribute, which is the cost of the structure.
3.3.2
Events
Events are user actions that are logged throughout the problem. Each event contains a timestamp at which the event occured and an event type. The type of the event can either be a switch to a new tool (draw, erase, or move), load from saved designs, undo, redo, or save. For the “save” event type, the saved structure is recorded as part of the event along with the event type.
3.3.3
Nodes
Each node has an x, y, and z coordinate that specify the position of the node. Each node also keeps track of a fixed attribute that specifies whether the node is fixed in each dimension, as well as a immovable attribute that records whether the user can
move this node. Since this tool is currently 2D, all nodes are fixed in the z dimension but not fixed in the x and y dimensions, with the exception of the nodes from the problem, which are fixed in all dimensions. Nodes also contain a force attribute, which specifies the amount of force acting on the node in each dimension.
3.3.4
Beams
Each beam has a starting x, y, and z coordinate and an ending x, y, and z coordinate. However, the direction of the beam does not matter in the structure. Each beam also has a size, which is the thickness of the beam. In the optimized tool, the tool used in this study, the size is set automatically to the optimal size, which is the minimum size that still creates a stable structure. However, the other tools allow users to adjust the size of the beams. Beams also have an “immovable” attribute that specifies whether the user can move the beam. All beams are movable, except the beams from the problem.
3.4
Features
3.4.1
Current Score and Time
In the top center of the window, the goal cost, the score of the user’s current design, and the time remaining for the problem are displayed, as seen in Figure 3-2. The goal of the problem is to minimize the cost of the structure, and the goal cost is a maximum threshold, such that all users who reach the goal will receive an additional reward. The user’s current score is the cost of their current structure. This is updated every time the user updates their structure.
3.4.2
History
Figure 3-3 depicts the panel at the top left that shows all of the user’s previously saved designs, and their respective scores. The user can click on any of the designs to load it into their current workspace and then continue to edit it.
Figure 3-3: Example of a user’s history of saved designs.
3.4.3
Tools
On the left panel, shown in Figure 3-4, users can switch between the move, draw, and erase tools. There is also a zoom button that allows the user to center their screen on the structure if they accidentally zoom in or out too far.
Figure 3-4: Tools selection panel for users to switch between the move, draw, and erase tools.
3.4.4
Undo, Redo, and Finish
Users can undo or redo changes to their structure using the buttons in Figure 3-5. To finish the problem before the time is up, users can click the finish button at the top right of the window, which will end the problem and take them to the post problem survey.
Figure 3-5: Undo, redo, and finish button at the top right of the window.
3.5
Initial Individual User Study Results
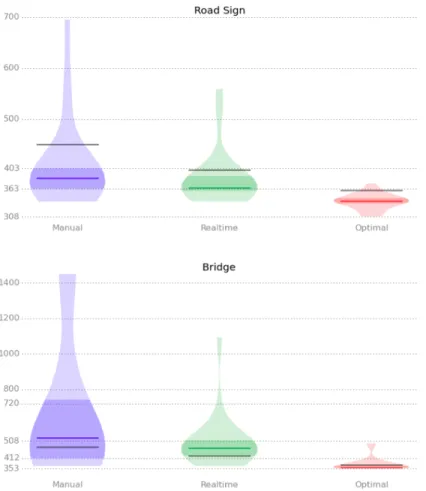
A previous study conducted with Tacit experimented with combinations of differ-ent versions of the tools with two differdiffer-ent structural design problems - a road sign problem and a bridge problem[2]. Participants solved each problem using either the manual tool, the automatic tool, or the optimized tool. The manual tool performs the analysis of the structure after the user completes the design. The automatic combines analysis with design, leaving the optimization to the user. The optimized tool inte-grated analysis and optimization into the design tool. The results showed that users using the optimized tool were able to achieve higher scores (lower cost structures) in less time, in comparison to users who used the automatic tool, who performed better than users who used the manual tool[2].
For this collaboration study, we chose to have users complete the road sign problem using the optimized tool. As we can see from Figure 3-6, the top 75th percentile of users completing the road sign problem span a much larger region, whereas the range
because it is more effective in differentiating the differences in performances among users.
Figure 3-6: User performance on the road sign problem and the bridge sign problem, using each tool. The colored line indicates the median and the black line indicates the threshold for additional reward. The darker section indicates the 25th to 75th percentile[2].
Chapter 4
Tacit Collaboration Features
4.1
Goals
We added a few new collaboration features to Tacit that allow users more easily design with a teammate in real time, and this new software is called “Tacit Collaboration.” A screenshot of the software including these new functionalities is shown in Figure 4-1. These new features aimed to:
• Allow users to seamlessly collaborate closely with their teammate regardless of their physical location
• Allow teams to explore a larger solution space more efficiently within the limited timeframe
4.2
Database Design
Tacit uses Firebase which stores all necessary data in JSON format. Firebase allows the application to synchronize data across multiple clients accessible via a web API, so that team members can have access to each other’s data in real time. Previously, Tacit was a front-end only application, since it was not necessary for the data collected to be readily accessible by a different client, so the data was simply downloaded at
Figure 4-1: Current implementation of Tacit with collaboration features as seen in the panel at the bottom right of the window.
the end of the session. However, in order for multiple users to work together, we need to be able to store and retrieve data in real time between applications.
In the Firebase database, the application creates a new entry for each study, which contains an entry for each of the two user. Currently, we support two users per session, since each user will be working with exactly one other team member. However, this database structure can easily be scaled to support more than two clients per session by adding another client with a unique ID.
Each client has a separate JSON entry for each “problem” that they complete. For this experiment, each participant completes the tutorial and then the road sign problem, so each user has two entries. This is also easily scalable for any number of problems that the user completes.
For each problem, we store three entries - metadata, events, and structures. The metadata entry contains information about which problem the user is designing for (road sign or bridge), and the tool that they used (manual, automatic, or optimized). In this study, all participants designed for the road sign problem using the optimized tool. The events entry contains a list of user action events that are recorded during
4.3
Live Preview and Score
The live preview allows users to see the their teammate’s design progress and score updates in real time. As seen in Figure 4-1, there is a panel on the bottom right of the user’s workspace. At the top of the panel, it displays the current score (cost) of the teammate’s structure. In the middle, the preview window shows the easel that contains the current state of the structure in the teammate’s workspace, and any updates will be immediately visible to the user.
To provide a live preview of a user’s teammate’s design, we attach an event listener to the structures JSON object entry of the teammate’s entry in Firebase. This event listener will be triggered every time a new structure is added to this list. Since every action will create a structure, we update the preview window by pulling and redrawing the latest structure in the list every time the event listener is triggered. Thus, the preview window will always show the current design in the teammate’s workspace.
Since each structure has a “weight” attribute that is the cost of the structure, the current cost of a user’s teammate’s current structure can easily be updated by accessing this attribute of the displayed structure.
4.4
Load Teammate Designs
Users can load their teammate’s current design or any previously saved designs and can modify and build off of those designs. This allows teams to rapidly try various prototypes in parallel. As seen in Figure 4-1, under the live preview window in the bottom right panel, users can see all the previously saved versions of their teammate’s design.
In order to support loading designs from teammates, we need to store the entire structure on every save. Thus, every time a user clicks the “save” button, the current structure is also stored into the database so that the user’s teammate can use this data to update the preview.
of designs, we also update the teammate’s preview of the user’s history. This allows a user’s teammate to see that the user has saved a new design. We do this by also calling method to append a new easel to the history of versions for the teammate. In order to distinguish between the two applications, each user has an ID - either 0 or 1, and every time an update is made, we can make the appropriate updates to the client with the other ID.
4.5
Instant Messaging
We had considered adding a instant messaging feature to the application to allow users to talk to their teammate during the problem. However, since the study was only conducted on co-located teams, we decided that this was not a necessary feature right now. Users will be able to talk to their teammate in person as they will be physically in the same room throughout the experiment, and it may be unnatural for people to communicate through instant message when they are located in the same physical space. Incorporating the chatbox into the user interface will take up additional space on the screen, which reduces the available workspace.
Chapter 5
Experimental Design
In this experiment, we looked at the results of users completing the road sign design problem using the optimized design tool. Based on previous user studies on Tacit, we chose to conduct the study using the road sign design problem. Figure 5-1 shows the road sign problem that participants were asked to complete.
We compared three conditions: users who did not collaborate with a teammate, users who collaborated with a co-located teammate in person without any built-in collaboration tools, and users who collaborate with a co-located teammate using the new version of Tacit with built-in collaboration tools.
5.1
Group 1: No Collaboration
As the control for this study, we used results of users who completed the road sign problem using the optimized tool from the previous user study conducted with the previous implementation of Tacit. The previous implementation of Tacit does not have any built-in collaboration features. Users in this experiment group completed the design problem on their own, without any collaboration. All other experimental variables, such as the tutorial, time limit for the problem, and prize structure, were kept constant for the other groups of this experiment.
Figure 5-1: The road sign problem. The red arrows are the forces acting on the road sign, the dotted brown line is an unsupported beam, and the blue triangles are the supports where the forces should be grounded.
5.2
Group 2: Collaboration with Collaboration
Soft-ware
The second group of users completed the design optimization problem with a version of Tacit with collaboration functionalities, and worked with a co-located teammate. The participants were encouraged to talk to each other and share ideas with their teammate as if they were someone they have been working with for a while. This group of users used the version of Tacit described in the next section of this paper.
5.3
Group 3: Collaboration without Collaboration
they worked together in the same space and collaborated in-person with a teammate, and were also encouraged to communicate with their teammate. Team members are allowed to look at each other’s computers. The goal of this group of users was for us to see whether people performed better simply by working with a partner, or whether the software tools provided were actually able to further enhance performance.
5.4
Compensation and Prize Structure
All participants received a 15 dollar Amazon gift card for participating in the study. Users who achieve the goal score for the problem received an additional 5 dollars. The team with the highest score each received a prize of an additional 50 dollars. This prize structure was designed to motivate participants to build structure with the lowest score possible. They are first presented with a reachable goal that motivates
them to create a slightly optimized stable structure. Once they have a baseline
structure, they have the prize as a motivation to optimize their structure to be as cheap as possible. The prize structure also encourages participants to work with their partner to further optimize the cost of their structure.
5.5
Experimental Method
We recruited 44 undergraduate students from MIT for this user study. We did not require any previous experience with structural design or engineering, because the pre-vious user study showed no correlation between relevant coursework and performance on these design problems. Participants completed the design problems in pairs. 9 pairs collaborated with the previous implementation of Tacit that did not have built-in collaboration features. 13 pairs collaborated with the current implementation of Tacit, which included the collaboration tools.
In both groups, pairs of participants worked in a room where they were each set up with a desk with a computer, keyboard, and mouse. The pairs who did not have the collaboration software sat next to each other, such that they could see each other’s
computer screens. The pairs who did have the collaboration software sat facing each other, such that they could not see each other’s computer screens. Both groups were sat close enough that they can easily talk to each other and see each other.
The pairs of collaborators did not know each other before the experiment, and were randomly paired based on the availability they provided. In a few cases, participants have coincidentally been matched with someone they have seen before, but none of the participants knew each other well or have worked together before.
Each session lasted approximately 30 to 40 minutes, beginning with a brief in-troduction explaining the compensation structure and set up of their work station. Each participant individually completed a short quiz designed to provide background knowledge on truss structures, and then went through a computer-aided tutorial of the software, as shown in Figure 5-2. The tutorial explained the basics of the tool and the participants had a chance to work through some examples.
Figure 5-2: A step from the tutorial that participants completed before the problem.
After both participants have completed the tutorial, they began the problem to-gether. They are encouraged to work together and talk to each other throughout the problem. There were no restrictions on how they could collaborate or communicate with each other. Following the problem, the participants each completed a survey individually. The survey asked about their experience during the problem and their
sign approach. It also covered basic demographics information and their background knowledge in structural design prior to the problem.
Chapter 6
Structure Similarity Algorithm
6.1
Motivation
To measure the effect that collaboration has on the performance of teams, it is essen-tial to quantify the type and amount of collaboration between teammates. Originally, we wanted to measure the amount of collaboration via software tools by logging the events when users would load designs from their teammate. However, during a pilot study conducted with five pairs of students, we found that this is does not accurately portray the collaboration we observed.
We observed that participants would pick up certain apsects from their teammate’s design by looking at the live preview window and then create and try out those features in their own workspace without actually clicking to load their teammate’s design. We also observed that often times users would end up with similar structures at approximately the same time without actually loading each other’s structures. This kind of collaboration would not be captured by the logs in the software. When we talked to the participants at the end of the pilot study about this observation, participants sometimes said they were trying out certain features of their teammate’s design by looking at the preview window. However, sometimes the participants do not realize they are copying their teammate’s design and so we deduce that the live preview may be unconsciously influencing the participant’s design.
truss designs. With a metric to measure the similarity between two trusses, we can compare team members’ designs at any given time throughout the problem and track how the two designs converge or diverge throughout the problem. We believe that this may reveal interesting patterns and trends in collaboration.
6.2
Specifications
This algorithm will take two truss structures as input, and return a metric of how similar the two designs are. The more similar the two structures are, the lower their metric will be. Two identical structures will have a metric of 0.
Each structure has a list of nodes and a list of beams that compose of the structure. The two structures will be designs for the same problem, so they are guaranteed to share nodes and beams from the problem. The two structure may be topologically different (differing number of nodes and beams) and geometrically different (the nodes and beams may have different coordinates).
6.3
Algorithm Design
This algorithm quantifies the similarity between two trusses by returning a metric that represents the similarity between two structures. We calculate this metric through three main steps, as follows:
1. Node matching: Match as many node as possible between the structures, such that the sum of the Euclidean distances between each pair of mapped nodes is minimized. The metric is the sum of the distances between each pair of mapped nodes.
2. Beam matching: Consider all the nodes that are mapped in the node matching phase and calculate the graph edit distance by summing the lengths of beams
3. Additional nodes and beams: Consider the nodes that were not matched in the node matching phase and all the beams that connect it to the structure. To calculate the metric, we examine each possible pairing of beams that connected it to the structure for each node. If the pair of beams is a replacement for a single beam in the original structure, we calculate the difference between the two beams and subtract the original length, and if not, we add the length of the additional beams.
The final metric that quantifies the similarity between the two structures is the sum of the metrics from each step.
6.3.1
Node Matching
In the node matching phase, we want to create a mapping between the nodes of each structure and calculate a metric that represents the similarity between matched nodes. We are given two structures s1 and s2 with m and n nodes, respectively, where
m is less than or equal to n. Since structure s1 has fewer than or equal number of
nodes as s2, we want to map every node of s1 to a unique node in s2, such that the
sum of the Euclidean distances between each pair of mapped nodes is minimized. Step 1: Fix Problem Nodes
Each problem starts with certain nodes and beams that cannot be moved. First, we
map each node from the problem in s1 to the corresponding node from the problem in
s2. Since s1and s2are structure designs for the same problem, they are guaranteed to
have the same nodes from the problem. The mapping of the nodes from the problem are fixed regardless of whether a different mapping would minimize the overall metric.
Step 2: Node Mapping and Metric Initialization
After all the nodes from the problem are mapped, we sort the list of remaining nodes for each structure by the x coordinate and initialize the mapping to map each node in the node list of s1 to the node in the corresponding index in the node list of s2
in the sorted order. Then, we initialize the node similarity metric by computing the Euclidean distance between each pair of mapped nodes. We sort the list of nodes by
their x coordinates first in order to reduce the number of modifications we need to make to the mapping.
Step 3: Node Mapping and Metric Optimization
To find the optimal node mapping, we consider each of the possible pairings between a node in s1 and a node in s2. If switching the pairings reduces the overall metric,
then we switch the mapping and update the overall metric accordingly. Thus, after we have examined each pairing, we will have arrived at a mapping between the nodes of s1 and the nodes of s2 such that the sum of the Euclidean distances between every
pair of mapped node is minimized and every node in s1 is mapped to a different node
in s2.
6.3.2
Beam Matching
For the beam matching phase, we have access to the node mapping from the node matching phase and we want to calculate similarity between the beams of the struc-ture. We consider the m pairs of nodes that are matched in the previous phase and calculate the beam similarity metric for these nodes only. Thus, we will be
disre-garding all the nodes from s2 that are not mapped and all the beams that start or
end at those unmapped nodes. The beam similarity metric is the graph edit distance between the two structures, where the two possible operations are to add or remove beams, and the cost of each operation is the length of the beam that is added or removed[3].
Step 4: Beam Metric Calculation
We calculate beam similarity metric by calculating the graph edit distance between
s1 and s2. We check each of the possible pairings of the m nodes in s1 and the
corresponding pair in s2 according to the node mappings made in the previous phase
of the algorithm. If a pair of node is connected by a beam in s1 but not s2 or vice
versa, then we need to add or remove the beam. The cost to add or remove that
a higher metric than a structure that needs a shorter beam.
6.3.3
Additional Nodes and Beams
In the final phase of this algorithm, we take into account the additional nodes and
beam from s2 that were not mapped in the node matching phase. Therefore, if s1
and s2 have the same number of nodes, then all the beams would also have been
considered in the beam matching phase, so the additional metric here would be 0.
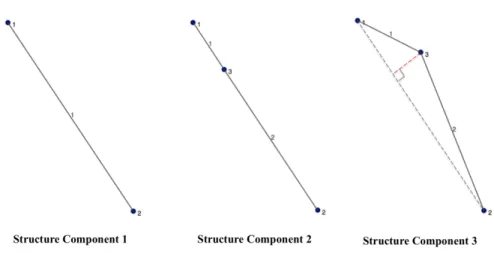
Figure 6-1: Example structures components for calculating beam similarity metric. In this example, Structure Component 2 and 3 are both replacements of Structure Com-ponent 1. Structure ComCom-ponent 2 is an exact replacement and Structure ComCom-ponent 3 is an inexact replacement.
The idea is that if a beam b1 in s1 can be replaced with two beams b2 and b3 in s2
that compose of b1, we want quantify the difference between the b2 and b3 together
versus b1. That difference would be added to the similarity metric, instead of the
graph edit distance cost, which would add the removal of b1 and the addition of b2
and b3 to the similarity metric. Thus, two beams in s2 that exactly make up a beam
in s1 would be considered identical and have a metric of 0, even though essentially a
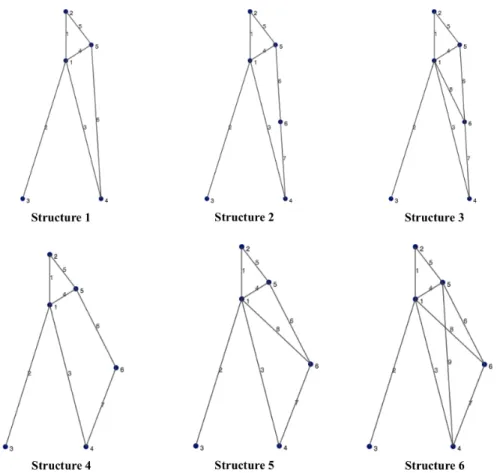
Figure 6-2: Example structures for calculating similarity metrics for additional nodes and beams.
Step 5: Determining Replacement Beams
To calculate the additional similarity metric, we want to determine which beams are replacement beams. A pair of beams in s2 “replaces” a beam in s1, if the two nodes
connected to the unmapped node is directly connected by one beam in s1 but not
in s2. As seen in Figure 6-1, Beam 1 and Beam 2 in Structure Component 2 is an
exact replacement for Beam 1 in Structure Component 1. In Structure Component 3, Beam 1 and Beam 2 is an inexact replacement for Beam 1 in Structure Component 1.
To identify replacement beams, we perform the following steps for each unmapped node in s2:
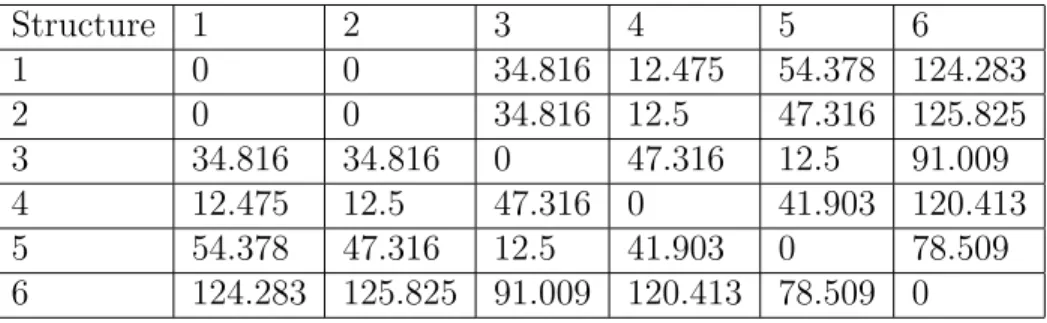
Table 6.1: Similarity metrics between example structures. Structure 1 2 3 4 5 6 1 0 0 34.816 12.475 54.378 124.283 2 0 0 34.816 12.5 47.316 125.825 3 34.816 34.816 0 47.316 12.5 91.009 4 12.475 12.5 47.316 0 41.903 120.413 5 54.378 47.316 12.5 41.903 0 78.509 6 124.283 125.825 91.009 120.413 78.509 0 beams.
• For each pairing, if the pair replaces a beam in s1, then the pair of beams in s2
are both replacement beams. The beam in s1 that is replaced is also returned
for the additional similarity metric calculation in the next step.
• If the pair of beams in s2 is not replacing a beam in s1, we mark both beams
of the pair in s2 as not “replacement” beams.
• If a beam is marked as replacement for one unmapped node but not for another, “replacement” takes priority.
Step 6: Calculating Additional Metric
After categorizing each additional beam as either a replacement or non-replacement beam, we want to calculate the additonal similarity metric. If a pair of beams is a
replacement, then we subtract the length of the beam in s1 that it replaces, since
it would have been added to the beam similarity metric during the beam matching phase. By subtracting the length now, we “undo” it and then add the difference between the beam in s1 and the pair of beams in s2. The “difference” is defined as
the height of the triangle formed by the start and end node of the beam in s1 and
the unmapped node, with the unmapped node as the apex.
In Figure 6-1, the additional similarity metric of Structure Component 1 and 2 is the negative length of Beam 1 in Structure Component 1, so that the overall similarity metric is 0. The additional similarity metric of Structure Component 1 and 3 is the
negative length of Beam 1 in Structure Component 1 plus the height of the triangle formed by Nodes 1, 2, and 3 in Structure Component 3, with Node 3 as the apex, as shown with the red dotted line. Thus, the overall similarity metric is just the length of the red dotted line.
In Figure 6-2, Structure 1 and Structure 2 would be considered identical, even though Structure 2 has an extra node, Node 6. In the beam matching phase, using the graph edit distance method, we would incur a metric of the length of Beam 6 in Structure 1 since we would have to “add” a beam of that length from Structure 2 to obtain Structure 1, when we do not consider the unmapped node, Node 6. However, Beam 6 and Beam 7 in Structure 2 replaces of Beam 6 in Structure 1, so we would subtract the length of Beam 6 in Structure 1 so the overall metric would be 0.
Step 7: Final Similarity Metric
The final similarity metric between two truss structure is the sum of the node simi-larity metric, beam simisimi-larity metric, and the additional simisimi-larity metric.
6.4
Alternative Solutions
We have also considered alternative solutions, such as image recognition and visual ratings. An example of a simple image recognition solution is to recreate a black and white image of each structure and then compare the pixel differences between the two images. However, this is not very effective since two beams that differ by a small angle would only share the pixels near their intersection point, resulting in a low similarity metric, even though visually we would consider the two beams to be similar. Since we have all the geometric coordinate information of the nodes and beams of the structure, we believe that we can utilize that information to calculate a better metric using a graph problem approach.
An example of a visual rating solution is to have people rate the similarity of two structures sampled at fixed time intervals based on their visual perception of the
to run the experiment with larger groups of users. Also, this solution would be affected by the rater’s subjective opinion of what looks similar to them. A graphical approach would be scalable for larger datasets and can quantify similarity metrics across different structures objectively.
Chapter 7
User Study Results and Analysis
7.1
Effects of Collaboration on Performance
7.1.1
Result Comparisons
Results from this user study showed the general trends as expected from the hypoth-esis. Users who collaborated with another participant were able to reach lower costs (better score) than users who completed the problem individually. Users who used the collaboration software tools performed better than users who did not have the collaboration software.
Table 7.1 shows the basic demographics of the users who participated in the study. Figure 7-1 shows the performances of the three groups of users on the road sign prob-lem using the optimized tool. Focusing on the 25th to 50th percentile, we can see that the average user performs the best using the software with collaboration tools, followed by users who collaborated without the collaboration tools, and then the users
Table 7.1: Participant demographics
Freshman 24 Sophomore 9 Junior 4 Senior 3 Masters 4 Female 26 Male 17
Figure 7-1: Cumulative distribution function that shows the comparison of the per-formance of individual user scores on the road sign problem using the optimized tool.
who did not collaborate. 20 individuals completed the problem without collaboration, and their performance is depicted by the red cumulative distribution function in Fig-ure 7-1. 9 pairs completed the problem together without the collaboration software, shown in green, and 13 pairs worked together with the collaboration software, shown in blue.
The goal for this problem was to reach a cost of 360 dollars. Participants who reached the goal received an additional 5 dollars. As we can see from 7-1, all the teams who collaborated were able to reach this goal. Teams who used the collaboration software were able to achieve a cost cheaper than 350 dollars.
and thus efficiently explore a larger solution space.
We found that users who utilized the collaboration tools did perform better. In particular, we looked at the the load feature that allowed users to directly load their partner’s design into their workspace. Based on the results from the user study, users who loaded their teammate’s structure more frequently generally performed better. However, there were also many teams who performed just as well without utilization the collaboration software.
Figure 7-2: Individual best scores versus the number of times users loaded their team-mate’s structure for users who used the collaboration software tool. The individual best score is the lowest cost for each individual user.
Figure 7-2 shows how each individual user performed versus the number of times they loaded from their teammate’s structure. As we can see, approximately half of the users loaded their teammate’s structure at some point during the problem, and users who loaded from their partner at least four times throughout the problem scored in the upper 50th percentile.
Looking at each team as a whole, we can see that some teams had one teammate who loaded from their partner more than the other, while some team members loaded from their partner more evenly. Despite these different situations, we still see the same
Figure 7-3: Team best scores versus the number of times teammates loaded each other’s for teams who used the collaboration software tool. The team’s best score is the lower cost of two individual costs from each team member. The number of times users loaded a teammate’s structure is the sum of the times each user loaded their partner’s structure.
general trend as in the individual scores. The teams who used the load feature more performed better, but there are also teams who performed well without using the load feature at all. As we can see in Figure 7-3, teams who together loaded each other’s designs over five times throughout the problem scored in the upper 50th percentile.
Although many users did not load their teammate’s structure more than a few times throughout the problem, a majority of participants reported in the post problem survey that they felt like loading their partner’s design changed their approach to the problem, which we can see in Figure 7-4. Figure 7-5 shows that teams who had the collaborative software felt that loading their partner’s design and playing around with was more effective in influencing their design approach than viewing the design in the preview window.
Figure 7-4: Survey responses from users on how the collaborative load tool changed their approach to the problem.
7.1.3
Structural Diversity Analysis
As we observed in the pilot study, the utilization of the collaborative load feature does not accurately portray the amount of collaboration we observed. Since the structures for this problem were simple enough, sometimes users would copy their partner’s structure by redrawing it themselves without using the load tool, and sometimes users seem to be unconsiously affected by the preview of their partner’s design. Thus, we are using the structural similarity algorithm discussed in Chapter 6 to further examine the collaboration between team members.
According to our hypothesis, teams who collaborate would perform better because they can explore different design ideas in parallel, and teams who used the collabora-tion tool would perform even better since they can explore different prototypes more efficiently. Thus, we expected to see a correlation between more diverse structures and lower cost designs.
Figure 7-5: Survey responses from users on which part of the collaborative features was the most influential to their design approach.
To measure structural diversity, we calculated the similarity metrics using the structural similarity algorithm between each structure and the best structure, and took the average similarity metric for all the structures recorded throughout the problem. Thus, a team that explored structurally different designs would have a higher structural diversity than a team that explored structurally similar designs. A team that explored different designs for a longer period of time will also have a higher structural diversity than a team that explored different designs for a shorter period of time.
From the results of this user study, we can see in Figure 7-6 that teams that explored structures with greater diversity did indeed perform better. Although there are also some teams who performed well despite not exploring diverse structures. We can also see in Figure 7-6 that teams who collaborated using the collaboration tool were able to create more diverse designs.
This is consistent with our hypothesis as teams who explored a larger solution space are more likely to find the optimal solution, but teams who find a good design early on in the process may not feel the need to explore other designs and may instead focus their time on optimizing the current design they have. Thus, the collaboration tools are helpful for exploring more designs efficiently, but are not necessarily useful for teams that want to focus on optimizing a good design.
In addition to comparing the structural similarity between each structure with the best structure, we also looked at the structural similarity between the designs of each pair of teammates throughout the problem. We found that teams that performed well showed several peaks where teammates were exploring very different designs, whereas teams that did not perform well had much more similar designs throughout the problem. For example, Figure 7-7 shows the progress of one team that achieved one of the highest score. This team was able to achieve a stable structure very early on. The teammates explored two very different designs near the beginning of the problem, and then converged to a similar structure near the middle of the problem. From there, the teammates then explored two different designs, building off from the same design, before eventually converging to their final design. In Figure 7-8, we can
Figure 7-7: Example of similarity metrics between teammates’ structures throughout the problem for the teams with the cheapest structure (best score).
Figure 7-8: Example of similarity metrics between teammates’ structures throughout the problem for the teams with the most expensive structure (worst score).
see that this team took longer to achieve a stable structure and both teammates had relatively similar structures throughout the problem, in comparison to the team in Figure 7-7.
This shows illustrates the significance for teammates to explore structurally dif-ferent designs to create a more optimized structure. Collaboration allows teams to explore these different designs in parallel, and the collaboration software features allows teams to do this efficiently.
7.2
Design Tools for Collaboration
One of the goals of this study was to improve design tools for collaboration. We an-ticipated that the addition of the feature that allows teammates to load each other’s designs will increase the efficiency of collaboration, and thus improve performance. We also thought that having a live preview of their teammate’s progress would facil-itate more collaboration between team members.
However, in this user study, teams who collaborated without the collaboration software demonstrated more physical collaboration through discussion. Teams that did not have the collaboration tool discussed talked to each other more throughout the problem. By providing the live preview to the users, we unintentionally reduced the physical interaction between teammates.
Figure 7-9 depics how users felt talking to their partner influenced their approach to the problem. Most users either did not feel strongly or agreed that talking to their partner influenced their design approach. In addition, most users felt that they did not talk to their partner frequently throughout the problem, as seen in Figure 7-10. However, this may be an inaccurate portrayal as “frequent” is a subjective description. For example, one of the most talkative pair throughout the study, did not feel like they talked much with their partner at all.
Some interactions were simple questions like “Can I look at your last [saved] structure?” or “I think your structure has an extra beam here.” In these cases, we assume that teams with the collaboration software tool can simply click on their
Figure 7-9: Survey results from users on how talking to their teammate changed their approach to the problem.
Figure 7-10: Survey results from users on how often they talked to their teammate.
teammate’s last structure or re-load their teammate’s structure to achieve the same structure. Thus, the collaboration software successfully increase the efficiency of these interactions by eliminating them. However, these simple interactions also made team
Teams sometimes discussed strategies to optimized their structure. For example, a participant mentioned to his partner that “your structure mirrored on the other side would be cheaper,” and another participant told his teammate that “I think it is cheaper to make a lot of smaller beams.” Talking about these strategies with their teammates allowed the teams to come up with an approach to the problem together, which is faster than the trial and error method where teammates would load their partner’s structure and play around with it to learn from it. This type of interaction was more common in teams without the collaboration tools, perhaps because they interact more throughout the problem so they are more comfortable talking to each other.
We anticipate that in an actual team environment, team members would already know each other and be comfortable discussing ideas with each other, so that this type of interaction would be more common regardless of the type of tool that they were using. To make design tools better for collaboration, we need the tools to facilitate discussion. We can encourage more discussion and collaboration by including an instant messaging feature for team members to talk to each other. This would be especially useful for teams who are collaborating remotely.
7.3
Common Patterns in Collaboration
We had originally anticipated to see some patterns in the ways team collaborated where team members falls into the roles of leader and follower. However, we were unable to find any common patterns in collaboration. Different teams varied in the amount and times teammates loaded from each other’s structure, and the similarity of team members’ structures to the final design and to each other were varied across teams.
We also looked at when users interacted the most with their teammate. The results showed that most users communicated with their partner evenly throughout the problem, while the teams without the collaboration tool talked to their partner either evenly or more towards the end of the problem. Most teams with the
col-Figure 7-11: Survey results from users on when they looked at their partner’s design.
Figure 7-12: Survey results from users on when they talked to their teammate.
laboration tool looked at their partner’s structure throughout the problem, while the teams without the collaboration tool was split between the beginning, end, and evenly throughout the problem.
Conducting further studies with more complex problems and team members who are more comfortable working with each other may reveal more interesting patterns
Chapter 8
Future Work
8.1
Tacit Software
8.1.1
Concurrent Editing
The next step in creating an even more integrated collaboration environment is to allow users to work on the same design. This improves the efficiency of collaboration by eliminating the need for users to load each other’s structures since teammates will be modifying the same structure. Concurrent editing will allow users to collaborate even more closely than the current version of Tacit. It is also more scalable to ac-comodate teams with more than two users, since it will be able to support a large number of users without too many preview windows cluttering the window. However, this means that teams cannot explore different designs in parallel and removes the motivation that stems from friendly competition among team members. It would be an interesting user study to compare the results of teams using these two versions of Tacit.
8.1.2
Communication Support
Tacit does not currently support communication between teammates to facilitate discussion of ideas and strategies. However, the responses from the post problem survey in this user study indicated that this is an influential component of the design
process. Thus, a possible next step is to include features that encourage commu-nication in teams. For example, incorporating instant messaging or video chat into the software may help teammates talk to each other more frequently throughout the problem.
8.2
Experimental Method
8.2.1
Teammate Familiarity
In this user study, many participants did not collaborate as much with their team-mate as much because they did not know their teamteam-mate before and so they were more reserved in their communication. A potential modification to the experimental method would be to have teams complete the tutorial collaboratively so they can get to know each other better before tackling the problem together. Another possibility is to have participants sign up for the user study in pairs so they can work with someone they comfortable with.
8.2.2
Increasing Problem Complexity and Time Limit
To keep the experiments consistent with the control group who did not collaborate, we limited users to solving the road sign problem in 12 minutes in this user study. However, we can increase the complexity of the problem and the time limit to better observe patterns in collaboration, since it takes more time for teams to discuss and experiment with their partner’s designs. Some participants expressed in the comments in the post problem survey that they wished they had more time to work on the problem, and that having a time limit affected their design approach since they felt
8.2.3
Exploring Distributed vs. Co-Located Teams
Another interesting area for exploration is the differences between distributed and co-located teams. In this study, all teams were co-located, but with the addition of communication features, such as instant messaging and video chat, teams can work together and communicate regardless of physical location. It would be interesting to see how teams perform with these collaboration software functionalities while being physically in the same location or not.
8.3
Structural Similarity Algorithm
8.3.1
Mirrored Structures
In many cases, a mirrored structure may be considered very similar to the structure itself. For example, in the context of the road sign problem, a structure mirrored across the y axis would be considered similar to the structure itself. It is not ex-actly similar in this case since the forces in the problem are only from one direction. However, sometimes teams explored both sides of the structure. Thus, the structural similarity algorithm should take into account this fact. One way would be to always calculate the similarity metric between both the structures and their mirrored images, and then scale by an appropriate factor. For example, if users were doing a problem where the forces are symmetric, it may not necessary to scale the metric.
8.3.2
Multiple Beam Replacement
In the additonal nodes and beams phase of the structural similarity algorithm, we take into account the fact that two additional beam may “replace” an existing beam in the other structure. However, any number of additional beams may “replace” an existing beam in the original structure. Currently we only consider two additonal beams “similar” enough to be treated differently. However, there may be cases where a set of beams can be very similar to a single beam in the original structure and should be treated as a “replacement” in the metric calculation instead of using the
edit distance.
In the case of exact replacements, currently we only consider exact replacements of two beams that replaces one beam. We should modify the algorithm to take into account cases when multiple exactly replaces a single beam. However, exact beam replacement occurs extremely rarely, and is also covered in the tutorial that users should replace a set of exact replacement beams with just a single beam. Thus, this is not currently problematic.
Chapter 9
Contributions and Conclusion
9.1
Contributions
The contributions of this thesis include building a new version of Tacit with collabora-tion features, a user study that examined the performance of users who collaborated on design optimization problems with and without these new features, and an algo-rithm that quantifies the similarity between two truss structures in this context.
Tacit now allows users to collaborate with a partner in real time through their web browsers regardless of physical location. Team members using the same Tacit session can preview their partner’s design in real time and see all of their teammate’s saved structures and costs. Clicking on any of these previews will load the teammate’s structure into the user’s workspace where the user can modify and build off of the design.
The user study showed that collaboration improves the performance on design op-timization problems and demonstrated the effectiveness of the collaboration software. It also revealed the significance of structural diversity on performance and how the collaboration software tools affected physical collaboration.
The structural similarity algorithm takes into account the geometry and topology of two truss structures and returns a metric that quantifies the similarity between the two designs.