HAL Id: hal-01241715
https://hal.archives-ouvertes.fr/hal-01241715
Submitted on 11 Dec 2015
HAL is a multi-disciplinary open access archive for the deposit and dissemination of sci-entific research documents, whether they are pub-lished or not. The documents may come from teaching and research institutions in France or abroad, or from public or private research centers.
L’archive ouverte pluridisciplinaire HAL, est destinée au dépôt et à la diffusion de documents scientifiques de niveau recherche, publiés ou non, émanant des établissements d’enseignement et de recherche français ou étrangers, des laboratoires publics ou privés.
within a group of preschoolers: A longitudinal study
Aurélie Nardy, Jean-Pierre Chevrot, Stéphanie Barbu
To cite this version:
Aurélie Nardy, Jean-Pierre Chevrot, Stéphanie Barbu. Sociolinguistic convergence and social in-teractions within a group of preschoolers: A longitudinal study. Language Variation and Change, Cambridge University Press (CUP), 2014, 26 (3), pp.273-301. �10.1017/S0954394514000131�. �hal-01241715�
Nardy, A., Chevrot, J.-P. & Barbu, S. (2014). Sociolinguistic convergence and social interactions within a group of preschoolers: a longitudinal study, Language Variation
and Change, 26(03), 273-301.
Aurélie NARDYa, Jean-Pierre CHEVROTa, b, Stéphanie BARBUc a
LIDILEM – Laboratoire de Linguistique et Didactique des Langues Étrangères et Maternelles, Univ. Grenoble Alpes, France
b
Institut Universitaire de France c
ETHOS – Éthologie animale et humaine, UMR 6552 CNRS & Université de Rennes 1, France
Corresponding author: Aurélie Nardy, LIDILEM, BP 25, 38040 Grenoble cedex 9. E-mail: aurelie.nardy@u-grenoble3.fr. Tel: +33 (0) 4 76 82 68 13, Fax: +33 (0) 4 76 82 43 95
Sociolinguistic convergence and social interactions within a group of preschoolers: a longitudinal study
Abstract
Sociolinguistic studies have shown that linguistic usage is closely related to social relationships and interactions between individuals. This has been established in adults and adolescents but developmental studies in children are lacking. This paper aims to study whether peers influence the acquisition of social dialects in young children and how, by using direct observations and quantitative analyses of spontaneous peers’ interactions and
relationships at kindergarten. The longitudinal follow-up of one group of French-speaking children aged 4-5 years shows that the individual scores of sociolinguistic variables converge after one year of frequent contact. Moreover, we find that children who interact more
frequently adopt similar usage of sociolinguistic variables, whereas other factors have no influence (teacher’s speech, child’s awareness of standard sociolinguistics norms, reported interpersonal attraction). These results provide the first evidence that social interactions within the peer group do have an influence on children’s linguistic usage through daily interactions at an early age.
Acknowledgments
This research was supported by the program Apprentissages, connaissances et société funded by the ANR (French national agency for research).
1. Introduction
1.1. Social network and sociolinguistic usage
In the field of variationist sociolinguistics, many studies have shown that linguistic usage is socially stratified according to speakers’ macro-sociological characteristics such as age, gender and social background. Furthermore, socio-demographic characteristics being equal, the frequency of variants depends on the social context of the exchange influencing the stylistic choices of the speaker (Chambers, Trudgill & Schilling-Estes, 2002). However, two speakers with identical socio-demographic characteristics placed in the same situation can produce different linguistic traits. This observation gave rise to the use of a micro-sociological approach to the phenomena of variation, based in particular on the concept of social network (Milroy, 1987). Whatever the methodology adopted and the cultural context in question, the results of studies conducted with adults and adolescents all point in the same direction: the more individuals are integrated, the more they show the typical usage of their community or their peer group (Cheshire, 1982; Russell, 1982; Milroy, 1987; Beaulieu & Cichocki, 2002). The patterns of variation observed within the same community could also result from the frequency of interactions between individuals, as expressed by Bloomfield’s principle of density taken up again by Labov (2001: 228): “[…] the more often people talk to each other, the more similar their speech will be”.
In the field of ethology, much research has been conducted in order to understand young children’s social interactions (Howes, 1987, 1996; Santos & Winegar, 1999; Santos, Vaughn & Bonnet, 2000; Barbu, 2003). Although numerous authors have considered the effects of social interactions on children’s language (Kerswill & Williams, 2000; Labov, 2001; Ochs & Schieffelin, 1995), to our knowledge no research has used quantitative network analysis to study sociolinguistic usage in children. And yet such data are an important piece of the puzzle
in order to understand the factors that can influence sociolinguistic competence, as we shall see in the following section.
1.2. The acquisition of sociolinguistic variables in children
From the inception of sociolinguistics, the acquisition of sociolinguistic variables has given rise to questions among researchers. However, a literature review of first dialect acquisition1 spanning the past forty years (Nardy, Chevrot & Barbu, 2013) has shown that studies on the matter are relatively few and far between and that, until the 1980s, they remained limited to observing the use and evaluation of sociolinguistic variants within a fairly advanced age group, between 10 and 15 years of age (with the exception of Fischer’s pioneering work on the use of an English sociolinguistic variable in children aged 3 to 10). Moreover, these studies were mainly aimed at determining from what age sociolinguistic patterns observed in adults become established in children. Romaine (1984) was the first to move away from this adult-centric approach that leads to interest only being shown in children’s competence when it resembles that of adults. She observed children’s usage in itself and openly asked the question of its acquisition. In this way, she paved the way for the research that has followed, investigating earlier age groups. Finally, certain – mostly recent – studies have added a further dimension by questioning the cognitive processes involved in the acquisition of
sociolinguistic variables (Labov, 1989; Roberts, 1994, 1997; Chevrot, Beaud & Varga, 2000; Foulkes, Docherty & Watt, 2001; Pierrehumbert, 2001; Díaz-Campos, 2004; Foulkes & Docherty, 2006; Smith, Durham & Fortune, 2007; Chevrot & Foulkes, 2013; Nardy et al., 2013).
The literature review conducted by Nardy et al. (2013) provides certain benchmarks that delineate the acquisition of sociolinguistic variables. All the studies that have tested the impact of social background upon the production of sociolinguistic variables tend towards the same result: the higher the position of the family background on the social scale, the more
standard variants children produce. Moreover, this effect is both early and robust because it is first apparent at age 3 and would seem to increase along with development (Chevrot, Nardy & Barbu, 2011). The results concerning gender are more heterogeneous. Certain studies find no impact of this factor on use of variants between ages 2 and 9 in informal situations. Others reveal that between the ages of 3 and 10, girls produce more standard variants than boys in both informal and formal situations. Finally, a third series of studies show that boys between the ages of 3 and 7 use more standard variants than girls. The results concerning children’s stylistic skills converge to show that, in accordance with the observations conducted with adults, children between the ages of 3 and 12 select more standard variants when the context of the dialogue is formal. This skill occurs at an early stage, as children are capable of
selecting variants according to the type of interaction from the age of 3. The studies that have examined how the overall mass of variants produced evolves with age show that standard productions increase between the ages of 6 and 10-12 in formal situations. Under the age of 6, only one study does not find any evolution in productions between the ages of 3 and 4,
whereas the others indicate an increase in non standard variants — and so a decrease in standard variants — as development progresses. This increase in non standard variants observed at early ages could be due to the parental input received by the children. Indeed, work by Foulkes et al. (2005) and Smith et al. (2007) has highlighted that the frequency of standard variants in speech addressed to children by their mother reduces as they grow older. Furthermore, one can also suppose that entering the education system (at roughly 6 years old depending on the country), as well as discovering and learning the written form, may be factors that encourage the increase of standard variants in children’s speech in formal situations (Nardy et al., 2013).
Where the evaluation of sociolinguistic variables is concerned, several studies suggest that judgments based on equating variants with context of use or the speaker’s status are
established between 9 and 12 years of age, depending on the judgment task and the type of variable. Nonetheless, using a simple and intuitive task (indicating which puppet “spoke well”) Nardy (2008) and Barbu, Nardy, Chevrot & Juhel (2013) found judgments in favor of standard variants from as early as 5-6 years of age but only in children from a higher-SES (Socio-Economic Status) background.
Comparing children’s productions and evaluations shows that at 10-12 years of age, the stylistic ability to adapt speech to context is not dependent upon the ability to formulate judgments placing social value on variants (Chevrot et al., 2000). In younger children, Barbu et al. (2013) noted a positive and significant correlation between production and evaluation at 4-5 and 5-6 years of age. Whatever their social background, the children who provided more favorable evaluations of standard variants were also those who produced more of them in formal situations. However, when the authors observed how production and evaluation evolved between 2 and 6 years of age, they noted that progress in judgments favoring
standard variants did not precede progress in their production. This result suggests once again that the early production of variants does not depend on prior knowledge of their
sociolinguistic value. Therefore, rather than supposing that evaluation precedes and influences production, Nardy et al. (2013) consider that implicit familiarization with certain types of variants guides both skills in parallel.
1.3. Unresolved questions and aims of the present study
This summary of the trends in the literature of first dialect acquisition reinforces the hypothesis that sociolinguistic patterns concerning social differences are passed on within the environment through the daily interactions that provide the requisite material for linguistic development (Foulkes & Docherty, 2006). Nevertheless, as underlined by Chevrot & Foulkes (2013), important issues remain to be explored in order to account for these trends. First, the important question of the driving force behind acquisition remains unresolved. Indeed, the
initial results regarding the relationship between evaluation and production mentioned above are only partial. They do not allow us to determine to what extent changes that occur with age in the use of variants result from an awareness of norms and social identities, and to what extent they are due to the implicit learning of statistical regularities encountered in the environment. Moreover, these two modes of learning are not mutually exclusive and the balance between the two could depend on age or the social characteristics of families. Second, the respective influence of children’s spaces of socialization – family, school, peer group – upon the evolution of their sociolinguistic usage remain little known. Certain studies have established a statistical link between the frequency of variants in parents’ speech and their frequency in children between the ages of 2 and 4 (Liégeois, Saddour, Chabanal & Chanier, 2013; Smith, Durham & Richards, 2013). However, the children also go to school where they are in extended contact with the speech of both teachers and peers, potentially from other social backgrounds. Research in psycholinguistics has shown that syntactical complexity in teachers’ utterances can encourage understanding of syntactical structures in children aged around 4 (Huttenlocher, Vasilyeva, Cymerman & Levine, 2002). In the field of
sociolinguistics, a link has been established between attending a socially mixed school and greater stylistic flexibility in girls aged 8 from lower-SES backgrounds (Buson & Billiez, 2009). It is therefore probable that the teacher’s use of variants and their circulation within the peer network influence the acquisition of sociolinguistic competence.
This paper observes two issues that are directly linked to these questions regarding the influence of school attendance and the driving force behind acquisition. First, we ask whether social interactions within the class group and the teacher’s speech influence the production of sociolinguistic variables in 11 children attending the same kindergarten class, observed between the ages of 4 and 5. Second, we ask whether these potential influences result from
learning standard sociolinguistic norms and social roles, or whether they are due to the implicit learning of regularities encountered in the input provided by the teacher or peers.
At both moments of observation in the longitudinal study, different types of data were collected: data regarding linguistic productions, data on the social relationships in the group and data on the evaluation of variants. More specifically, considering these together will allow us to answer the following questions:
- Do children’s productions evolve according to the learning of the prescriptive norms of standard language? A positive answer would suggest that acquisition is guided by awareness of the standard variety of speech.
- Do children’s productions evolve according to the frequency of interactions between individuals, whether peers or the teacher? A positive answer would suggest that acquisition depends on a more mechanical process in accordance with the principle of density
(Bloomfield, 1933; Labov, 2001), which holds that the tendency of speakers to use one linguistic form results from the density of their interactions with other speakers who use it. - Do children’s productions evolve according to interpersonal attraction between peers? A positive answer to this question would suggest that acquisition works through the imitation of liked peers.
2. Method and data 2.1. Longitudinal survey
This study concerns a longitudinal survey of a group of 11 French-speaking children from the same kindergarten class2 and their teacher. The school in question is located in the suburbs of Grenoble, a city in the French Alps with approximately 150,000 inhabitants. Among the 11 children observed, 5 came from families of a lower SES (2 girls and 3 boys) and the 6 others came from higher-SES families (3 girls and 3 boys). The classification of the families
for consultation subject to special permission from each school’s headmaster). The parents’ occupations were classified in accordance with the classification of occupations and socio-professional categories for salaried workers (Insee & Dares, 2003). We gave a score of 1 to the occupations belonging to group 6 within this classification (category of unskilled workers), a score of 2 to the occupations in groups 4 and 5 (category of intermediate
occupations and employees) and a score of 3 to the occupations from category 3 (category of managers and knowledge workers). On the basis of the score assigned to the occupations of both mother and father3, we calculated the mean of the two scores in order to determine an index for each family. The children with a family SES index of 2 or above were classified among the higher-SES category, and those with a family SES index of less than 2 were classified as part of the lower-SES category.
The observations were carried out over approximately two months during school time at two different periods with a one-year interval (P1 and P2). At P1, the children’s mean age was 4;7 and at P2 it was 5;7 (see Appendix 3 for the breakdown of individual ages).
2.2. Linguistic productions
The linguistic data were collected using a naturalistic approach that consisted in recording the children when they communicated within the peer group during the free play period. During this period, which lasts between 30 and 60 minutes, the teacher’s control is slackened and the children are free to choose both their activities and their partners. One after another, the children were all equipped with a wireless VHF unidirectional microphone, which allowed their linguistic productions to be recorded as they moved around. This recording system also allowed us to record the teacher’s utterances, which were audible on the children’s recordings. In all, we collected and transcribed 15.5 hours of recordings for the 11 children, constituting a corpus of 17,943 words4.
The analyses presented here focus on the study of 3 sociolinguistic variables in the French language, the use of which is well-described in adults and teenagers: the optional liaison (see in particular Ågren, 1973; Malécot, 1975; Ashby, 1981; Encrevé, 1988; Armstrong, 2001; Durand & Lyche, 2008), the optional deletion of /R/ in word post-consonantal final position and in the expression parce que ‘because’ (Laks, 1977, 1980; Armstrong, 2001) and the optional deletion of /l/ in the clitic pronouns il(s) ‘he’/’they’ and elle(s) ‘she’/’they’ (Laks, 1980; Armstrong, 1996; Howard, 2006). For these 3 variables, the speakers have the choice between 2 types of production: the standard variant in which the consonantal segment is realized, and the non standard variant in which it is not. A review of studies looking at these 3 variables has shown that they are all sociolinguistic markers in the Labovian sense of the term (Nardy, 2008). Table 1 illustrates each of these variables with extracts from the children’s productions.
Table 1. The study variables (standard and non standard variants and examples)
Optional liaison
Standard variant
(the liaison consonant [t] is realized)
[sɛtamwa] c'est à moi ‘it’s mine’ (Medhi, P1)
Non standard variant (the liaison consonant [t] is not realized)
[sɛɑ̃kɔʁplybo] c'est encore plus beau ‘it’s even more beautiful’ (Romain, P2)
/R/ in word post-consonantal final position and in the expression parce que ‘because’
Standard variant
(the consonant [ʁ] is realized)
[ʒɑ̃ɛdeʒamikatʁ] j'en ai déjà mis
quatre ‘I already put 4’ (Amandine,
P2) Non standard variant
(the consonant [ʁ] is not realized)
[savaɛtʒoli] ça va être joli ‘it’s going to be pretty’ (Rémi, P1)
/l/ in the clitic pronouns il(s) ‘he’/’they’ and elle(s) ‘she’/’they’
Standard variant
(the consonant [l] is realized)
[ilvwaynptitsuʁi] il voit une petite
souris ‘he can see a little mouse’
(Jeanne, P1) Non standard variant
(the consonant [l] is not realized)
[isɔ̃tɔ̃belede] ils sont tombés, les dés ‘the dice, they fell’ (Yassine, P2)
For certain children, the total number of occurrences for each single variable is very low. Indeed, observing the number of occurrences per individuals for each variable at the two periods, we notice that 25% of them are lower or equal to 10 (cf. Appendix 2). Since the three
variables have a similar status as sociolinguistic markers in both adults and adolescents, we grouped them together to calculate individual percentages of standard variants based on a sufficient number of occurrences per period. Inter-rater agreement between two transcribers, calculated on 20% of the occurrences of the variables, gave an excellent transcription
agreement coefficient (Cohen's kappa : κ = 0.9309, p < 0.0001) (Cucchiarini, 1996). Our linguistic analyses were not only carried out on individual scores for production of standard variants. In order to test certain hypotheses, we calculated the “production distance” index between pairs of individuals. This corresponds to the absolute value of the difference between the rates of standard variants produced by an individual X and the rate of standard variants produced by an individual Y5. A low distance indicates that a pair of children had close sociolinguistic usage. A greater distance indicates that their usage was further apart. 2.3. Relationship network in the group
In order to understand the relationship network of the group of children within the class, we borrowed one method from animal and human ethology, and another method from sociometry. The first relies on direct observation of social interactions while the second is based on individuals’ statements about interpersonal attraction.
2.3.1. Direct observation of social interactions
Instantaneous scan sampling is a method of direct observation of social interactions developed in the field of ethology. It allows the nature and frequency of interactions of a group in activity to be evaluated (Altmann, 1974; Santos et al., 2000). It consists in repeatedly observing all the members of a group at regular time intervals of a given length.This
recording of successive states makes it possible to quantify the time individuals spend doing one activity or another, or behaving in one way or another (Strayer & Gauthier, 1985). In the case at hand, two forms of social behavior were observed: physical proximity – noting the child’s two closest neighbors observed within a perimeter of an arm’s length (Hinde, Titmus,
Easton & Tamplin, 1985; Santos et al., 2000) – and verbal interactions. These observations carried out by the fieldworker were conducted in the classroom during the period of free play, at the same time as the recording of utterances. The fieldworker scanned the group with her eyes every 4 minutes and noted the behavior observed on sociomatrices6. Table 2 shows an extract from a completed sociomatrix with the column representing the sender and the row representing the receiver.In this extract, we can see that Coline was close to Alexia and Cléa but only spoke to Alexia.
Table 2. Extract from a sociomatrix (p: physical proximity, v: verbal production)
Alexia Amandine Cléa Coline
Alexia p
Amandine
Cléa p, v
Coline p p
The compilation of 62 sociomatrices collected at each period of observation then made it possible to identify the frequency of behavior addressed by one individual towards each of the other individuals in the group, as well as the behavior directed towards individuals by each of their peers. This approach allowed us to identify who spent time with whom and who spoke to whom by showing the frequency of proximity and verbal interactions between pairs of
individuals. The frequency of proximity between an individual X and an individual Y thus corresponds to the number of times that X and Y were observed close to each other. As for the frequency of verbal interactions between X and Y, this corresponds to the number of times that X and Y were observed interacting together verbally.
Furthermore, this methodology also enabled us to comprehend the degree to which each individual was socially integrated. For each child, we added together two scores: the number of times the other children addressed the child verbally and the number of times they were
close to the child. A child who was strongly integrated into the group was therefore a child who was often approached and spoken to by the other children.
2.3.2. Reported interpersonal attraction between children
Sociometric methods are defined “[…] as measures of interpersonal attraction among members of a specified group” (Hymel, 1983: 237). Among these, we opted for a rating-scale measure allowing the interpersonal attraction between individuals to be quantified and an indication of their status within the peer group to be provided (Hymel, 1983; Bukowski & Hoza, 1989). We adapted the methodology first developed by Asher, Singleton, Tinsley & Hymel (1979) who put in place a procedure aimed at young children based on showing them photographs of their peers. All the children in our study had to sort the photos of their peers in a box divided into two parts, one showing a smile (☺) and the other showing an unhappy face ( ). They had to put the photos of children they liked in the first box and those they did not like in the second. After this initial classification, the experimenter then asked the children to be more specific about their evaluation. If the photo was placed on the ☺ side, the
experimenter asked: Do you like [name of child on photo] a bit or a lot? If it was placed on the side, she asked: Do you not like [name of child on photo] very much or do you not like him/her at all? Each child thus evaluated all the members of the group by placing them on a
continuum with the two extremes being “like a lot” and “not like at all”, and the intermediate evaluations being “like a bit” and “don’t like very much”. We assigned a score between 0 and 3 to each evaluation category (0: “don’t like at all”, 1: “don’t like very much”, 2: “like a bit”, 3: “like a lot”). On the basis of this data, we then calculated an index of reciprocal
interpersonal attraction between pairs of children. This index was calculated using the following formula: |(score assigned to Y by X + score assigned to X by Y) – (assigned to Y by X) – score assigned to X by Y)|.
The values vary from 0 (the two individuals did not like each other reciprocally) to 6 (the two individuals in the pair liked each other reciprocally). The other possible values for this index are 2 or 4. They reflect less symmetrical interpersonal attraction.
2.4. Evaluation of variants
In order to collect the evaluations of young children on different linguistic variants at the phonological, syntactical and morphological levels (see Appendix 1), we had them carry out an acceptability judgment task (Gordon, 1998; Mcdaniel & Cairns, 1998). During an
individual task, two puppets were made to talk by the experimenter (one produced the standard variant, the other the non standard variant) and the child had to determine which sequence was accurate by stating which puppet had spoken correctly. For each variable, 4 pairs of sequences were presented (i.e. 36 pairs to be evaluated in total): two were in the order standard/non standard and two in the order non standard/standard7. Moreover, the order of each pair of sequences to be judged was random for each child. On the basis of these data, we calculated a percentage of judgments in favor of standard variants as well as an “evaluation distance” between each pair of children, using the same method as for the “production distance”.
3. Results
In an initial section (section 3.1), we observe the evolution of the children’s production of standard variants between P1 and P2, over a year of frequent contact in the school context. In the subsequent sections, we look for explanatory factors that can account for this evolution. We successively examine the potential effect of the following factors: the frequency of social interactions within the group of children measured by scan sampling (section 3.2), the
teacher’s usage and the frequency of interactions between the children and the teacher (section 3.3), the children’s intuitions about the social value of sociolinguistic variants
from sociometry (section 3.5), the social integration of individuals within the group estimated on the basis of the number of times other children address them (section 3.6). We conclude by suggesting and discussing a scenario that could account for the evolution of children’s
production according to all the potential factors of influence. 3.1. Linguistic productions
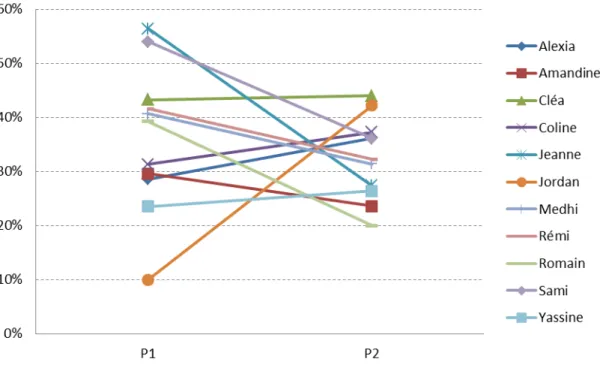
Between P1 and P2, the mean percentage of standard variants produced by the 11 children in the group decreased slightly, going from 36.2% at P1 to 32.4% at P2 (see individual scores in Appendix 3). This decrease did not however reach the alpha value of 0.05 (Wilcoxon: z = -0.978, p = 0.328). Indeed, as Figure 1 shows, the levels of standard variants did not decrease between P1 and P2 for all children: 6 children presented a downward trend (Amandine, Jeanne, Medhi, Rémi, Romain and Sami), 4 presented an upward trend (Alexia, Coline, Jordan and Yassine) and 1 child (Cléa) presented an almost stationary trend.
Figure 1. Rates of standard variants at P1 and P2
This variety of trends led to a convergence of individual scores between P1 and P2. The range of individual scores at P2 [20%, 44%] was therefore lower in comparison with P1
[10%, 56.4%]. This decrease in variability within the group was therefore statistically
significant, as testified by the calculation of the ratio between the variance at P1 (180) and the variance at P2 (57) (F10,10 = 3.14, p = 0.0426)8.
In short, analysis of the children’s linguistic productions showed that during the free exchanges within the peer group, after a year of frequent contact within the group,
sociolinguistic usage converged. Sociolinguistic productions did not progress towards more standard usage but rather seemed to generally move towards the non standard9.
3.2. Network of interactions within the peer group
In order to test the frequency of social interactions and the sociolinguistic behavior within the peer group, the data collected thanks to the scan sampling were examined in relation to the linguistic productions collected during the free exchanges within the peer group. In this and the subsequent sections, our unit of analysis is the pairs of individuals. By pairs of
individuals, we mean all 11 children in the group taken two by two10, i.e. 55 pairs.
The two bivariate graphs below (Figure 2) represent the 55 pairs of children according to their production distance (abscissa) and the frequency of their verbal interactions (ordinate) at P1 and P2.
Figure 2. Bivariate representation of the frequency of verbal interactions and the production distance of the pairs of children at P1 and P2.
The frequency of verbal interactions observed between the children of each pair was not substantial at either period under consideration. They ranged from 0 to 15 at P1 and from 0 to 14 at P2 (see Appendix 4) for the frequency of interactions per pair of individuals at P1 and P2). As for the frequency of proximity – not represented on the graphs –, they spanned a larger range from 0 to 74 at P1 and from 0 to 40 at P2 (see Appendix 4). As expected, there was a positive and significant correlation between the frequency of verbal interactions and the frequency of proximity (at P1: Rho = 0.791, p < 0.0001; at P2: Rho = 0.731, p < 0.0001). Indeed, the children who interacted verbally were situated next to one another.
Examining the relation between the production distance and the frequency of verbal interactions at P1 showed a weak but significant correlation between these two measures (Rho = -0.284, p = 0.036). The greater the number of verbal interactions between two individuals, the closer their sociolinguistic usage (in other words, the lower their production distance). This result remained a statistical tendency when we replaced frequency of verbal interactions with frequency of proximity (Rho = -0.252, p = 0.063).
Detailed analysis showed that at P1, during the moments of observation, 37 pairs of individuals out of 55 did not have any verbal interactions (cf. Figure 2). The distribution of frequency of verbal interactions therefore brought two categories of pairs to the fore: those whose members were observed speaking to one another (frequency of verbal interactions ≥ 1; 18 pairs of children) and those who were never observed interacting verbally (frequency of verbal interactions = 0; 37 pairs of children). By contrasting the mean production distance of the 18 pairs of children who interacted verbally (11.4) with that of the 37 pairs of children who did not (17.8), we saw that the children who spoke to one another had a significantly lower production distance than those who did not (Mann-Whitney: U = 216.000, p = 0.035). It should also be noted that we found the same pattern of results for frequency of proximity. The mean production distance of the pairs of children who spent time near one another was
significantly lower than that of the pairs of children who did not (13.4 versus 19.7; Mann-Whitney: U = 234.000, p = 0.042). At P2, no significant correlation was observed, whether between production distance and frequency of verbal interactions (Rho = 0.014, p = 0.920), or between production distance and frequency of proximity (Rho = 0.135, p = 0.319). Moreover, at this point in the longitudinal study, observation of the data showed that the children
interacted verbally with a greater number of partners (only 21 pairs did not interact verbally against 37 at P1). Contrasting the production distances of the pairs of individuals who did not interact verbally (9.2) with those who did (8.9) established no significant distance between the means (U = 347.500 p = 0.869). Where the frequency of proximity at P2 was concerned, only 3 pairs of individuals did not have any contact. This imbalance between the pairs of
individuals who had no contact (n = 3) and the pairs of individuals observed close to one another (n = 52) did not allow comparison of the means of production distance.
In sum, at P1 – but not at P2 – we observed a relationship between the patterns of
interaction and linguistic usage. The children who spoke to one another and were in contact with one another showed more similar use of sociolinguistic variants.
3.3. The teacher’s usage of sociolinguistic variants
Another factor that could account for the convergence between the children’s usage is the impact of the teacher’s speech. Indeed, children’s productions could converge due to an overall and homogeneous influence of the teacher’s speech on the class group. Furthermore, this influence might also be heterogeneous due to the fact that the frequency of interaction between teacher and child differs depending on the child. We therefore examined whether there was a correlation between, on the one hand, the frequency of verbal interactions between each child and the teacher and, on the other, their production distance.
First, it should be noted that the teacher’s usage of variants was stable between the two observation periods (42.4% of standard variants produced at P1 and 41.7% at P2) and that
they were greater than the mean for the group of children (36.1% at P1 and 32.4% at P2). There was therefore no overall convergence of children’s usage with that of the teacher. Indeed, if this had been the case, we would have seen an increase in the levels of standard variants produced by the children between P1 and P2 in the direction of the teacher’s levels of use, closer to the standard.
Second, examining the frequency of verbal interactions between each child and the teacher in relation to their production distance did not reveal any significant correlation between these two measures (at P1: Rho = -0.310, p = 0.366; at P2: Rho = -0.458, p = 0.183). The same lack of link was observed where the frequency of proximity and the production distance between the children and the teacher were concerned (at P1: Rho = 0.009, p = 0.979; at P2: Rho = -0.189, p = 0.579). The children’s sociolinguistic behaviors were therefore not linked to how frequently they interacted with the teacher.
In short, our analysis of the data did not indicate any influence of the teacher’s speech on either the children’s production or its convergence between P1 and P2, whether in a
homogeneous fashion throughout the group or through individual teacher-child interactions. 3.4. Evaluation of variants
Another factor that could account for the convergence of sociolinguistic productions is the change in normative awareness between P1 and P2. Indeed, under the influence of school attendance or their peers, it is possible that the children valorize certain types of variants and alter their productions accordingly. The convergence of production would therefore be the result of convergence in evaluation. By analyzing pairs of individuals, we checked whether there was a link between production distance and evaluation distance. In other words, we asked whether individuals whose usage was close also shared similar evaluations.
The mean percentage of judgments in favor of standard variants (cf. Appendix 3) remained almost identical between P1 (55.1%) and P2 (54%) (Wilcoxon: z = 1.070, p = 0.284).
Moreover, no convergence of evaluation scores was noted between P1 and P2. On the
contrary, the dispersion increased between P1 (variance = 97.36) and P2 (variance = 167.35), even though the development was not significant as shown by the non significance of the ratio between the variances (F10,10 = 1.72, p = 0.202). Finally, examining the production distances for the pairs of children in relation to their evaluation distances did not show any significant correlation at P1 (Rho = 0.014, p= 0.916) or at P2 (Rho = 0.130, p = 0.343).
In short, our analysis of the data did not indicate any link between the normative evaluation of sociolinguistic variants by the children and the evolution of their production between P1 and P2.
3.5. Interpersonal attraction between children
We also examined the data collected using the sociometric approach (interpersonal attraction reported to the investigator on the basis of photographs of peers) in relation to the linguistic data collected. We looked at whether the convergence of productions between P1 and P2 was the result of children imitating the most-liked individuals.
There was a positive and significant correlation between the reciprocal interpersonal attraction index calculated at P1 and at P2 (Rho = 0.324, p = 0.016). The relationships of interpersonal attraction between the pairs of children therefore appeared to be relatively stable between P1 and P2. However, when the production distance of the pairs of children was linked to the reciprocal interpersonal attraction index, no correlation appeared whether at P1 or at P2 (at P1: Rho = 0.052, p = 0.705; at P2: Rho = -0.030, p = 0.830).
In short, the data therefore did not show any link between the degree of interpersonal attraction between two individuals and how close their linguistic usage was.
3.6. Social integration within the peer group
As outlined earlier, the social integration index that we calculated for the 11 children in the group translated how attractive they were to others as shown by the scan sampling. Children
who were strongly integrated into the group were children who were often approached and spoken to by their peers. We examined this index in relation to the rates of the use of standard variants during free exchanges within the peer group.
At P1, a tendency was seen between these two measures (Rho = -0.591, p = 0.061). The more socially integrated individuals were, the less they produced standard variants and consequently the more they produced non standard variants.
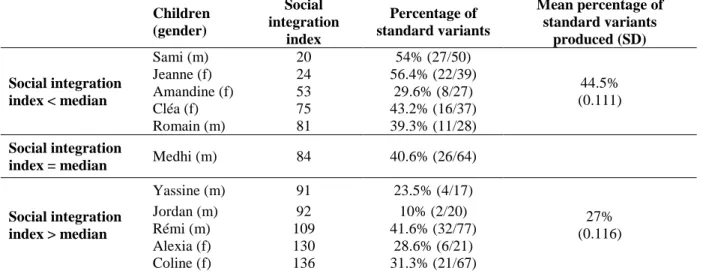
In order to observe this link in more detail, we divided our sample of children into two groups. The first corresponded to the children with an integration index above the median for all the integration indices (median = 84). The second was composed of the children with a social integration index below the median. In order to guarantee that the two groups could be clearly contrasted, the child whose social integration index corresponded to the median was not included in either group. Table 3 provides the individual indices for social integration and standard variants at P1 as well as the mean percentages produced by the two groups of
children defined in relation to the median.
Table 3. Index for social integration within the group and percentages of standard variants produced at P1 (individual indices, means, SD)
Children (gender) Social integration index Percentage of standard variants Mean percentage of standard variants produced (SD) Social integration index < median Sami (m) 20 54% (27/50) 44.5% (0.111) Jeanne (f) 24 56.4% (22/39) Amandine (f) 53 29.6% (8/27) Cléa (f) 75 43.2% (16/37) Romain (m) 81 39.3% (11/28) Social integration
index = median Medhi (m) 84 40.6% (26/64)
Social integration index > median Yassine (m) 91 23.5% (4/17) 27% (0.116) Jordan (m) 92 10% (2/20) Rémi (m) 109 41.6% (32/77) Alexia (f) 130 28.6% (6/21) Coline (f) 136 31.3% (21/67)
We can note that the children with a social integration index above the median produced significantly less standard variants (27%) than those who were less socially integrated in the group (44.5%) (Mann-Whitney: U = 3.000, p = 0.047).
Table 4 gives the individual indices of social integration and standard variants at P2 as well as the mean percentage of standard variants produced by the two groups of children defined in relation to the median. Between P1 and P2, each child’s degree of social integration within the group changed. There was no correlation between the integration indices at P1 and at P2 (Rho = -0.103, p = 0.757). With the exception of Jeanne and Cléa, whose social integration indices were among the lowest at P1 and at P2, and Coline and Rémi whose indices were among the highest at P1 and P2, the degree of integration had changed for all the other children. Moreover, the dispersion of indices had reduced significantly between P1 (variance = 1422.855) and P2 (variance = 225.673) (F10,10 = 6.30; p = 0.003). The children’s social integration was therefore more homogeneous at P2 (range of the integration index: [53-97]) than at P1 (range: [20-136]).
Table 4. Index for social integration in the group and percentages of standard variants produced at P2 (individual indices, means, SD)
Children (gender) Social integration index Percentage of standard variants Mean percentage of standard variants produced (SD) Social integration index < median Cléa (f) 53 44% (22/50) 34.3% (0.083) Medhi (m) 55 31.4% (16/51) Yassine (m) 56 26.4% (14/53) Jeanne (f) 59 27.4% (20/73) Jordan (m) 63 42.2% (27/64) Social integration
index = median Alexia (f) 65 36.2% (21/58)
Social integration index > median Coline (f) 78 37.2% (35/94) 29.8% (0.077) Rémi (m) 79 32.3% (10/31) Sami (m) 85 36.1% (13/36) Romain (m) 86 20% (9/45) Amandine (f) 97 23.6% (21/89)
Examining the indices for social integration at P2 in relation to the scores for the
production of standard variants showed that the correlation was no longer significant (Rho = -0.527, p = 0.113). As table 4 shows, the children who were most socially integrated, with a social integration index above the median, produced slightly less standard variants than the less integrated children: 29.8% for the first, against 34.3% for the second. However, this difference was not significant (Mann-Whitney: U = 9.000, p = 0.464).
In short, the individuals who were most integrated into the group of children were those whose usage was the least standard, as is generally the case in adults. However, this tendency was only recorded at P1.
4. Discussion and conclusion
One of the major questions regarding large-scale linguistic change is to determine the linguistic, social and cognitive factors that are involved in the selection and propagation of variants (Labov, 1994, 2001; Hruschka, Christiansen, Blythe, Croft, Heggary, Mufwene, Pierrehumbert & Poplack, 2009; Labov, 2010). Our study had a similar aim on a reduced sociological and temporal scale. Indeed, we focused on examining the social and linguistic factors that could potentially account for the evolution in the choice of sociolinguistic variants noted in a group of 11 children aged 4-5 years, observed at the beginning and end of a period of a year during which they were in daily contact with one another at school.
4.1. Summary of the main results
The key result shows that after a year of frequent contact in the school context, the children’s production scores for sociolinguistic variants converged during spontaneous interactions within the peer group. We explored several factors that could potentially be behind this convergence.
Regarding the relationship between the production of variants and the frequency of interaction within the group, established through direct observation, the children who
interacted verbally at P1 – who were the same children who spent time with each other – had more similar usage of the sociolinguistic variables than those who did not interact with one another. Moreover, still at P1, 36% of the pairs of children (20 pairs out of 55) did not have any close contact and 67% of the pairs of children (37 pairs out of 55) did not speak to one another. At P2, the network of social interactions of the children in the group had become more homogeneous. Indeed, only 5% of the pairs of children (3 pairs out of 55) had not been in contact with one another and 38% (21 pairs out of 55) has not interacted verbally.
Moreover, at P2, the similarity in sociolinguistic production was no longer linked to the frequency of verbal interaction.
The children’s usage did not converge towards that of the teacher, more standard than the children’s, but rather towards the non standard. Moreover, there was no correlation between the frequency with which each child interacted with the teacher and the similarity of their sociolinguistic behavior, whether at P1 or at P2.
Individual intuition about standard sociolinguistic norms – measured using a variant acceptability judgment task – did not account for the convergence of productions either. Individual evaluations did not converge between P1 and P2, and the group means remained almost identical at both observation periods. This result was confirmed by the analysis of the pairs of individuals: the children with close sociolinguistic usage were not necessarily those who had similar evaluations.
The interpersonal attraction between individuals, recorded using a sociometric task, did not appear as a factor for sociolinguistic convergence. They remained relatively stable between P1 and P2 and the degree of reciprocal interpersonal attraction within the pairs of individuals was not linked to their sociolinguistic behavior.
Finally, calculating an individual social integration index, based on the direct observation of how much individuals were approached (physically or verbally) by their peers, showed that
at P1 the children who were most approached produced less standard variants than the rest of the group. At P2, this pattern was no longer observed. Moreover, a decrease in the dispersion of scores for social integration between P1 and P2 suggests once again a homogenization of social interactions within the group.
4.2. A scenario accounting for convergence within the peer group
All these results taken together can allow us to put forward a potential explanatory scenario for this convergence, in which the sociolinguistic changes that we observed reflect changes in the structure and frequency of interactions within the group of children. This scenario
accounts for the convergence of sociolinguistic behavior during the school year in which the children were in frequent contact with one another, without including the factors that proved to be independent from the children’s productions, i.e. intuition about the correctness of variants, the influence of the teacher and the imitation of liked peers.
At the first period of observation, the social interactions within the group were focused: certain children often interacted with a limited number of individuals; others never interacted with one another. The children who interacted together mutually influenced one another in terms of usage of sociolinguistic variants, while those who did not interact together did not influence one another. This gave rise to the relationship between the frequency of verbal interactions and the use of variants that was recorded at the beginning of the period of
observation. Of course, our protocol does not allow us to rule out the opposite hypothesis, i.e. that children with similar usage of sociolinguistic variablestend to interact together more often.
A year later, at the second period of observation, the interactions had become more homogeneous within the group and each child interacted with more partners. In this new configuration of relationships between individuals, variants “circulate” more within the group, and each individual’s usage influences all the other individuals. This generalization of
influences has two consequences. On the one hand, it leads to the homogenization, and therefore overall convergence, of the children’s usage. On the other hand, it means that the relationship between frequency of verbal interactions and sociolinguistic usage disappears. Indeed, the differences between the individual scores for standard variants decreased and the division of the group into preferential sub-groups tended to fade away.
In this scenario, the individuals who are most integrated into the group exert a particular influence on their peers. Indeed, we noted that they used more non standard variants. It therefore follows that their general influence leads to the overall mass of variants within the group converging towards the non standard and this was precisely the evolution that we observed between the first and second observation time.
This suggested scenario argues in favor of a process of convergence that is grounded in individuals reproducing variants that they have heard within the context of peer interactions. The final discussion will look at the nature of this process, and the underlying motivation. 4.3. The nature of the convergence
As with other types of verbal adaptation to the interlocutor, the different phenomena of convergence can be characterized according to their temporal scale (Hinskens, Auer & Kerswill, 2005). First, speakers converge in the short term at the level of an interaction, by temporarily using the same linguistic forms and functions (Giles & Powesland, 1975; Garrod & Pickering, 2004; Pardo, 2006 inter alia). Second, speakers converge in the long term at the level of a community, within social strata (Labov, 1972 inter alia), within a network (Labov, 1972; Russell, 1982; Milroy, 1987; Beaulieu & Cichocki, 2002) or in new situations of language contact or dialects, such as the cohabitation of people living in a new town who originate from different areas (Kerswill & Williams, 2000). Third, speakers converge in the medium term at the level of a collective group with daily contact. Although this intermediate level is the least documented of the three, Pardo, Gibbons, Suppes & Krauss (2012) have
highlighted phonetic convergence through the academic year among previously unacquainted pairs of college roommates. This appears after around 1.5 months of cohabitation and
correlates with the strength of the social link reported by the individuals. Of these three temporal scales, our longitudinal study over a year was not concerned by the long term. However, the question remains as to whether or not the notions of short- and medium-term convergence can account for what we observed.
A first explanation for the homogenization of usage of sociolinguistic variants would be to accept that the children learnt to converge in the short term. We can suppose that at the second observation period, the 11 children had acquired the capacity to make their use of variants similar to that of their interlocutor during each interaction whereas they did not yet have this ability at the first period of observation. Because the most-approached individuals in the group used more non standard variants (section 3.6), the sum of convergence per pair could therefore have produced both the homogenization of usage and the shift in scores towards the non standard. This hypothesis is founded, as evidence already exists for this kind of adaptation at an early age. From the ages of 7-12 years, children do indeed adapt the
amplitude of their voice to that of an animated persona (Coulston, Oviatt & Darves, 2002) and tend to align the vocabulary and descriptive schema that they use during a verbal task carried out in pairs (Garrod & Clark, 1993). However, this hypothesis does not fit very well with two further aspects of our data. First, each child’s standard variant score was calculated on the basis of the addition of samples of speech addressed to several peers11. For this reason, the fact that scores tended towards the non standard demonstrates the general sociolinguistic usage of individuals within the group more than it demonstrates these individuals’ usage during particular interactions with a specific interlocutor. Second, short-term convergence is sensitive to certain psychosocial factors such as the relative status of the interlocutors (Krauss & Pardo, 2004; Pardo, 2012). However, our analyses failed to show any influence of the
degree of interpersonal attraction between children upon the convergence observed (section 3.5).
It is therefore highly probable that the phenomenon described in the group of children was a medium-term convergence arising on the basis of daily contact, as described by Pardo et al. (2012). However, in their study, the college students’ changes in pronunciation after contact with their roommates continued aside from interactions with these roommates. Indeed, the convergence was established on the basis of samples of speech collected during recording sessions that were separate from the situations of interaction between roommates. Where the present study is concerned, Nardy (2008) recorded the same 11 children at exactly the same longitudinal periods in another situation, where each one had to tell a story to an unfamiliar adult on the basis of a story book. She calculated the individual percentages of standard variants on the basis of the same sociolinguistic variables as within the peer group. As with the peer group, the mean scores in a narrative situation shifted towards the non standard between P1 (58.3%) and P2 (38.5%), with the difference being marginally significant
(Wilcoxon: z = -1.778, p = 0.075). However, no decrease in variance or in the range of scores was shown between the two observation times (P1: variance: 454 and range: [22% - 86%]; P2: variance: 415 and range: [13% - 75%]; F10,10 = 1.09, p = 0.447). The convergence observed when the children spoke among themselves was not observed outside the group. This characteristic sets this convergence apart, at least to some extent, from the phenomenon described by Pardo et al. (2012). It would therefore seem that between the beginning and end of the longitudinal follow-up, the children learnt to adopt homogeneous usage of the
sociolinguistic variables linked specifically to the situation of peer interaction. More generally, we know that children use more non standard variants when speaking with other children as opposed to with adults. Roberts (1994) has highlighted this stylistic skill from as early as 3-4 years of age in English-speaking children. Martin, Chevrot & Barbu (2010) have
described it for the same sociolinguistic variables in French as the present study with a child of 10 years of age, recorded with his parents and siblings. In addition to these known facts, our results show that this skill may be established at an early age under the pressure of the peer group, through the influence of its most socially integrated members.
An early influence of peers upon sociolinguistic competence is not surprising as such influences have been observed in other aspects of childhood life. In the field of general linguistic abilities (receptive and productive skills including grammar, vocabulary and narrative discourse), Justice, Petscher, Schatschneider, Mashburn & Mashburn (2011) have established a link between preschool children’s progress over a school year and the level of language of the peers attending the same class. In the field of social cognition, Haun & Tomasello (2011) have shown that 4-year-old children prefer to express a judgment that goes against their perception but is in line with that of peers present. Finally, in the field of social behavior, Barbu (2006) has shown that children’s behavioral profiles (i.e. ways of interacting with peers: approaches, contacts, withdrawals, facial expressions, gazes, gestures, vocal and verbal utterances) converge during the school year in children of 4-5 years of age attending the same kindergarten class. It is therefore probable that the peer group influences and homogenizes how children interact and communicate at an early stage. The question at stake is therefore understanding the driving force behind this influence in the present study. 4.4. The driving force behind the convergence
Two types of mechanisms could potentially explain the phenomena of convergence (Martin et al., 2010). First, mechanisms of a psychosocial nature based on the images projected on to interlocutors, variants and situations. Mechanisms of this kind are central in approaches that look at stylistic adaptation in terms of social signification and motivation: Communicative Accommodation Theory (Giles & Powesland, 1975), Audience Design Theory (Bell, 1984), Acts of Identity Theory (Le Page & Tabouret-Keller, 1985),
Interactional Sociolinguistics (Gumperz, 1982). In this framework, convergence is a communicative device by which interacting individuals reduce interpersonal differences, express solidarity or intimacy, reactivate a shared identity, etc. Second, cognitive mechanisms that automatically link perception and production can also account for convergence. The interactive alignment model (Garrod & Pickering, 2004) is typical of this kind of explanation. It is based on the idea that the participants in a conversation automatically align the cognitive representations involved in several aspects of language, including forms, meaning and
functions. This automatic convergence allows the participants to establish implicit common ground, reduce cognitive load and facilitate mutual understanding. The process is unconscious and non-negotiated and its cognitive basis is that the linguistic forms used by the listener are primed by the forms used by the speaker. Although these two types of explanation have been put forward to account for short-term convergence, they can also be extended to other scales. For example, the principle of density (Labov, 2001) extends an explanation linking
production and perception to long-term changes.
In the present study, it turned out that none of the factors directly involving social
signification or motivation were linked with the production of variants in the 11 children. The young children did not seem to imitate the speakers who serve as models, whether the teacher (section 3.3) or peers that they stated they liked (section 3.5). Nor did they seem to speak in keeping with their intuition about the correctness of the variants according to standard
sociolinguistic norms (section 3.4). Among non-linguistic factors, only the frequency of social interactions was linked to the selection of variants. The children who spent more time together spoke more similarly (section 3.2) and those who were most approached (verbally and
physically) by their peers produced less standard variants (section 3.6). This pattern of results underpins a conception in which the usage of variants result from implicit interpersonal influences grounded in the relationship between production and perception. These influences
are passed on by the network of interactions and therefore changes in this network lead to changes in sociolinguistic production, as mentioned when we outlined the scenario accounting for the changes that occurred within the group (section 4.2).
However, this explanation requires two comments. First, work in “third wave” variation has suggested that the social meaning of variants is diverse and flexible (Eckert, 2012). One cannot rule out the possibility that social values other than correctness contribute to the shift of sociolinguistic usage towards non standard norms, in addition to the effect of frequency of social interactions. Second, this explanation does not eliminate the indirect action of factors related to social signification and motivation. As Labov (2001) supposes regarding linguistic change, it is such factors that determine the interlocutors chosen by speakers as well as their tendency to talk more or less, and that therefore model their linguistic influence in the network of interactions. Moreover, within the framework of the class, the children are
constantly confronted with the teacher’s speech, oriented towards the standard, and the speech of their peers, drawn towards the non standard by individuals who hold central positions within the group. For this reason, non standard variants, linked in young childhood to moments of informal exchanges between parents and children (Smith et al., 2013), can
become a wider symbol of nonconformity, implicitly associated with popular individuals who resist the demands of the institution. Our study therefore suggests that the key role played by nonconformity in linguistic change (Labov, 2001) could be partly rooted in exchanges between peers within school.
Appendix 1. Variables used in the acceptability judgment task Variable Pairs of utterances to be judged
M o rp h o lo g ic a l le v el Presence/absence of the negation particle ne
Ce n’est pas grave / C’est pas grave ‘It doesn’t matter’ Ça ne fait pas mal / Ça fait pas mal ‘It doesn’t hurt’
Je n’ai pas de chaussettes / J’ai pas de chaussettes ‘I don’t have any socks’ Je n’ai pas le temps / J’ai pas le temps ‘I don’t have the time’
Alternation between clitic object pronouns
y/le, la, les
Je l’ai fait tout seul / J’y ai fait tout seul ‘I did it on my own’ Je l’ai déjà vu / J’y ai déjà vu ‘I’ve already seen it’
Il le fera demain / Il y fera demain ‘He’ll do it tomorrow’ Il l’a dit tout à l’heure / Il y a dit tout à l’heure ‘He said it earlier’
P h o n o lo g ic a l le v el Presence/absence of /R/ in post-consonantal word-final position and of /R/ in parce que
Une fenêtre fermée / Une fenêt’ fermée ‘A closed window’
Je regarde les nuages parce qu’ils sont jolis / Je regarde les nuages pace qu’ils sont jolis ‘I’m looking at the clouds because they are pretty’
Des billes, j’en ai quatre / Des billes, j’en ai quat’ ‘I’ve got four marbles’ Ferme la fenêtre ! / Ferme la fenêt’ ! ‘Shut the window’
Realization/non realization of the optional liaison
C’est [t] un pyjama / C’est Ø1 un pyjama ‘These are pyjamas’ Il est très [z] embêté / Il est très Ø embêté ‘He feels very bad’ Le petit [t] oiseau / Le petit Ø oiseau ‘The little bird’
Tu vas [z] aller à l'école /Tu vas Ø aller à l'école / ‘You’re going to go to school’ S y n ta ct ic a l le v el Alternation between "ce que/"qu’est-ce que" in subordinate clauses
Regarde ce que je viens d’acheter au marché / Regarde qu’est-ce que je viens d’acheter au marché ‘Look what I just bought on the market’
Regardez ce que je fais / Regardez qu’est-ce que je fais ‘Look what I’m doing’
Regarde ce que j’ai / Regarde qu’est-ce que j’ai ‘Look what I’ve got’ Tu feras ce que tu voudras / Tu feras qu’est-ce que tu voudras ‘Do what you want’
Absence/presence of "est-ce que" in subordinate clauses
Je sais où elle est / Je sais où est-ce qu’elle est ‘I know where she is’
Je sais quand Pierre va venir / Je sais quand est-ce que Pierre va venir ‘I know when Pierre is going to come’
Je sais comment c’est fait / Je sais comment est-ce que c’est fait ‘I know how it’s made’
Je sais pourquoi Marie est partie / Je sais pourquoi est-ce que Marie est partie ‘I know why Marie left’
Alternation
between"qui + Verb"/"
c’est qui qui + Verb" in
interrogative clauses
Qui a renversé le pot ? / C'est qui qu'a renversé le pot ? ‘Who tipped the pot over?’
Qui a dessiné ça ? / C’est qui qu’a dessiné ça ? ‘Who drew that?’
Qui a perdu ses lunettes ? / C’est qui qu’a perdu ses lunettes ? ‘Who lost their glasses?’
Qui a mangé le chocolat ? / C’est qui qu’a mangé le chocolat ? ‘Who ate the chocolate?’
Alternation between "X + est"/c’est + X" in subordinate clauses
Tu sais pour qui est le cadeau ? / Tu sais c'est pour qui le cadeau ? ‘Do you know who the present is for?’
Tu sais ce que c’est ? / Tu sais c'est quoi ? ‘Do you know what it is?’ Tu sais où est la patinoire ? / Tu sais c’est où la patinoire ? ‘Do you know where the ice-skating rink is?’
Tu sais où est le magasin de chaussures ? / Tu sais c’est où le magasin de chaussures ? ‘Do you know where the shoe shop is?’
Alternation between dont/que in relative clauses
Voilà la fille dont je te parle / Voilà la fille que je te parle ‘That the girl I’m talking about’
C’est l’histoire dont je me souviens / C’est l’histoire que je me souviens ‘It’s the story I remember’
Le garçon dont je me moque a les cheveux verts / Le garçon que je me moque a les cheveux verts ‘The boy I’m laughing at has green hair’
La fille dont je te parle est gentille / La fille que je te parle est gentille ‘The girl I’m talking about is nice’
Appendix 2. Occurrences of standard variants/total number of occurrences (standard + non standard variants) for each variable and for the combined variables
Children P1 P2 Optional liaison /R/ /l/ Combined variable Optional liaison /R/ /l/ Combined variable Alexia 0/10 1/3 5/8 6/21 2/15 3/9 16/34 21/58 Amandine 0/9 5/7 3/11 8/27 1/44 5/13 15/32 21/89 Cléa 0/13 3/3 13/21 16/37 0/17 6/8 16/25 22/50 Coline 0/25 3/18 18/24 21/67 3/37 4/14 28/43 35/94 Jeanne 2/11 4/11 16/17 22/39 0/26 7/20 13/27 20/73 Jordan 0/3 0/6 2/11 2/20 0/21 0/12 27/31 27/64 Medhi 3/30 7/11 16/23 26/64 0/27 0/5 16/19 16/51 Rémi 0/26 12/19 20/32 32/77 0/12 4/12 6/7 10/31 Romain 0/13 2/4 9/11 11/28 0/19 3/10 6/16 9/45 Sami 0/15 5/5 22/30 27/50 0/10 4/11 9/15 13/36 Yassine 0/7 1/1 3/9 4/17 0/18 8/24 6/11 14/53 Total 5/162 43/88 127/197 175/447 6/246 44/138 158/260 208/644
Appendix 3. Rates (and occurrences in brackets) of standard variants in production (during spontaneous interactions within the peer group) and rates of judgments in favor of standard variants (evaluation) at P1 and P2
Children Gender Age SES Rate of standard variants in production Rate of judgments in favor of standard variants
P1 P2 P1 P2 P1 P2 Alexia f 4;11 5;11 SES - 28.6% (6/21) 36.2% (21/58) 50% (18/36) 38.9% (14/36) Amandine f 4;6 5;6 SES + 29.6% (8/27) 23.6% (21/89) 52.8% (19/36) 86.1% (31/36) Cléa f 4;10 5;10 SES - 43.2% (16/37) 44% (22/50) 44.4% (16/36) 38.9% (14/36) Coline f 4;9 5;9 SES + 31.3% (21/67) 37.2% (35/94) 50% (18/36) 47.2% (17/36) Jeanne f 4;4 5;4 SES + 56.4% (22/39) 27.4% (20/73) 67.6% (23/34) 55.6% (20/36) Jordan m 4;7 5;7 SES - 10% (2/20) 42.2% (27/64) 58.3% (21/36) 55.6% (20/36) Medhi m 4;4 5;4 SES - 40.6% (26/64) 31.4% (16/51) 41.7% (5/12) 57.1% (20/35) Rémi m 4;8 5;8 SES + 41.6% (32/77) 32.3% (10/31) 66.7% (24/36) 55.6% (20/36) Romain m 4;10 5;10 SES - 39.3% (11/28) 20% (9/45) 70% (7/10) 59.4% (19/32) Sami m 4;8 5;8 SES + 54% (27/50) 36.1% (13/36) 58.3% (21/36) 55.6% (20/36) Yassine m 4;5 5;5 SES + 23.5% (4/17) 26.4% (14/53) 45.7% (16/35) 44.4% (16/36) Means (SD) 36.2% (13.4) 32.4% (7.6) 55.1% (9.9) 54% (12.9)