READ THESE TERMS AND CONDITIONS CAREFULLY BEFORE USING THIS WEBSITE. https://nrc-publications.canada.ca/eng/copyright
Vous avez des questions? Nous pouvons vous aider. Pour communiquer directement avec un auteur, consultez la
première page de la revue dans laquelle son article a été publié afin de trouver ses coordonnées. Si vous n’arrivez pas à les repérer, communiquez avec nous à PublicationsArchive-ArchivesPublications@nrc-cnrc.gc.ca.
Questions? Contact the NRC Publications Archive team at
PublicationsArchive-ArchivesPublications@nrc-cnrc.gc.ca. If you wish to email the authors directly, please see the first page of the publication for their contact information.
NRC Publications Archive
Archives des publications du CNRC
This publication could be one of several versions: author’s original, accepted manuscript or the publisher’s version. / La version de cette publication peut être l’une des suivantes : la version prépublication de l’auteur, la version acceptée du manuscrit ou la version de l’éditeur.
Access and use of this website and the material on it are subject to the Terms and Conditions set forth at
Sorption and length-change scanning isotherms of methanol and water
on hydrated portland cement
Feldman, R. F.
https://publications-cnrc.canada.ca/fra/droits
L’accès à ce site Web et l’utilisation de son contenu sont assujettis aux conditions présentées dans le site
LISEZ CES CONDITIONS ATTENTIVEMENT AVANT D’UTILISER CE SITE WEB.
NRC Publications Record / Notice d'Archives des publications de CNRC:
https://nrc-publications.canada.ca/eng/view/object/?id=dde478f2-5a59-45fb-aa30-28740f82bc11 https://publications-cnrc.canada.ca/fra/voir/objet/?id=dde478f2-5a59-45fb-aa30-28740f82bc11Supplementary Paper
III-23
Sorption and Length-Change Scanning Isotherms
of Methanol and Water on Hydrated Portland Cement
Rolf P. Feldman*
Synopsis
The purpose of this work was to investigate the nature and the reversibility of the
CH,OH and H,O isotherms, and to compare their lengthchange and sorption characteristics. These characteristics for water on hydrated portland cement have caused some controversy, due to several complicating features in the isotherm, with regard to the surface properties and stoichiometry of the compounds, and the length change and creep mechanisms.
The development of the present model of hydrated portland cement has been largely based on surface chemical considerations; this involved establishing criteria for distinguishing between chemical and physio-sorbed water. Thedetermination of the stoichio- metry of the tobermorite gel, its water surface area, and its porosity was based on these criteria, and these parameters are among the most important factors related to the phenomena of expansion-contraction and creep, and the mechanical properties, strength and elasticity.
The most important experiments performed using the surface chemical approach have been the sorp- tion and length change isotherms but, as no detailed investigation of the isotherms has been made, their validity and results obtained from them have been assumed to be correct. Results of surface area investi- gations, however, differ markedly from those obtained from nitrogen adsorption, and this has led to some Suspicion of the results.
In a series of papers by the author and co-workers,
(1, 2) a more detailed examination of the isotherms
\
*Division of Building Research, National Research Council
Of Canada, Ottawa, Canada
was started, involving both length change and weight change as function of the vapour-pressure of water; measurements of Young's modulus and relative breaking stress were also made as functions of vapour pressure. The results led the authors to conclude that the surface area of hydrated portland cement was
considerably lower than the accepted value ( ~ 2 0 0
m2/gm), and that inter-layer hydrate water was playing a role in both the length change and sorption isotherms, and in the variation of Young's modulus with rela- tive humidity.
The present work is a further stage in these investi- gations. Detailed cycling and scanning loops were obtained for samples dried at three different condi- tions during the determination of precise length change and weight change isotherms based on numerous data for water and methanol on bottle and paste- hydrated cement.
Results qualitatively confirmed the earlier work, although some assumptions made previously were proved to be not completely correct. The work enabled a revised model for portland cement paste to be made, however, and allowed further evolution of the theory of volume change and suggestions with regard to the creep phenomena.
Experimental
Meterials
The cement used in this work was a type I ; its
composition was reported in a previous paper (1). The cement was hydrated in two ways; paste hydrated for 1 year at a water cement ratio (wlc) of 0.5 and bottle hydrated for a period of 4 months at a w/c ratio of 5.0. The degree of hydration and other pro- perties are shown in Table 1. The bottle-hydrated cement was stored and conditioned in desiccators to
10 to 15 per cent relative humidity (R. H.) using a concentrated NaOH solution. The cast paste cylinders were sliced to 0.05 in. (1.27 mm) thickness and were approximately 1.25 in. in diameter and then stored as above. Compacts were formed at a load of 10,000 lb in a mould 1.25 in. (3.175 cm) diameter from the bottle-hydrated cement. The procedure for making the compacts and the samples has been described previously (2).
The methanol used in this work was purified by making a magnesium iodine Grignard complex by refluxing magnesium turnings and iodine in a large excess of 99 per cent pure methanol. After several distillations, the methanol was distilled directly into the high-vacuum apparatus.
Apparatus
The high-vacuum apparatus used for this work was designed to expose 12 samples simultaneously for long periods to the same vapour pressure conditions, with air excluded. Six of these samples were mounted in individual tubes on quartz spirals of the McBain- Bakr type and gave values of the weight changes to a
sensitivity of 3.0 x gm. The remaining six samples
were mounted on modified Tuckerman optical exten-
someters and placed in individual cells equipped with optical windows (3). This determined the dimensional
changes to a sensitivity of 4 x in./in. A quartz
Bourdon-type spiral gauge was used to measure the vapour pressure to a sensitivity of 1 micron and an absolute accuracy of I0 microns at low pressures.
A three-stage oil diffusion pump backed by a rotary vacuum pump was used to obtain pressures of mm of mercury. The adsorbate was introduced into the system from a bulb immersed in a bath that could be controlled at temperatures down to -45°C within 0.05"C, although most of the pressure readings were taken with the Bourdon gauge. The samples were maintained at 21.3"C within 0.05"C by immersing the lower ends of the tubes and cells containing the samples to a depth of 12 in. in a controlled bath.
Room temperature was controlled at 23°C
+
0.5.Procedure
Two samples measuring 3 by 1 by 0.127 cm were cut from the discs and mounted, one section on the extensometer and the other on the quartz spiral. Samples were degassed by evacuating simultaneously through a manifold. The samples were heated during the evacuation. Three samples of bottle hydrated cement were used and one each was heated a t : 80°C for 3 hours, 85°C for 3 hours, and 95°C for 3 hours plus 1 hour at 96°C. Two samples of hydrated paste were used and one each was heated at: 85°C for 3 hours, and 95°C for 3 hours plus 1 hour at 96°C. Preliminary work using a vacuum electro-balance and thermal balance techniques had established that vacu- um degassing at 85°C for 3 hours with these samples produced the same result for the non-evaporable water as the conventional 'd-drying' procedure. For
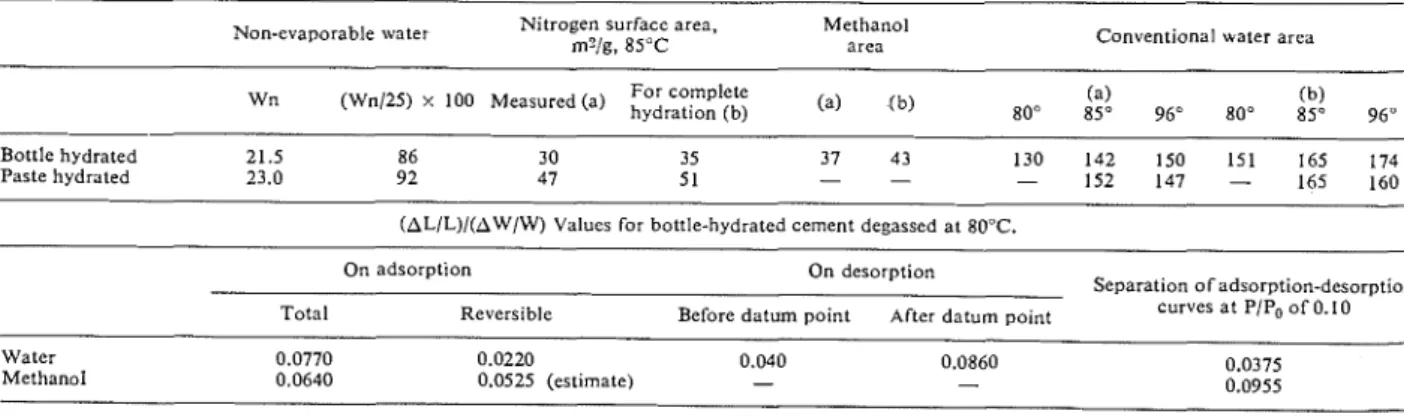
Table 1. Some sorptiotz properties of ~/ze l~ydrated portland cement sarrples Non-evaporable water Nitrogen surface area, Methanol
m?/g, 85°C area Conventional water area
Wn (Wn125) x 100 Measured (a)
~
~
(a)~
(b)~
(a)~
,
(b)P
~
~
~
80" 85" 96" 80" 85" 96"Bottle hydrated 21.5 86 30 35 37 43 130 142 150 151 165 174
Paste hydrated 23.0 92 47 51 - - - 152 147 - 165 160
(AL/L)/(AW/W) Values for bottle-hydrated cement d e ~ a s s e d at 80°C.
On adsorption On desorption
Separation o f adsorption-desorption
Total Reversible Before datum point After d a t u m point curves at PIPo of 0.10
Water
the methanol isotherm, 1 day was generally allowed to attain the desired vapour pressure by control of
for equilibrium between points; for the water isotherm the temperature of the bath in which the adsorbate
from 1 day to as much as 33 days was allowed. Gene- source was immersed, or by introducing or withdrawing
rally 1 to 3 days was found adequate. It took over 10 adsorbate from the manifold and system and measur-
months to determine the whole isotherm. Adsorption ing the vapour pressure. It was found that equilibrium
was effected by allowing the manifold and samples was attained more rapidly with the latter method.
Theory
Adsorption
The isotherm for a given solid gas system should be reversible if there is no irreversible change in the nature of the solid and/or gas, since there thus can be only one equilibrium state at a given vapour pres- sure. This is usually the case at low pressures but at high pressures the problem of primary hysteresis arises. This is usually related to the pore structure of the solid and a change in nature of the adsorbate.
The well-known B. E. T. equation, valid for the
low pressure region, implicitly assumes reversibility and a constant surface area. There is an isotherm, however, referred to as Type C, which has the charac- teristic that the ascending and descending branches only join at very low or zero pressure(4). Type C loops are found with some graphites, clay minerals, and hydrated portland cement (1). This low-pressure hysteresis phenomenon is usually attributed to irre- versible intercalation of adsorbate within the structure of the solid, which usually has a layer structure. Changes in the spacing of some of these layers has been observed (5) by X-ray methods, but unfortuna- tely, due to the disordered nature of the layers of the hydrated silicates in hydrated portland cement, this has not been possible for this material.
Length Change due to Adsorption
The Gibbs' adsorption equation is extremely important in length-change adsorption theory (6), but it has been applied in different ways by various workers and sometimes not justifiably. The equation
'represents the change in free energy of pure adsorbent from its initial state under its own vapour pressure to its combining state, provided that this integral represents a path of thermodynamic reversibility. n is the number of moles of adsorbate on a fixed mass of absorbent. If it is supposed that the constant solid
surface area, o m2/g, has undergone a change in
surface tension, Ay, one can write
AF = oAy (2)
thus
Ay in fact indicates changes in the state of stress of the solid brought about by the interaction of the adsorbed molecule with forces on the solid surface; these forces have placed the solid in a state of compres- sive stress.
The Bangham equation (7) provides a basis for testing Gibbs' equation on solids
where AL/L is the length change of an adsorbent during the reversible adsorption process. From another relation derived by Bangham and co-workers (7), the Young's modulus of the solid material may
be calculated :
where E is Young's modulus of the material, and,
p, in g/cc, is the density. The equation is derived for plates, or infinitely long cylinders, where the only surface is that of the curved surface of the cylinder or the major surface of a thin plate. The latter model might approximate hydrated cement paste. As Gibb's equation requires thermodynamic reversibility it can only be used at low pressures where normal hy- steresis does not occur. If low pressure hysteresis does occur, then this region of the isotherm may be also irreversible. As will be shown later, this is true for hydrated portland cement, but a way has been found to overcome it.
Some authors (8, 9, 10) have used an equation of
the osmotic pressure type and applied it to the low
where AP is suggested as being the pressure of the adsorbed film. This equation can only be valid if the water-hydrated cement system is considered to be a dilute solution, i.e., a change in concentration of water with respect to the adsorbent is not taking place during adsorption o r desorption, and if the adsorbed water is not adsorbed water but bulk water. Both of these assumptions are completely untenable in this region.
In the reversible high-pressure region of the isotherm where capillary condensation has occurred and menisci exist, one might assume that a change in concentra- tion is not taking place, if one defines capillary water as being remote from the surface forces; thus the capil-
lary water in this assumption will also be 'bulk'. The capillary water maintains equilibrium with different vapour pressures by changing the radius of its meni- scus. The water within the range of surface forces, however, will still effect a change in surface free energy with a change in vapour pressure of the system even if one defines it as being constant at two molecular layers. This must be taken into account as in the equations for the capillary region:
and (7)
Results and Discussion
Water Adsorption
The sorption and Length Change Isotherms
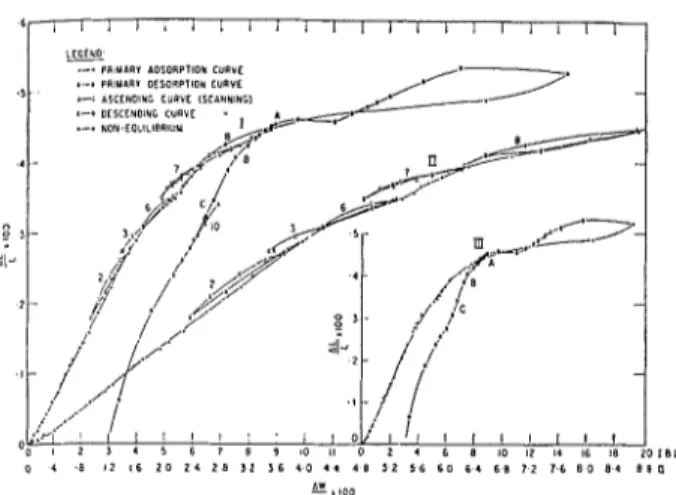
The sorption and length change isotherms for the bottle-hydrated cement degassed at 80°C and 96°C are
shown in Figs. 1 and 2 respectively. Results for a
1 9 - 1 8 - LEGEND .~-"
PRIMARY b O S O R P T l O N CURVE
I I .- .-rn PRIIAARY DESORPTION CURVE
:-: ASCENDING CURVE ISCbNNlNGl
degassing t e m p e r a t ~ ~ r e of 85°C were also obtained, but
are not presented here. They were of a similar nature, but gave a slightly different 'conventional water sur- face area, as is shown in Table 1. In addition, it was observed that the weight of water present (in per cent) on the descending boundary curves of the iso- therm at PIP, of 0.14, for the three temperatures 96", 85" and 80°C, was 8.51, 8.19 and 7.91 per cent respectively. These values were less than 0.5 per cent different from the weight lost on degassing. As the starting condition was only known approximately
21;- / I - 0 '
1
, , , , ,11
, , I , . I I I I I I I 0 1 0 2 0 3 0 4 0 5 0 0 10 2 0 3 0 4 0 5 0 6 0 7 0 8 0 9 0 1 0 0 ;I~ooFig. I . Weight cl~at~ge isotlier17~s for bottle-hydrated portland cetnent cotnpacts: I-degassed at 80°C; 11-degassed at 96°C
(scanning loops tnarked I to 10).
L
--
.-'
PRIMARY ADSORPTIOH CURVE8 - . PRIMARY DtSORPTlOH CURVE -
.-.
LSCENDlHG CURVE ~SCAlllllNG)5 -
I
-
Fig. 2. Length change isotherms for bottle-hydrated portland cement compacts: I-degassed at 80°C; II-degassed at 96°C
(PIP, of 0.10 to 0.15), it must be assumed that practi- cally all the water lost on degassing was regained after the sample had been returned to the starting condi- tion through the PIP, of 0.97. The degassing proce- dure, however, produced an irreversible shrinkage.
A general examination of both length and weight change in the two isotherms shows a large low pres- sure hysteresis formed by what will be called the adsorption (ascending) and desorption (descending) boundary or primary curves. Off the boundary curves are scanning loops, which contain descending and ascending portions. These loops are numbered on Figs. 1 and 2 from 1 to 10, and will be referred to as loop
1,2, etc. It will be observed that the point where the scanning loop left the primary curve was always very close to, if not exactly at, the point where it rejoined the primary curve. This is considered as evidence for good equilibrium. The scanning loops determined for the two isotherms in Figs. 1 and 2 were not the same in all cases; detailed analysis of only the sample degassed at 80°C will be made here, however, and passing reference to the others included.
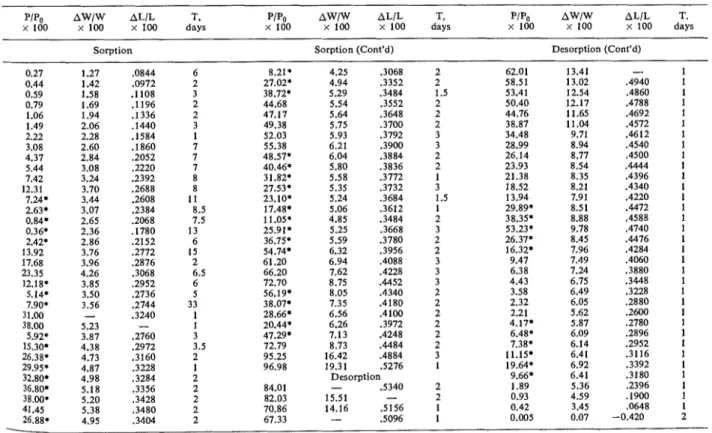
All the experimental points obtained for this sample are shown in Table 2, in the order in which
they were obtained. The points with asterisks are those which have left the primary curves and are of scanning loops, both descending and ascending.
Length and sorption isotherms for one of the paste- hydrated samples, the one that was degassed at 85"C, are shown on Fig. 3. Again the similarity with the other samples is striking, although the extent of the low pressure hysteresis is not as great as for the paste samples. The general form of the primary curves for the paste- and bottle-hydrated samples agrees with that obtained from somewhat fewer data obtained by the authors and co-workers in a previous study (1 l), but the low-pressure hysteresis here is much larger than was obtained in an earlier investigation (1). It will be shown that this is due to the more severe drying used in the present study. No detailed analysis will be made here of the paste samples (Fig. 3), but it was again found that all the water lost on degassing was regained after the sample had been returned to the starting condition through the PIP, of 0.97; the surface areas for water and nitrogen are given in Table I. The areas, corrected for incomplete hydration, vary from 151 to 174 m2/g for the water determination, and are only a bit lower than usually obtained, but,
Table 2. Length change and weight change isotherms for the sample of
bottle-hydrated cement degassed at 80°C
PIPo AWlW ALIL T . PiPo AWlw AL/L T , PIP, AWlW AL/L T.
x LOO x 100 x 100 days x 100 x 100 x 100 days x 1 0 0 x 1 0 0 x 100 days
Sorption Sorption (Cont'd) Desorption (Cont'd)
4.25 .3068 4.94 .3352 5.29 .3484 5.54 .3552 5.64 .3648 5.75 .3700 5.93 .3792 6.21 .3900 6.04 .3884 5.80 .3836 5.58 .3772 5.35 .3732 5.24 .3684 5.06 .3612 4.85 .3484 5.25 .3668 5.59 .3780 6.32 .3956 6.94 .4088 7.62 .4228 8.75 . a 5 2 8.05 .4340 7.35 .4180 6.56 .4100 6.26 .3972 7.13 .4248 8.73 . a 8 4 16.42 .4884 19.31 .5276 Desorption - .5340
1 6 L H
I I
I I
.-.
P R l u L R I b o s o R P ~ l o x CURVE 'I :. .-a PRI!JARY C L S O R P l i O N CURVE
I 2 -
1 0 -
A
I
2
Fig. 3. Weight cl~ange (I ) and length change ( I I ) isotherms of
hydrated portland cement paste (waterlcement ratio = 0.5). Scanning loops marked.
as will be shown, a water area determination cannot be considered as a valid procedure. The nitrogen areas are, for these samples, 113 to 115 of the water areas, as has been observed by other workers (12).
Detailed examination of the isotherms, and especi- ally the loops (Figs. 1 and 2), reveal the following:
(a) The isotherm is irreversible even at as low a
PIP, value as 0.05 as is shown by loop 1 ; much of the
irreversibly sorbed water, contributing to the low- pressure hysteresis, is sorbed below a PIP, of 0.35. (This irreversibly sorbed water, as will be shown, is interlayer hydrate water and will also be referred to as 'irreversible water.')
(b) All descending portions of loops 3 to 9 are essentially parallel and are much less steep than the primary curve. Thus means of course that a large part of the water sorbed on the primary adsorption curve is irreversible.
(c) In loops 7 and 8, where the descending curve has not gone below a PIP, of 0.11, the loops, although very close to, are not quite reversible.
(d) Both loops 7 and 8 exhibit a small primary hysteresis. This is to be expected since these loops leave the primary curve at PIP, values of 0.56 and 0.73 respectively. The desorption of the capillary water takes place between PIP, values of 0.38 and 0.29. This is lower than has been reported (8), but is con- firmation of what was found previously (1).
(e) The primary desorption curve shows a large
primary hysteresis. This primary hysteresis disappears between PIP, values of 0.39 and 0.29. The length change isotherm shows a small expansion in this region.
(f) The primary desorption curve below a PIP, of 0.29 shows that the low pressure hysteresis has increased markedly since the last loop, 8; the length change isotherm shows large changes between earlier loops, but does not show a further change in this region in the same relation to the irreverible water added.
(g) Fig. 3 shows the AL/L vs. AWIW plots for the sample degassed at 80°C; loops are numbered. Curve I contains most of the loops, curve I1 is a magni- fied version of I, and curve 111 shows only the primary ascending and descending curves. The ALIL vs. AW/W characteristics for the primary curve and the loops are completely different; the slope of the primary curve is much steeper and only if the loop goes below a PIP, value of 0.10 or thereabout does it become steep. This implies that the mean location of the water sorbed on the primary loop is different from that desorbed. The water sorbed on the primary curve is composed of a reversible and irreversible component and the AL/L vs. AW/W slope of this water is much greater in the low pressure range than the reversible component, most of which comes off separately if the loop is not carried to too low a pressure. It now seems clear that this 'irreversible water' is interlayer hydrate water. Sorption and length change theory (13) (see also earlier part of this paper) allows for length change due to physical adsorption by a decrease in surface energy of the solid. If a "crystal" is aniso- tropic, this may lead to the development of shear forces. In the case of hydrated cement, the hydrated silicate which has lost most of its intelayer hydrate water will accept physically adsorbed water (some- times referred to as "reversible water") on its external surface, most of which is perpendicular to the c-axis. The resulting expansion on top of the layer should cause some warp at the edges, allowing some inter- layer hydrate water to enter. This process will con- tinue up the isotherm. (More will be said later about how this interlayer water enters and leaves and how it affects ALIL and Young's modulus.)
(h) The primary desorption curve below PIP, of 0.29, (Figs. 1 and 2) is surprisingly much steeper than all the desorption curves of the scanning loops. Loop 9 shows that 'irreversible water' was being desorbed
in this region; the AL/L vs. AW/W slope (Fig. 4) for
the primary desorption loop is much lower than in the primary adsorption region. Loop 9, however, is still steeper than loop 7, and it appears that some
Fig. 4. AL/L VS. AW/W plot for water sorbed on bottle-hydrated sariiple degassed at 80°C: 1-containing all loops; ZZ-enlarged portion of 1; 111-only showitlg primary sorption and desorp-
tion crrrves (scanning loops marked I to 10).
~ i ~ ~ ~ l ~ I ~i l il l ~, i l l was less than 1 micron of H g (lo-' torr). l l i
interlayer hydration may be taking place along the adsorption curve of loop 9.
(i) ABC on Figs. 1, 2 and 4 mark the area where two regions of distinctly different slope of the AL/L vs. AW/W curve occurs on the primary desorption curve (2). As will be seen later, this probably repre- sents a change in the response of length change due to unit weight loss of interlayer water. The assumption made previously (2) that this characteristic is constant now appears to be incorrect.
(j) The line BC marks the region where a conside-
rable hysteresis in the AL/L vs. AW/W plot is formed (Fig. 4). (How this may illustrate the difference be- tween entry and exit of interlayer water will be dic- cussed later.) Below BC, the curve first gradually returns towards the zero point but then turns away, resulting in a large contraction below the zero point at zero AW/W.
(k) Loop 10 illustrates how a smaller low pressure hysteresis may be obtained in the isotherm when the sample has not been degassed as much as the initial degassing. Along the adsorption curve of the loop, a change in slope again occurs a t about a PIP, of 0.10.
(1) Sorption and desorption measurements were taken at very low pressures (Table 2). O n sorption the lowest PIP, value was 0.0027 and 0.0044 gave a
AW/W x 100 value of 1.42. O n desorption, the value was 3.45 a t a PIP, value of 0.0042. This shows that there is large hysteresis in the sorption isotherm even at the lowest pressures. The length change isotherm shows a hysteresis in the other direction. At PIP, below 0.0093, a very large shrinkage occurs (0.420 Per cent below the original zero). The pressure at zero
'I-
reliable figure.
It still seems possible to separate, to some extent, the interlayer and physically adsorbed water from the isotherm. This can be done with the help of the scann- ing loops. If the desorption part of each loop up to the point where it overlaps with the inception of the previous loop (at a lower pressure)is regarded as rever- sible and involving only physically held water, one would be able to calculate for the pressure region over which the loop extended, the amounts of 'irreversible' and 'reversible' water sorbed along the primary adsorp- tion curve. Since loops 7 and 8 exhibited primary hysteresis, the adsorption curve was used in these instances. For the estimate between PIP, of 0.727 and 0.97, it was assumed that no 'irreversible water' was desorbed between PIP, of 0.97 and 0.289; then the separation between this point on the primary desorp- tion curve and loop 8, represented the water irre- versibly sorbed between PIP, of 0.727 and 0.97. This procedure was also performed for the length change isotherm.
Fig. 5 shows the reversible length change and sorption isotherms. The desorption curve between
PIP, of 0.97 and 0.289 was fitted on this curve. From
the length change isotherm it is clear that too much contraction took place in this region to fit properly onto the adsorption curve. I t is suspected that some 'irreversible water' was lost between at least PIP, of 0.345 and 0.289. Calculation of the reversible desorption between PIP, of 0.289 and 0.139 using loop 9 was not satisfactory since the validity of the assumption that the adsorption curve of the loop only involves physical water is suspect.
A plot of AL/L vs. AW/W (Fig. 5 ) , shows a sharp
deviation from the linear part of the curve at a PIP, of 0.10. This linear plot has been observed for the adsorption of water on porous glass, finely divided silica, precipitated calcium carbonate, calcium sul- phate hemihydrate and Ca(OH), and goes through The following conclusions can be derived from the
., -
previous discussion.
(a) The water isotherm for the several degrees of
z
3 -:I. drying investigated is irreversible a t all primary
regions and, as such, cannot be used for B. E. T.
2 -
g I - calculations.
(b) As a large but unknown portion of the 'sorbed'
-
water in the low pressure region is interlayer hydration, the surface area must be considerably lower than the
, . B 1 2 1 6 2 O 2 4 I s , 1 > 6 ., I s s t 1 6 6 , 6 8 1 2 7.6 8 , B s original value calculated for water. The surface area
b - , # 0 0
obtained from N, will be considered here as the more
LTCI*O
P R Y P R Y A O I O R P T l O l CURYE
.-I P ~ ~ I Y I P V OESORPIIOX ~ U B Y L
,
J'-Fig. 5. Constrlrcted reversible water isotherm and cotiiplrtatioris:
I-ALIL x 100 VS. PIP0 X 100; II-AWIW X 100~s. P/Po
x 100; III-ALIL x 100vs. AW/W x 100; IV-ALILvs.
AY.
zero (14-17). Thus it is concluded that a larger amount of 'irreversible water' is removed below PIP, of 0.10, and so the physically held water cannot be estimated in this region using loops 1 or 2. An alternative pro- cedure was used to achieve this. The N 2 surface area of 30 m2/g (Table 1) was assumed to be approxi- mately correct. Then, using the B.E.T. equation and adding different amounts of reversible water to repre- sent that adsorbed below a PIP, of 0.10, calculations were made allowing the assumed surface area to vary slightly, until the monolayer capacity fell on a PIP, of 0.15 to 0.20. Using the area of the water molecule as 10.8 1n2/g, the water area obtained was 40.8 m2/g;
0.70 per cent for AW/W
x
100 was used for the'reversible water' between PIP, of 0 to 0.10. From the B. E. T., a AW/W value for PIP, of 0.05 was obtained, and all other points below this were made by extrapo- lation of the curve. No significance was attributed to values below PIP, of 0.05 for 'reversible water.' Similar values for AL/L could be obtained by extrapolation
of the AL/L vs. AW/W plot to the zero obtained for AW/W.
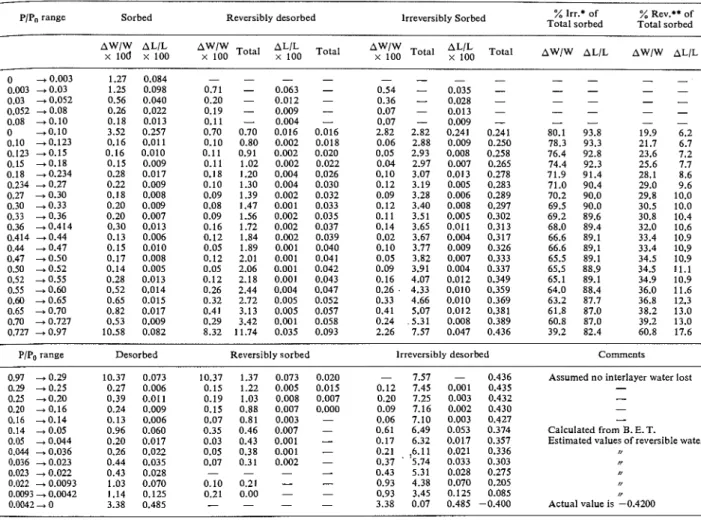
All these r e s ~ ~ l t s are included in Table 3 together
with the results for the 'irreversible water,' which will be discussed together in more detail later.
Application of Gibbs' Equation and the Estimation of Young's Modulus from the Reversible Isotherm An integration over the adsorption branch of the reversible isotherm was made between PIP, values of 0.05 (to avoid the extrapolated area and errors in integration as the pressure approaches zero) and 0.60,
according to Gibbs' equation (Eqs. (I) and (3)). The
change in state of stress of the solid Ay, is plotted against AL/L according to Eq. (4). As shown on Fig. 5, this plot yields a very good straight line, and it appears that the whole procedure in constructiilg the reversible isotherm is justified. The slope of this line,
Table 3. Computed values for the reversible and irreversible isotherms
PIP,, range Sorbed Reversibly desorbed lrreversibly Sorbed Total sorbed % lrr.* of Total sorbed % Rev.** of
AWlW ALIL
$7;1/O
:\%
Total Total Total loo Total AWIW AL/L AW/W AL/LPIPo range Desorbed Reversibly sorbed
* Total irreversible sorbed "Total reversibly desorbed
lrreversibly desorbed - 7.57 - 0.436 0.12 7.45 0.001 0.435 0.20 7.25 0.003 0.432 0.09 7.16 0.002 0.430 0.06 7.10 0.003 0.427 0.61 6.49 0.053 0.374 0.17 6.32 0.017 0.357 0.21 .6.11 0.021 0.336 0.37 ' '5.74 0.033 0.303 0.43 5.31 0.028 0.275 0.93 4.38 0.070 0.205 0.93 3.45 0.125 0.085 3.38 0.07 0.485 -0.400 Comments
Assumed no interlayer water lost -
- - - Calculated from B. E. T. Estimated values of reversible water
,,
Actual value is -0.4200
Using a value of 2.86 g/cc for Ca,Si20,.2H20 (18) since at a PIP, of 0.30 only about 40 per cent of the irreversible water has re-entered and since most of the adsorption is taking place on this "crystal" which constitutes most of the area, and using 40.8
m2/g for the surface area, the value of 'E' from
Eq. (5) is 2.99 x 10¹¹ dyne/cm2 or 4.35 x lo6 lb/in.2.
This value is about 8 times as large as that measured for the equivalent compact (19), or of the equivalent water to cement ratio paste (20). This calculated value,
however, represents 'E' for the solid material, not the
Porous body. Helmuth and Turk (20) extrapolated
from porosity-E plots to get 'E' of 'gel phase' as 4.5,
and of 'solid phase' 10.8 (lb/in.2). This latter value
Was similar to the extrapolation of Soroka and Sereda
(19). Both these values suffer from the difficulty of measuring the correct porosity; however, since a large Part of the water removed during 'd-drying' is inter- layer water which returns on sorption. Thus, the water
porosity (determined by water) would be much lower than anticipated, making the extrapolated value much too high. Considering these assumptions, the value faund for the modulus of the solid phases is very good and is considered as further evidence of the validity of this approach.
The Irreversible Isotherm
The method outlined in the previous section (con- struction of a reversible isotherm) also enables one to obtain the irreversible isotherm (Fig. 6 and Table 3). The large hysteresis in both length and weight change isotherms is evident. As already described, this hysteresis exists even to vapour pressures of only a few microns. The 'irreversible water' is sorbed at all pressures along the primary adsorption isotherm, and this explains why the time to attain equilibrium was always longer on this curve. Values below PIP,
0--o PRIMARY ADSORPTION CURVE
I-I PRIMARY DESORPTION CURVE
Fig. 6 . Constructedirreversible water isotherm: I-ALIL x 100
VS. PIPo x 100; II-AWIW x 100 VS. PIP0 x 100; III-
AL/L x 1OOvs. AW/W x 100.
of 0.05 were extrapolated for 'reversible water', but since this became small compared with the 'irrever- sible water', any error would be negligible.
The plot of the AL/L vs. AW/W shows the impor- tant change in slope on the sorption curve at PIP, of 0.54. This is precisely the point where the value of the modulus of elasticity (1 1) starts to increase, when measured as a function of relative pressure. In addi- tion, the hysteresis of this curve shows that the with- drawal of interlayer water follows a completely dif- ferent path from its entry. Again this might be implied from the results of the modulus measurements (1 1). As the desorption continued, it appeared as if the loop might gradually close, but below PIP, of 0.009 it diver- ged yielding a large irreversible shrinkage below the original zero by 0.420 per cent, although the zero for
AW/W was the same.
This irreversible effect also occurred on the first degassing, but did not occur when degassing took place after a methanol cycle. Thus it must be asso- ciated with the effect ofwater. Solution effects of water on calcium hydroxide (14) are ruled out because the
effect is considered too large; the explanation favoured is that when the final interlayer water is expelled, a reorientation of the layers occurs, resulting in an irreversible contraction. More work is needed in this area. Nevertheless, a plausible model can be suggested to explain most of the general behaviour of the entrance and exit of interlayer water and the variation of AL/L and modulus of elasticity with PIP,.
Fig. 7 illustrates in model form the process of exit and entry of interlayer water: initially drying will take place from the edges with little contraction ((a) to (b)); drying to state (c) will provide some collapse and large contraction; drying at the edges probably occurs below PIP, of 0.30 and stronger drying (state (c)), below PIP, of 0.07; the final removal of the water in the middle will not take place above
PIP, of 0.009. It is considered that this water in the centre provides the main bracing for a higher rigidity and, when it is removed, the modulus decreases as experiments show. This state of drying (d) also in- volves possible reorientation of the plates to produce an irreversible contraction. Resorption now occurs
(9)
Fig. X X X X X1
D E S O R P T l O N DRYi
A D S O R P T I O N7. Simplified model for exit and entry of water between
layers of tobermorite gel
at the edges (states (e) and (f)), being initiated by physical adsorption and resultant surface free energy change on the external surfaces. Here, the pressure vs. AL/L or AW/W hysteresis is apparent, since inter- layer water cannot enter until some external move- ment occurs. Further sorption will continue inward from the edges, causing large expansions. As the layers are filled towards the middle (states (f) to (g)), it is apparent that the modulus will start to increase due to "bracing" of the layers by the water molecules; the resultant ALIL will not be as large because most of the expansion occurred from the edges.
Further implications of the interlayer water can
be observed from Table 3 :
(a) Total interlayer water for this sample is 7.54 per cent, although it may be somewhat higher, as discussed above. This means that the difference be- tween pore volumes obtained by water, on the one hand, and nitrogen and methanol, on the other, would b: in the order of 0.08 ml/g. This explains the discrepancies in pore volume obtained by Mikhail and Selim (21) for pastes with a w/c of 0.35 to 0.57. It is postulated here that, since the interlayer penetra- tion by nitrogen is very small, this gas would give the best pore volume for mechanical property extrapola- tions.
(b) Less than 20 per cent of the total expansion along the isotherm is due to physically adsorbed water. The percentages of physical and 'irreversible' water, and their concomitant length changes for the different Pressure ranges are shown in Table 3.
The only remaining evidence to support the pre-
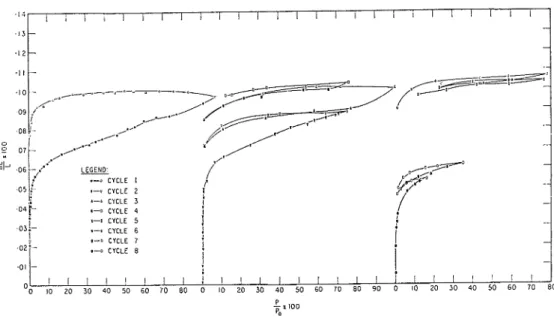
Fig. 9. Length change isotherms of methanol on bottle-ltydrated portland cement compacts degassed at 80°C.
vious model of hydrated portland cement is the den- sity measurements of Brunauer, Kantro, and Cope- land (18). It is clear, however, that when the density is measured with a water solution, the interlayer water has already re-entered. The slow decrease in density obtained by these authors for some less severely dried samples is probably associated with some slow recovery of the irreversible shrinkage observed by Helmuth and Turk (22), or as observed here below PIP, of 0.009. Density measurements should be perhaps obtained with nitrogen.
Methanol Adsorption
Methanol sorption was measured on the same compacted sample degassed at 80°C.
The sorption results (Fig. 8) are very similar to those obtained by Mikhail(21) inasmuch as a surface area of similar magnitude was obtained (area of
molecule taken as 18.1
A2,
see Table I), and the lowpressure hysteresis is of the same magnitude (inter- mediate between water and nitrogen). Several cycles were performed, however, and length change measure- ments, (Fig. 9) were made during these cycles. Signi- ficant features of these results are the following:
(a) After significant sorption at very low pressures, the isotherm is very flat; for cycle 2 to PIP, of 0.75 the desorption is even flatter. This may be explained by the concept of autophobicity of alcohol adsorption (23), where the isotherms exhibit strong monolayer.
----
" - . - ' - " 7 ' - 0 - 0 ,,.-.
/ LEGEND' .-o CYCLE I 9-9 CYCLE Z a-; CYCLE 3 - 0 4r-
a-0 CYCLE 4 .-I CYCLE 5 s-0 CYCLE 6 #-a CYCLE 8Fig. 8. Sorption isothertns of methanol on bottle-hydrated
portland cemetrt compacts degassed at 80°C.
Fig. 10. AL/L vs. AW/W plots for methanol sorbed on bottle-
hydrated portland cerllerlt cor~lpact degassed at 80°C (PIP0 values are x 100)
binding with little tendency toward multilayer forma- tion; multilayer formation occurred almost asymp- totically at high vapour pressures. The autophobicity is due to strongly oriented adsorption in the first adsorbate layer which would permit multilayer forma- tion at a distance remote from the initial interface so that its influence is lost. The result would approxi- mate to a Langmuir isotherm, but for methanol, whose hydrocarbon chain is not so long, this approxi-
mation is not completely attained.
(b) Cycles 2, 7 and 8 show that the hysteresis, like
that for water, is cumulative, significant 1ow.pressure hysteresis occurring even after sorption to only PIPo
of 0.17. Cycle 3 rejoins precisely where cycle 2 stopped
on the adsorption curve, but for cycles 7 and 8, the rejoining is not so exact. Cycle 4 shows that some of the irreversibly sorbed methanol may be withdrawn
is close to reversible between PIP, of 0.12 and 0.77 on the descending branch, and cycle 6, that some irreversible sorbed methanol is added when this cycle
goes to a higher pressure than did cycles 4 and 5.
(c) The length results show the same result as far as irreversibility is concerned. The ascending 'sorp- tion' curves,,however, cycles 1, 2, 3, show a significant length change a t the beginning and all the way up the isotherm, contrary to the assumption of Mikhail and Selim (21). Despite the large desorption, there is very little contraction on the desorption curve. This length change plot looks very similar to the construc- ted irreversible plot for water. The explanation is clear: along the sorption curve, both physical adsorp- tion (of a strong nature a t low PIP,), and interlayer penetration are taking place. The penetration is less than that of water because of the respective sizes of the molecules; on the desorption curve only weakly held methanol is coming off. At PIP, of 0.10, the slope (AL/L)/(AW/W) for the hysteresis is taken to represent that for interlayer methanol (see Table 1); the value
0.0955 is more than that for water (0.0860) which is reasonable since the methanol molecule is bigger than water. Curve I in Fig. 10 shows the AL/L vs. AW/W plot. The points below PIP, of 0.01 show signs of specific interaction, but the adsorbed methanol cannot be separated from the interlayer methanol. If the average slope is taken and the surface area is as- sumed to be 30 m2/g (nitrogen value), the physically adsorbed methanol will have a (AL/L)/(AW/W) of 0.0525, over twice that for water. This is consistent with Gibbs' equation if, as assumed, a larger propor- tion of the methanol is adsorbed at low pressures. There would be reason to expect that the specific adsorption for methanol would be different from the one for water if the surface contains many hydroxyl groups (13). Details of this will not be included here, but it is apparent that the methanol isotherm is more complicated than previous interpretations (21), and that it is consistent in every way with the results obtained from water sorption.
Conclusions
1. Exposure of dried (below approximately 10
per cent R. H.) hydrated portland cement paste to
water vapour at any pressure results in the entry of interlayer hydrate water simultaneously with phy- sically adsorbed water.
2. Surface areas are much lower than was believed, the nitrogen area probably being the most reliable figure.
3. Less than 18 per cent of the expansion along the
isotherm is due to physically adsorbed water. 4. Porosity values obtained from water sorption are too high. Nitrogen would give more reliable figures.
5. Gibbs' equation is obeyed for the constructed
reversible isotherm, and a calculation of the modulus
of elasticity of the solid material gives a reasonable value.
6. A model for the entry and exit of interlayer water
is given which explains the effect of vapour pressure on the modulus of elasticity. This model suggests that the entry and exit of interlayer hydrate water plays an important part in creep phenomena.
7. Results from methanol sorption, which also involves interlayer penetration, are consistent with those of water.
Acknowledgements
The author is grateful to H. F. Slade and S. E. of Building Research, National Research Council
Dads for setting up the apparatus and collecting the of Canada and is published with the approval of the
data. This paper is a contribution from the Division Director of the Division.
References
1. R. F. Feldman and P. J. Sereda, "Sorption of water on 2. R. F. Feldman and P. J. Sereda, "A Datum point for
bottle-hydrated cement 1," J. Appl. Chem., 14, estimating the adsorbed water in hydrated portland
3. R. F. Feldman and P. J. Sereda, "Characteristics of sorption and expansion isotherms of reactive lime- stone aggregate," Proc., J. Amer. Concr. Inst.,
58, 203-214 (1961).
4. R. F. Feldman and P. J. Sereda, "A model of hydrated portland cement paste as deduced from sorption- Length change and mechanical properties." To be published.
5. H. Van Olphen, "Thermodynamics of interlayer adsorption of water in clays," J. Colloid Sci., 20, 822-837 (1965).
6, R. F. Feldman and P. J. Sereda, "Sorption of water on compacts of bottle-hydrated cement, 11. ther- modynamic considerations and theory of volume change," J. Appl. Chem., 14,93-104 (1964).
7. D. Bangham and F. A. P. Maggs. "The strength and elastic constants of coals in relation to their ultra- fine structure," In Proc., Conf. Ultra-fine Structure of Coals and Cokes, Brit, Coal Util. Res. Ass.,
1 1 8-130, June 1943.
8. T. C. Powers and T. L. Brownyard, "Studies of the physical properties of hardened portland cement paste," PCA Bulletin No. 22, 304 p. (1948). 9. T. C. Powers, "Mechanism of shrinkage and reversible
creep of hardened paste," Proc. Intern. Conf. Structure of Concrete, London (1965).
10. R. M. Mills, "Effects of sorbed water on dimensions, compressive strength and swelling pressure of har- dened cement paste," Highway Research Board, Special Report No. 90, 84-1 1 1 (1966).
1 1 . P. J. Sereda, R. F. Feldman and E. G . Swenson,
"Effect of sorbed water on some mechanical pro- perties of hydrated cement pastes and compacts," Highway Research Board, Special Report No. 90, 58-73 (1966).
12. R. Sh. Mikhail, L. E. Copeland and S. Brunauer, "Pore structures and surface areas of hardened portland cement pastes by nitrogen adsorption," Can. Jour. Chem., 42, 426-438 (1964).
13. P. J. Sereda and R. F. Feldman, "Mechanical pro- perties and the solid gas interface," In The Solid Gas Interface, Edited by E. A. Flood, Vol. 2,
Ch. 24, 729-764, Marcel Dekker Inc., New York
(1967).
14. V. S. Ramachandran and R. F. Feldman, "Length change characteristics of Ca(OH), compacts on exposure to water vapour," To be published.
15. R. F. Feldman and P. J. Sereda, "The use of compacts to study the sorption characteristics of powdered plaster of paris," J. Appl. Chem., 13, 158-167 (1963).
16. P. J. Sereda and R. F. Feldman, "Compacts of powdered materials as porous bodies for use in sorption studies," J. Appl. Chem., 13, 150-158 (1963).
17. C. H. Amberg and R. Macintosh, "A study of hyste- resis by means of length changes of a rod of porous glass," Can. J. Chem., 30, 1012-1032 (1952). 18. S. Brunauer, D. L. Kantro and L. E. Copeland, "The
stoichiometry of the hydration of P-dicalcium sili- cate and tricalcium silicate at room temperature," Jour. of Phys. Chem., 80,761-767 (1958).
19. I. Soroka and P. J. Sereda, "The structure of cement- stone and the use of compacts as structural models," Submitted to 5th International Symp. on Cement Chemistry, Tokyo, 1968.
20. R. A. Helmuth and D. H. Twk, "Elastic moduli of hardened portland cement and tricalcium silicate pastes: effect of porosity," Highway Research Board, Special Report No. 90, 135-144 (1966). 21. R. Sh. Mikhail and S. A. Selim, "Adsorption of or-
ganic vapors in relation to the pore structure of hardened portland cement pastes," Highway Rese- arch Board, Special Report No. 90, 123-134 (1966). 22. R. A. Helmuth and D. H. Turk, "The reversible and
irreversible drying shrinkage of hardened portland cement and tricalcium silicate pastes," J. Portland Cement Association, Research and Development Laboratories, 9, 8-21 (1967).
23. J. Barto, J. L. Durham, V. F. Baston and W. H. Wade, "The gas phase autophobicity of alcohols adsorbed on alumina," J. Colloid and Interface Science, 22, 491-501 (1966).