HAL Id: hal-01682623
https://hal.archives-ouvertes.fr/hal-01682623
Submitted on 15 Jan 2018HAL is a multi-disciplinary open access archive for the deposit and dissemination of sci-entific research documents, whether they are pub-lished or not. The documents may come from teaching and research institutions in France or abroad, or from public or private research centers.
L’archive ouverte pluridisciplinaire HAL, est destinée au dépôt et à la diffusion de documents scientifiques de niveau recherche, publiés ou non, émanant des établissements d’enseignement et de recherche français ou étrangers, des laboratoires publics ou privés.
Investigation of the selectivity of thrombin-binding
aptamers for thrombin titration in murine plasma
Ana Trapaidze, Jean-Pascal Hérault, Jean-Marc Herbert, Aurélien Bancaud,
Anne Marie Gué
To cite this version:
Ana Trapaidze, Jean-Pascal Hérault, Jean-Marc Herbert, Aurélien Bancaud, Anne Marie Gué. Investi-gation of the selectivity of thrombin-binding aptamers for thrombin titration in murine plasma. Biosen-sors and Bioelectronics, Elsevier, 2016, 78, pp.58 - 66. �10.1016/j.bios.2015.11.017�. �hal-01682623�
Investigation of the selectivity of thrombin-binding aptamers for
thrombin titration in murine plasma
Ana Trapaidze1,2, Jean-Pascal Hérault3, Jean-Marc Herbert3, Aurélien Bancaud1,2,
Anne-Marie Gué1,2
1 CNRS, LAAS, 7 avenue du colonel Roche, F-31400 Toulouse, France 2 Université de Toulouse, LAAS, F-31400 Toulouse, France
3 Sanofi, 195 route d’Espagne, F-31036 Toulouse, France
Correspondance: Anne-Marie Gué (gue@laas.fr) & Aurélien Bancaud (abancaud@laas.fr)
Key words: Thrombin, Aptasensor, Surface Plasmon Resonance, Aptamer selectivity, Aptamer assay
Abstract
Detection of thrombin in plasma raises timely challenges to enable therapeutic management of thrombosis in patients under vital threat. Thrombin binding aptamers represent promising candidates as sensing elements for the development of real-time thrombin biosensors; however implementation of such biosensor requires the clear understanding of thrombin-aptamer interaction properties in real-like environment. In this study, we used surface plasmon resonance technique to answer the questions of specificity and sensitivity of thrombin detection by the thrombin-binding aptamers HD1, NU172 and HD22. We systematically characterized their properties in the presence of thrombin, as well as interfering molecular species such as the thrombin precursor prothrombin, thrombin in complex with some of its natural inhibitors, nonspecific serum proteins, and diluted plasma. Kinetic experiments show the multiple binding modes of HD1 and NU172, which both interact with multiple sites of thrombin with low nanomolar affinities and show little specificity of interaction for prothrombin vs. thrombin. HD22, on the other hand, binds specifically to thrombin exosite II and has no affinity to prothrombin at all. While thrombin in complex with some of its inhibitors could not be recognized by any aptamer, the binding of HD1 and NU172 properties is compromised by thrombin inhibitors alone, as well as with serum albumin. Finally, the complex nature of plasma was overwhelming for HD1, but we define conditions for the thrombin detection at 10 nM range in 100-fold diluted plasma by HD22. Consequently HD22 showed key advantage over HD1 and NU172, and appears as the only alternative to design an aptasensor.
1. Introduction
Thrombin is the central enzyme in the process of hemostasis, being at the cross-roads of coagulation and platelet reactions. Clinically impaired or unregulated thrombin generation predisposes patients either to hemorrhagic or thromboembolic complications. Monitoring thrombin in real-time is therefore needed to enable rapid and accurate determination of drug administration strategy for patients under vital threat.
Thrombin formation in plasma can be measured in vitro by the thrombin generation potential after an activating stimulus, or by measuring the concentration of markers of thrombin generation, inhibition, and activity. The thrombin generation assay is based on thrombin production in plasma (Hemker et al., 2006) or in blood (Tappenden et al., 2007) triggered by tissue factors. Generated thrombin causes the cleavage of a chromogenic or fluorogenic substrate. The rate of substrate conversion produces a pattern associated to thrombin production (Baglin, 2005). The resulting thrombogram defines hyper- or hypo-coagulable phenotypes, which are sensitive to the action of antithrombotic drugs (Al Dieri et al., 2012; Berntorp and Salvagno, 2008). Yet thrombograms are not efficient to detect free thrombin escaped from the site of injury and circulating in dangerous amounts. Moreover the application of these assays to clinical decisions remains hampered by standardization issues (Castoldi and Rosing, 2011).
Thrombin levels can also be assessed by titrating markers of thrombin generation, activity and inhibition. These markers include prothrombin fragments (Pelzer et al., 1991), Fibrinopeptide A (Nossel et al., 1974), or thrombin-antithrombin complexes (Pelzer et al., 1988). Titration of these markers is carried out with antibodies to indicate abnormal processes related to thrombosis (Quinn et al., 2000). However, most of these markers are formed and then cleared from circulation in a characteristic time, and they partially reflect the thrombin level (Ofosu, 2006).
These methods are used as standards, but they are time-consuming and manually intensive. Compact and autonomous systems to measure thrombin levels in patient blood at point-of-care are direly needed. This challenge relies on the identification of receptors that guarantee excellent detection specificity with high affinity. Aptamers, which are single stranded DNA or RNA fragments isolated after repetitive rounds of selection against a target (Tuerk and Gold, 1990), represent promising biorecognition elements: high affinity and specify assure precise biorecognition; nucleic acid origin grants long shelf-life; chemical modifications allow efficient immobilization on surfaces in miniaturized systems; conjugation with dyes or reactive groups permits use of aptamers in various biorecognition and signal transduction formats (Jayasena, 1999).
At least four thrombin-binding aptamers (TBA), and their various modified versions, have been identified: HD1 (Bock et al., 1992), NU172 (ARCA Biopharma, n.d.; Mayer et al., 2011), HD22 (Tasset et al., 1997), and TOG25 (White et al., 2001). Selection of thrombin aptamers was mostly motivated by therapeutic applications (Macaya et al., 1995), but these molecules were also exploited for biosensing. They now represent
~20% of the 5000 papers published about aptamers (Deng et al., 2014). Promising detection ranges, which span low pM to μM concentrations, have been reported (Davis, 1994; Hasegawa et al., 2008; Hianik et al., 2007; Lin et al., 2011; Müller et al., 2008; Pinto, 2012). However most studies have been carried out using thrombin as a proof-of-principle model, and the selectivity, specificity, and sensitivity of TBA have been poorly worked out. We reasoned that a detailed investigation of the properties of TBA in simplified and complex media was desirable to design thrombin aptasensors. We chose to carry out this study with the well-established Surface Plasmon Resonance (SPR) method which allows sensitive measurements of biomolecular interaction kinetics between an immobilized ligand and an injected analyte (Englebienne et al., 2003). SPR represents a powerful assay to determine association and dissociation rate constants, but also an example of surface based affinity aptasensor, in which design limitations in terms of selectivity remain to be clarified.
We assayed the behavior of HD1, NU172, and HD22 in the presence of thrombin alone, prothrombin, and thrombin cofactors, and then extend our analysis to diluted murine plasma. We conclude that HD22 is the only aptamer that allows the detection of thrombin in real samples, and experimental conditions for thrombin detection in the 10 nM range in 100-times diluted plasma are defined. Altogether we believe that this study constitutes an important milestone to design aptamer biosensors.
2. Materials and methods
2.1. AptamersAll DNA sequences were synthetized by Eurogentec (Belgium). Samples were received in dry format, dissolved in water at 0.5 mM, and kept in aliquots at – 20 °C. We used biotin modified aptamers at their 5’ end with a 20-Thymine spacer: HD1 (5’-biotion-20xT-GGT-TGG-TGT-GGT-TGG-3’), HD1ref (5’-biotion-20xT-GTT-TGT-TGT-TTG-TTG-3’), NU172 (5’-biotion-20xT-CGC-CTA-GGT-TGG-GTA-GGG-TGG-TGG-CG) NU172ref CGC-CAA-GGA-AGT-GAA-GAG-AGG-AGG-CG), HD22 (5’-biotion-20xT-AGT-CCG-TGG-TAG-GGC-AGG-TTG-GGG-TGA-CT-3’), HD22ref (5’-biotion-20xT-GAC-TGC-GTT-GCA-GGA-CGG-TTG-TTT-GAG-TC-3’).
2.2. Chemicals and Proteins
Chemicals were purchased from Sigma-Aldrich (France) with molecular biology grades. α-Thrombin (36 kDa; 1500-3500 NIH units/mg), Heparin Cofactor II (HCII; 65.6 kDa) and α2-Macroglobulin (725 kDa) were purified from human plasma (Sigma-Aldrich). Prothrombin (72 kDa), Antithrombin III (ATIII; 58.2 kDa) were obtained from STAGO (France). Bovine serum albumin (BSA, 66.5 kDa) was purchased from New England BioLabs (USA). Unstained protein ladder (6.5–200 kDa) was obtained from BioRad (France). Reversible direct thrombin inhibitor Argatroban (508.6 Da,
Sigma-Aldrich) was prepared in concentrated aliquots at 1 mM in 10% DMSO/water and stored at 4°C.
Lyophilized proteins were reconstituted following manufacturer’s instructions, and stored in aliquots at -20 °C. For each experiment one aliquot was thawed at ambient temperature, ultrasonicated during a few seconds, and kept on ice to maintain activity. The concentration of Thrombin and ATIII was determined by UV absorbance at 280 nm using molar extinction coefficients of 67000 Lmol-1cm-1 (Fenton et al., 1977) and 38000
Lmol-1cm-1 (Nordenman et al., 1977), respectively. Murine plasma was generously
provided by Dr. Laurence Millet (Sanofi-Aventis). It was centrifuged at 14000 rpm for 5 minutes prior to use; supernatant was collected, filtered in 0.22 µm polycarbonate filters, and diluted in PBS.
2.3. SPR (Surface Plasmon Resonance) measurements
Measurements were carried out on Biacore 3000 and Biacore T200 (GE Healthcare) machines, which use 760 nm wavelength light beam. Aptamers, diluted in HBS-EP buffer (GE-Healthcare), were immobilized on streptavidin-coated sensor chips. Prior to immobilization, the chips were primed with HBS-EP buffer and rinsed by 3 consecutive injections of 1 minute of 1 M NaCl and 50 mM NaOH solutions at a rate of 30 µl/min. In all experiments, the level of the aptamer immobilization was set to ~40 RU.
Proteins diluted in phosphate buffer saline (10 mM PB pH 7.4, 145 mM NaCl, 5 mM KCl, 1 mM MgCl2, 1 mM CaCl2) were injected in the system for 3 minutes at a flow rate of
30 µl/min at 25 °C. The dissociation phase was recorded by injection of running buffer during ~300 s. After each experiment, the surface was regenerated with a pulse of 2 M KCl for 30 s. Kinetic experiments were made in duplicate. We used nonspecific binding reducer buffer (NSBr, GE healthcare) for experiments with plasma.
2.4. Fitting of SPR data
Affinity and reaction constants of thrombin or prothrombin interaction with aptamers were obtained by fitting SPR data with nonlinear least square method using integrated rate equations either for one-to-one interaction (eq. 1) or heterogeneous analyte (eq. 2) models ((O’Shannessy et al., 1993) (Derivation of the equations, and detailed information about fitting procedure is described in Sup. Material)). (eq. 1.a) and (eq.2.a) are used to describe SPR signal during the association phase, whereas (eq. 1.b) and (eq. 2.b) correspond to dissociation phase.
𝑅𝑡 = [𝐴]𝑅𝑚𝑎𝑥𝑘𝑎 [𝐴]𝑘𝑎+ 𝑘𝑑 (1 − 1 𝑒([𝐴]𝑘𝑎+𝑘𝑑)𝑡) (1.a) 𝑅𝑡 = 𝑅𝑎𝑒−𝑘𝑑𝑡 (1.b)
Rt is observed SPR signal at time point t, ka and kd are the association and
dissociation constants, respectively. [𝐴] refers to the analyte concentration. Rmax
corresponds to maximum SPR signal for all ligands paired with analyte, whereas Ra is
When the immobilized ligand is interacting with bivalent or several species of analytes (A1 and A2) and binding events are independent, equation 1 becomes:
𝑅𝑡 = [𝐴1]𝑅𝑚𝑎𝑥1𝑘𝑎1 [𝐴1]𝑘𝑎1+ 𝑘𝑑1 (1 − 1 𝑒([𝐴1]𝑘𝑎1+𝑘𝑑1)𝑡) + [𝐴2]𝑅𝑚𝑎𝑥2𝑘𝑎2 [𝐴2]𝑘𝑎2+ 𝑘𝑑2 (1 − 1 𝑒([𝐴2]𝑘𝑎2+𝑘𝑑2)𝑡) (1.a) 𝑅𝑡 = 𝑅𝑎1𝑒−𝑘𝑑1𝑡+ 𝑅𝑎2𝑒−𝑘𝑑2𝑡 (2.b)
In the case of bivalent analyte, with two non-identical binding sites which are not simultaneously interacting with two neighboring ligands, in the eq. 2 [A1]=[A2]=[A], Rmax1=Rmax2=Rmax.
3. Results and discussion
3.1. A few facts on thrombinThrombin is the activated form of prothrombin which circulates in blood in concentration of 1.4 µM (Butenas et al., 1999). Prothrombin is proteolytically activated by different factors (Lane et al., 2005), resulting in α-thrombin release (Fig. 1). The size of thrombin represents half of that of prothrombin (36 and 72 kDa, respectively). This release exposes functional regions for thrombosis activation (Crawley et al., 2007). More specifically thrombin has two anion-binding exosites made up of clusters of basic residues (Fig. 1). Exosite I acts as steering for active site substrates such as fibrinogen, fibrin, HCII, as well as aptamers HD1 and NU172. Exosite II is the site for docking ATIII, factors V, VIII and XI (Bode, 2006a), as well as with HD22 (see more below).
Thrombin function depends on its concentration (Bode, 2006b; Di Cera, 2007). At low pM concentration, thrombin is constantly circulating in the body to maintain coagulation poised to instantaneously respond to injury with a burst of thrombin at the site of vascular damage. At the site of injury, the concentration of thrombin might reach several hundred nM to promote coagulation reactions (Mann, 2003). This process is however highly localized and rigorously regulated by thrombin natural inhibitors ATIII, HCII and A2M (Siller-Matula et al., 2011). The risk of thrombosis arises if uninhibited thrombin escapes from the injury site at concentration above 5 nM (Mann, 2003). Hence free thrombin levels of 5 to 20 nM in blood circulation could indicate a high risk of thrombosis, and the concentration above 20 nM already means the presence of thrombosis.
3.2. A few facts on TBA
HD1 aptamer, also known as G15D, HTQ or ARC183, is a 15 base long single-stranded DNA aptamer with the sequence 5’-GGTTGGTGTGGTTGG-3’ (Bock et al., 1992). It folds into a chair-like structure with two G-quartets spaced by two TT loops and a TGT motif (Russo Krauss et al., 2012). HD1 primarily interacts with thrombin exosite I with nanomolar affinity, as shown in Fig. 1. There is also evidence that the TGT loop interacts
with exosite II (Padmanabhan and Tulinsky, 1996; Pagano et al., 2008; Russo Krauss et al., 2011; Trapaidze et al., 2015).
HD22, also known as HTDQ, is the 29-mer ssDNA aptamer with the sequence 5'-AGTCCGTGGTAGGGCAGGTTGGGGTGACT-3' (Tasset et al., 1997). HD22 has a duplex/G-quadruplex mixed structure (Russo Krauss et al., 2013). HD22 recognizes the heparin-binding exosite II of thrombin (Fig. 1). The positive charges of exosite II create ion pairs with HD22, and the complex is stabilized by hydrophobic interactions, resulting in more affinity of HD22 for thrombin in comparison to that of HD1 (Trapaidze et al., 2015).
NU172 with sequence 5’-CGCCTAGGTTGGGTAGGGTGGTGGCG-3’ is 26-mer ssDNA aptamer also known an ARC2172 (HUTABARAT, 2010). It was developed as the optimized/alternative form of HD1 for therapeutic purposes. NU172 is a thrombin antagonist that prevents fibrin generation (Que-Gewirth and Sullenger, 2007). NU172 targets exosite I of thrombin (Buff et al., 2009).
3.3. Interaction of TBA aptamers with thrombin and prothrombin 3.3.1. Interaction kinetics with thrombin
Binding kinetics of α-thrombin and immobilized HD1, HD22, NU172 aptamers are reported in figure 2A. Thrombin concentration spanned 0.5-50 nM in order to cover the level of concentration relevant for thrombotic accidents. The strongest response of ~60 R.U. for 25 nM thrombin was observed using HD1, then ~50 R.U. for HD22 and finally ~30 R.U. for NU172. We detected a consistent response at thrombin concentration as low as 0.78 nM for the three aptamers. In order to determine thrombin-aptamers reaction constants, sensograms were described with the simple 1:1 interaction model (eq. 1), assuming that HD1 and NU172 interact with exosite I, and HD22 binds to exosite II. The model described the association and dissociation reactions consistently for HD22 (right panel of Fig. 2A) with one set of reaction constants ka and kd for every curve
(Table I). Conversely, in the case of HD1 and NU172, the 1:1 binding model failed to describe entire kinetics, indicating their complex interaction properties (Sup. Fig. S1). This behavior is likely related to the existence of secondary interactions of HD1 with exosite II, as was described in our recent report (Trapaidze et al., 2015) and by others (Russo Krauss et al., 2012, 2011). Because this binding mode was detected by monitoring the aggregation of HD1-coated gold nanoparticles (Trapaidze et al., 2015), we carried out the same experiment with NU172, and observed the same dynamics, implying the existence of multiple interaction sites of NU172 with thrombin (Sup. Fig. S2). Therefore, assuming bivalent interactions of thrombin with HD1 and NU172 and supposing that one thrombin molecule can interact only with one site of aptamer at a time, we used the heterogeneous analyte binding model (eq. 2) to fit SPR kinetics (left and middle panels of Fig. 2A). This model described the curves reasonably well, allowing us to deduce reaction and affinity constants (Table I). Given that HD1 interacts predominantly with exosite I and secondly with exosite II (Trapaidze et al., 2015), we assigned the high and low affinity reaction constants to exosite I and II, respectively. We
used the same postulate for NU172 given its reported dominant interaction with exosite I.
Focusing on exosite I, we observe an onset of the half-life of thrombin-aptamer complex from 225 to 277 s for NU172 vs. HD1, respectively. Due to the higher association constant of 7.8 x 10⁶ vs. 2.1 x 10⁶ M-1s-1 for NU172 and HD1, respectively, we
thus deduce that the affinity of NU172 towards exosite I of 0.4 nM was higher than that of HD1 of 1.2 nM. Exosite II is specifically targeted by HD22 with the best and highest affinity of 3.2 nM, followed by HD1 (17.4 nM) and NU172 (47 nM). Interestingly, association constants for all of these three aptamers are similar (1.9, 1.1 and 1.1 x 10⁶ M -1s-1 for HD1, NU172 and HD22, respectively), but the HD22-thrombin complex
dissociation is 10 times slower. Consequently HD22 appears to be superior to HD1 and NU172 in terms of stability and specificity of interaction to thrombin.
3.3.2. Interaction kinetics with prothrombin
We then wished to evaluate whether HD22 specificity was conserved in the presence of prothrombin (Crawley et al., 2007). Thrombin exosite I is located on the surface of prothrombin and accessible for interaction, although with different binding properties, hence its common name proexosite I (Anderson et al., 2000). On the other hand, exosite II is well hidden inside prothrombin (Kretz et al., 2006). HD1 interacts with proexosite I (Kretz et al., 2006) with an affinity comparable to that for thrombin (Müller et al., 2008), yet kinetic parameters of the binding reaction remain elusive.
Knowing that minute concentration of thrombin can initiate cleavage of prothrombin and autocatalyze its own production, we added 50 µM argatroban in the running buffer so as to keep the prothrombin concentration constant. Argatroban indeed reversibly binds to thrombin active site (Müller et al., 2008) and inhibits its interaction with prothrombin. As expected from structural data, binding to prothrombin was exclusively observed with HD1 and NU172 (left and middle panel of Fig. 2B).
Kinetics of interaction of prothrombin with HD1 was different than that with thrombin, as shown by the doubling of SPR response for equivalent prothrombin concentration. In addition, HD1 interaction with prothrombin shows very fast association dynamics with no equilibrium, and stiff dissociation dynamics that do not reach the baseline. The shape of the sensogram suggests that interaction belongs to the class of “difficult-to-interpret” SPR data (Rich and Myszka, 2008), in which two or several interactions contribute to the signal. For NU172, the intensity of the response was several times higher with prothrombin than thrombin, yet association and dissociation phases were consistent with a single reaction pathway.
For the sake of simplicity, we assign the very high on- and off- rate to HD1 binding to proexosite I of prothrombin and fitted with 1:1 binding model to roughly estimate rate constants (table 1), and carry out the same analysis for NU172. It is unclear why NU172 and HD1 behave so differently, yet their binding modes do not seem to allow the identification of thrombin and prothrombin in a reaction mixture. To validate this
hypothesis, we prepared a series of 6 mixes composed of various proportions of thrombin and prothrombin at a total protein concentration of 50 nM (sensograms are reported in supplementary Fig. S4). We computed the binding rate at every time point by differentiating the SPR signal during the first 20 seconds (Fig. 2C). HD22 allowed us to produce optimal results with a linear increase of the binding rate with thrombin concentration (right panel of Fig. 2C). An opposite trend was observed with HD1, showing the titration of prothrombin rather than thrombin (left panel of Fig. 2C). Finally we do not detect significant trends in the case of NU172, showing its irrelevance for thrombin vs. prothrombin detection. Altogether our results confirm that specific detection of thrombin can be achieved with HD22 only.
3.4. Aptamer interaction with thrombin-inhibitor complexes
The regulation of thrombin is achieved by inhibition of thrombin active sites by the three main natural inhibitors Antithrombin III, Heparin cofactor II, and Alpha-2-macroglobulin (A2M) (Huntington, 2014; Jesty, 1986), which are present in the blood at µmolar concentrations (Coan and Roberts, 1989; Myles et al., 1998; Noda et al., 2002). Therefore we examined whether thrombin complexed with these inhibitors could be detected by SPR. For this, 12.5 nM thrombin was incubated with ATIII, HCII, and A2M at various concentrations spanning 12.5 to 800 nM during 30 minutes at room temperature, and the complex was flowed over immobilized aptamers to record sensograms (Fig. 3 and Sup. Fig. S4).
For stoichiometric conditions, the SPR response was comparable to that obtained with pure 12.5 nM thrombin for HD1 and HD22, but not for NU172. The SPR signal for HD22 was considerably lower at higher concentrations of ATIII, as expected from ATIII inhibition of exosite II. More surprising was the absence of signal for HD1, since the binding of ATIII should not sterically impede its association to exosite I. It may be proposed that the binding of ATIII has an allosteric effect on thrombin, which distorts the topography of exosites I (Parekh et al., 2008), as was suggested in several studies (Fredenburgh et al., 1997; Petrera et al., 2009). We also investigated whether aptamer-thrombin complexes could be destabilized by free ATIII. We used different concentrations of ATIII conveyed on thrombin-aptamer complexes (Supp. Fig. S5). Whereas injection of 200 nM ATIII promoted thrombin dissociation from HD1, HD22- thrombin complex remained stable even at 1 µM ATIII.
We then carried out the same study with HCII, which uses exosite I for docking when binding to thrombin (Baglin et al., 2002) with an on-rate of kon=1.1x10³ M-1s-1
(Myles et al., 1998). Our data showed mild yet notable interaction of the three TBA with 0.4 µM HCII (dark purple dataset in Fig. 3), showing the residual affinity for this thrombin inhibitor at the µM range. Next we performed the experiment by gradually increasing the amount of HCII for a constant amount of thrombin (middle panel in Fig. 3). For HD1 and HD22, a gradual diminution of the signal as HCII concentration increased was detected. This signal was likely associated to the detection of uninhibited
thrombin, which progressively decreased as HCII concentration increased. As for ATIII, the binding of HCII to exosite I seems to block HD22 interaction with exosite II, hinting to the existence of an allosteric mechanism. We deduce that thrombin-HCII complex, once formed, is invisible to all TBAs.
A2M is a large molecule with a molecular weight of 720 kDa, which is composed of four identical subunits forming a cavity that likely traps thrombin with an association constant of kon=2.5x10³ M-1s-1 (Feinman et al., 1985). The sensograms were very similar
to those obtained for HCII, and they were interpreted by the gradual association of thrombin to A2M. Note that NU172 showed a residual affinity to A2M at 400 nM, which accounted for the large signal measured with 800 nM A2M with 12.5 nM thrombin.
Altogether, this study shows that thrombin in complex with physiological inhibitors becomes essentially transparent to TBA. This result is obtained whether or not the inhibitor interacts with the target site of the aptamer. This result is positive, because it implies that free thrombin can be specifically detected in the blood. Yet because this protein is highly regulated in the blood, the fraction of free thrombin may be minimal unless dramatic bleeding occurs.
3.5. Study of aptamer specificity in native-like environment
We showed that TBA possess low nanomolar affinity to thrombin, but also that ambiguous binding modes co-exist for HD1 and NU172. We now wish to investigate how TBA behave in real environment, such as plasma or blood.
3.5.1. Interaction with bovine serum albumin (BSA)
Before performing SPR experiments with plasma, we tested whether TBA interact with the most abundant plasma protein, namely serum albumin, which is present at ~500 μM concentration. Its ability to interact with wide array of molecules makes serum albumin a susceptible candidate for nonspecific interactions with aptamers. We thus recorded the sensograms with immobilized HD1, HD22 and NU172 and various concentrations of BSA spanning 12.5 nM-3.2 μM (Fig. 4). The maximum BSA concentration corresponded to that present in plasma diluted 100 times, i.e. the conditions used in the following section. Note that we assumed that the structural similarities between bovine and human serum albumin (HSA) should lead to comparable effects, although our analysis was strictly focused on BSA.
For BSA concentrations below 200 nM, nonspecific interactions were undetectable for the three aptamers. Above 800 nM, a signal was observed with HD1 and NU172, but not with HD22 (Fig. 4). The nonspecific signal amplitude for a BSA concentration of 3.2 μM represented half of that measured with 12.5 nM thrombin. This result suggests that affinity of HD1 and NU172 to BSA is in the µM range, and implies that the contribution of serum albumin in plasma should degrade the detection limit of thrombin for these two aptamers. Nevertheless we confirmed that 12.5 nM thrombin could be detected with every TBA in a sample containing 800 nM BSA (dark purple curves in Fig. 4). Notably
this experiment also showed that the thrombin signal in presence of BSA was slightly reduced in comparison to thrombin alone, and this effect was more prominent for HD22 with a difference of 40% (Fig. 4C). The residual non-specific interaction of serum proteins may blur out the SPR signal partially. This contribution should not be overlooked, if a precise measurement of thrombin in real environments is required.
3.5.2. Interaction with plasma
Plasma contains 60-80 mg/ml of proteins in addition to various small molecules such as salts, lipids, amino acids, and sugars. Performing SPR measurement within such a rich environment represents a challenge for the instrument, which is generally tackled with diluted plasma (Ligler, 2009). Given the poor selectivity of NU172, we focused our analysis on HD1 and HD22 in order to conduct a case study with one low- and one high-sensitivity aptamer. We used murine plasma centrifuged and filtered prior to experiment and diluted 1000 or 100 times in PBS supplemented with nonspecific binding reducer (NSBr) buffer, as suggested by the manufacturer. The main component of NSBr is negatively charged carboxymethyl dextran, which has a similar structure to the dextran matrix on the sensor surface and competes for positively charged components of plasma.
Using 1 mg/mL of NSBr following the SPR manufacturer recommendation, nonspecific interaction of plasma with the surface was predominant. Both aptamers failed to show meaningful responses for plasma samples spiked with 6.25, 12.5 and 25 nM thrombin (not shown), mostly because the surface could not be efficiently regenerated. Plasma was thus diluted 100 or 1000 times in 10 mg/ml NSBr. Residual interactions expectedly prevailed for HD1 (Fig. 5): the sensogram showed an increase of the signal using 0.1% plasma without thrombin for HD1 but not for HD22 (red datasets). After increasing the amount of plasma to 1%, the amplitude of the signal with HD1 was comparable with or without spiked thrombin, definitely ruling out the potential of this aptamer for biosensing. Notably, given that NU172 also interacts with exosite I and that its specificity to thrombin is weak even in reconstituted systems, we anticipate that similar results would be obtained with this aptamer. Conversely HD22 performed well to identify thrombin in 1% plasma samples spiked with 12.5, 50 and again 12.5 nM thrombin (Fig. 5B pink, blue and purples curves). Furthermore the amplitude of the signal was comparable to that obtained with the same thrombin concentration in PBS (cyan curve).
Consequently, HD22 showed much better performances for thrombin detection than HD1. Furthermore the difference between experiments carried out with 1 or 10 mg/mL NSBr highlights how adequate preparation of the sample to reduce non-specific interaction leads to significant improvements in detection performances.
4. Conclusion
We rigorously characterized interaction properties of three TBA HD1, NU172 and HD22 by SPR. For thrombin detection in plasma, HD22 appeared to be the only aptamer with sufficient affinity and specificity. HD1 and NU172 exhibited multiple residual interactions toward different sites of thrombin, prothrombin, thrombin-inhibitors, as well as serum proteins that seriously compromised their performances for biosensing in complex environments. While we demonstrated the detection of thrombin at 20 nM in 100-fold diluted plasma, it is unclear that these performances are sufficient for point-of-care devices. Indeed, we coarsely estimate the threshold thrombin level in blood circulation at ~10 nM, meaning that a detection limit of 0.1 nM should be achieved in 100 times diluted plasma. This concentration level is lower than our results with HD22, yet the rapid development of high performance aptasensors may fill this gap for industrial deployment of aptamers.
Finally without any a priori on the quality of the selection process that defined the three aptamers sequences, one may ask why HD22 performs so much better than the two others. Given that HD1 and HD22 measure 15 and 29 bp, respectively, it may be argued that the length of an aptamer is a key parameter to guarantee specific interactions though larger surfaces of interaction (Trapaidze et al., 2015). This modification can be easily tailored at the early stage of the SELEX by defining an initial library of molecules with more nucleotides. Although the crystal structure of NU172 is not available, its length of 26 bp and its poor specificity cannot support this hypothesis. Alternatively the choice of the binding site may be critical to achieve high selectivity. Unfortunately it is technically challenging to address a specific epitope in a target protein during the SELEX process. We therefore suggest that the development of new SELEX approaches for specific epitope targeting will be beneficial to the industrial deployment of aptasensors.
5. Acknowledgments
This work was supported by the LAAS-CNRS technology platform, a member of the French Basic Technology Research Network. A.T. thanks the French ministry of research for PhD funding. The authors thank Dr. Mathieu Danel and Martine Taillez for technical support at the Institute of Advanced Technologies in Life Sciences, and the laboratory of E2C department at SANOFI.
6. References
Al Dieri, R., de Laat, B., Hemker, H.C., 2012. Thrombin generation: What have we learned? Blood Rev. 26, 197–203.
Anderson, P.J., Nesset, A., Dharmawardana, K.R., Bock, P.E., 2000. Characterization of proexosite I on prothrombin. J. Biol. Chem. 275, 16428–16434.
ARCA Biopharma, n.d. Study of NU172 as Anticoagulation in Patients Undergoing Off-pump CABG Surgery - Full Text View - ClinicalTrials.gov [WWW Document]. URL http://clinicaltrials.gov/show/NCT00808964 (accessed 10.14.14).
Baglin, T., 2005. The measurement and application of thrombin generation. Br. J. Haematol. 130, 653–661.
Baglin, T.P., Carrell, R.W., Church, F.C., Esmon, C.T., Huntington, J.A., 2002. Crystal structures of native and thrombin-complexed heparin cofactor II reveal a multistep allosteric mechanism. Proc. Natl. Acad. Sci. 99, 11079–11084.
Berntorp, E., Salvagno, G.L., 2008. Standardization and clinical utility of thrombin-generation assays. Semin. Thromb. Hemost. 34, 670–682.
Bock, L.C., Griffin, L.C., Latham, J.A., Vermaas, E.H., Toole, J.J., 1992. Selection of single-stranded DNA molecules that bind and inhibit human thrombin. Nature 355, 564–566.
Bode, W., 2006a. Structure and interaction modes of thrombin. Blood Cells. Mol. Dis. 36, 122–130.
Bode, W., 2006b. The structure of thrombin: a janus-headed proteinase. Semin. Thromb. Hemost. 32 Suppl 1, 16–31.
Buff, M.C.R., Schäfer, F., Wulffen, B., Müller, J., Pötzsch, B., Heckel, A., Mayer, G., 2009. Dependence of aptamer activity on opposed terminal extensions: improvement of light-regulation efficiency. Nucleic Acids Res. gkp1148.
Butenas, S., Veer, C. van’t, Mann, K.G., 1999. “Normal” Thrombin Generation Presented in part at the XVIth Congress of the International Society on Thrombosis and Haemostasis, June 6-12, 1997, Florence, Italy (abstr PS-1653), at the 15th International Congress on Thrombosis, October 16-21, 1998, Antalya, Turkey (abstr 234), and at the 40th Annual Meeting of the American Society of Hematology, December 4-8, 1998, Miami Beach, FL (abstr 151). Blood 94, 2169– 2178.
Castoldi, E., Rosing, J., 2011. Thrombin generation tests. Thromb. Res., Papers and Abstracts of The 4th International Symposium on Women’s Health Issues in Thrombosis and Haemostasis 127, Supplement 3, S21–S25.
Coan, M.H., Roberts, R.C., 1989. A redetermination of the concentration of alpha 2-macroglobulin in human plasma. Biol. Chem. Hoppe. Seyler 370, 673–676.
Crawley, J.T.B., Zanardelli, S., Chion, C.K.N.K., Lane, D.A., 2007. The central role of thrombin in hemostasis. J. Thromb. Haemost. 5, 95–101.
Davis, S., 1994. Kinetic Characterization of Thrombin-Aptamer Interactions. Biajournal, application note 305 1, 29.
Deng, B., Lin, Y., Wang, C., Li, F., Wang, Z., Zhang, H., Li, X.-F., Le, X.C., 2014. Aptamer binding assays for proteins: The thrombin example—A review. Anal. Chim. Acta 837, 1–15.
Di Cera, E., 2007. Thrombin as procoagulant and anticoagulant. J. Thromb. Haemost. JTH 5 Suppl 1, 196–202.
Englebienne, P., Hoonacker, A.V., Verhas, M., 2003. Surface plasmon resonance: principles, methods and applications in biomedical sciences. J. Spectrosc. 17, 255–273.
Feinman, R.D., Yuan, A.I., Windwer, S.R., Wang, D., 1985. Kinetics of the reaction of thrombin and alpha 2-macroglobulin. Biochem. J. 231, 417–423.
Fenton, J.W., Fasco, M.J., Stackrow, A.B., 1977. Human thrombins. Production, evaluation, and properties of alpha-thrombin. J. Biol. Chem. 252, 3587–3598.
Fredenburgh, J.C., Stafford, A.R., Weitz, J.I., 1997. Evidence for allosteric linkage between exosites 1 and 2 of thrombin. J. Biol. Chem. 272, 25493–25499.
Hasegawa, H., Taira, K., Sode, K., Ikebukuro, K., 2008. Improvement of Aptamer Affinity by Dimerization. Sensors 8, 1090–1098.
Hemker, H.C., Al Dieri, R., De Smedt, E., Béguin, S., 2006. Thrombin generation, a function test of the haemostatic-thrombotic system. Thromb. Haemost. 96, 553–561. Hianik, T., Ostatná, V., Sonlajtnerova, M., Grman, I., 2007. Influence of ionic strength, pH
and aptamer configuration for binding affinity to thrombin. Bioelectrochemistry Amst. Neth. 70, 127–133.
Huntington, J.A., 2014. Natural inhibitors of thrombin. Thromb. Haemost. 111, 583–589. HUTABARAT, R., 2010. Anti-Thrombin aptamer formulations and methods for use.
WO/2010/033167.
Jayasena, S.D., 1999. Aptamers: an emerging class of molecules that rival antibodies in diagnostics. Clin. Chem. 45, 1628–1650.
Jesty, J., 1986. The kinetics of inhibition of alpha-thrombin in human plasma. J. Biol. Chem. 261, 10313–10318.
Kretz, C.A., Stafford, A.R., Fredenburgh, J.C., Weitz, J.I., 2006. HD1, a thrombin-directed aptamer, binds exosite 1 on prothrombin with high affinity and inhibits its activation by prothrombinase. J. Biol. Chem. 281, 37477–37485.
Lane, D.A., Philippou, H., Huntington, J.A., 2005. Directing thrombin. Blood 106, 2605– 2612.
Ligler, F.S., 2009. Perspective on Optical Biosensors and Integrated Sensor Systems. Anal. Chem. 81, 519–526.
Lin, P.-H., Chen, R.-H., Lee, C.-H., Chang, Y., Chen, C.-S., Chen, W.-Y., 2011. Studies of the binding mechanism between aptamers and thrombin by circular dichroism, surface plasmon resonance and isothermal titration calorimetry. Colloids Surf. B Biointerfaces 88, 552–558.
Macaya, R.F., Waldron, J.A., Beutel, B.A., Gao, H., Joesten, M.E., Yang, M., Patel, R., Bertelsen, A.H., Cook, A.F., 1995. Structural and Functional Characterization of Potent Antithrombotic Oligonucleotides Possessing Both Quadruplex and Duplex Motifs. Biochemistry (Mosc.) 34, 4478–4492.
Mann, K.G., 2003. Thrombin*: Can’t live without it; probably die from it. Chest 124, 1S– 3S.
Mayer, G., Rohrbach, F., Pötzsch, B., Müller, J., 2011. Aptamer-based modulation of blood coagulation. Hämostaseologie 31, 258–263.
Müller, J., Freitag, D., Mayer, G., Pötzsch, B., 2008. Anticoagulant characteristics of HD1-22, a bivalent aptamer that specifically inhibits thrombin and prothrombinase. J. Thromb. Haemost. JTH 6, 2105–2112.
Myles, T., Church, F.C., Whinna, H.C., Monard, D., Stone, S.R., 1998. Role of Thrombin Anion-binding Exosite-I in the Formation of Thrombin-Serpin Complexes. J. Biol. Chem. 273, 31203–31208.
Noda, A., Wada, H., Kusiya, F., Sakakura, M., Onishi, K., Nakatani, K., Gabazza, E.C., Asahara, N., Tsukada, M., Nobori, T., Shiku, H., 2002. Plasma levels of heparin cofactor II (HCII) and thrombin-HCII complex in patients with disseminated
intravascular coagulation. Clin. Appl. Thromb. Off. J. Int. Acad. Clin. Appl. Thromb. 8, 265–271.
Nordenman, B., NYSTRöm, C., BJörk, I., 1977. The Size and Shape of Human and Bovine Antithrombin III. Eur. J. Biochem. 78, 195–203.
Nossel, H.L., Yudelman, I., Canfield, R.E., Butler, V.P., Spanondis, K., Wilner, G.D., Qureshi, G.D., 1974. Measurement of Fibrinopeptide A in Human Blood. J. Clin. Invest. 54, 43–53.
Ofosu, F.A., 2006. Review: Laboratory markers quantifying prothrombin activation and actions of thrombin in venous and arterial thrombosis do not accurately assess disease severity or the effectiveness of treatment. Thromb. Haemost. 96, 568– 577.
O’Shannessy, D.J., Brigham-Burke, M., Soneson, K.K., Hensley, P., Brooks, I., 1993. Determination of rate and equilibrium binding constants for macromolecular interactions using surface plasmon resonance: use of nonlinear least squares analysis methods. Anal. Biochem. 212, 457–468.
Padmanabhan, K., Tulinsky, A., 1996. An Ambiguous Structure of a DNA 15-mer Thrombin Complex. Acta Crystallogr. D Biol. Crystallogr. 52, 272–282.
Pagano, B., Martino, L., Randazzo, A., Giancola, C., 2008. Stability and Binding Properties of a Modified Thrombin Binding Aptamer. Biophys. J. 94, 562–569.
Parekh, P., Martin, J., Chen, Y., Colon, D., Wang, H., Tan, W., 2008. Using Aptamers to Study Protein–Protein Interactions, in: Werther, M., Seitz, H. (Eds.), Protein – Protein Interaction, Advances in Biochemical Engineering/Biotechnology. Springer Berlin Heidelberg, pp. 177–194.
Pelzer, H., Schwarz, A., Heimburger, N., 1988. Determination of human thrombin-antithrombin III complex in plasma with an enzyme-linked immunosorbent assay. Thromb. Haemost. 59, 101–106.
Pelzer, H., Schwarz, A., Stüber, W., 1991. Determination of human prothrombin activation fragment 1 + 2 in plasma with an antibody against a synthetic peptide. Thromb. Haemost. 65, 153–159.
Petrera, N.S., Stafford, A.R., Leslie, B.A., Kretz, C.A., Fredenburgh, J.C., Weitz, J.I., 2009. Long Range Communication between Exosites 1 and 2 Modulates Thrombin Function. J. Biol. Chem. 284, 25620–25629.
Pinto, A., 2012. Real-time aptapcr: a novel approach exploiting nucleic acid aptamers for ultrasensitive detection of analytes for clinical diagnostic and in food analysis. Rovira I Virgili.
Que-Gewirth, N.S., Sullenger, B.A., 2007. Gene therapy progress and prospects: RNA aptamers. Gene Ther. 14, 283–291.
Quinn, C., Hill, J., Hassouna, H., 2000. A guide for diagnosis of patients with arterial and venous thrombosis. Clin. Lab. Sci. J. Am. Soc. Med. Technol. 13, 229–238.
Russo Krauss, I., Merlino, A., Giancola, C., Randazzo, A., Mazzarella, L., Sica, F., 2011. Thrombin-aptamer recognition: a revealed ambiguity. Nucleic Acids Res. 39, 7858–7867.
Russo Krauss, I., Merlino, A., Randazzo, A., Novellino, E., Mazzarella, L., Sica, F., 2012. High-resolution structures of two complexes between thrombin and thrombin-binding aptamer shed light on the role of cations in the aptamer inhibitory activity. Nucleic Acids Res. 40, 8119–8128.
Russo Krauss, I., Pica, A., Merlino, A., Mazzarella, L., Sica, F., 2013. Duplex–quadruplex motifs in a peculiar structural organization cooperatively contribute to thrombin binding of a DNA aptamer. Acta Crystallogr. D Biol. Crystallogr. 69, 2403–2411.
Siller-Matula, J.M., Schwameis, M., Blann, A., Mannhalter, C., Jilma, B., 2011. Thrombin as a multi-functional enzyme. Focus on in vitro and in vivo effects. Thromb. Haemost. 106, 1020–1033.
Tappenden, K.A., Gallimore, M.J., Evans, G., Mackie, I.J., Jones, D.W., 2007. Thrombin generation: a comparison of assays using platelet-poor and -rich plasma and whole blood samples from healthy controls and patients with a history of venous thromboembolism. Br. J. Haematol. 139, 106–112.
Tasset, D.M., Kubik, M.F., Steiner, W., 1997. Oligonucleotide inhibitors of human thrombin that bind distinct epitopes. J. Mol. Biol. 272, 688–698.
Trapaidze, A., Bancaud, A., Brut, M., 2015. Binding modes of thrombin binding aptamers investigated by simulations and experiments. Appl Phys Lett 106,
Tuerk, C., Gold, L., 1990. Systematic evolution of ligands by exponential enrichment: RNA ligands to bacteriophage T4 DNA polymerase. Science 249, 505–508.
White, R., Rusconi, C., Scardino, E., Wolberg, A., Lawson, J., Hoffman, M., Sullenger, B., 2001. Generation of species cross-reactive aptamers using “toggle” SELEX. Mol. Ther. J. Am. Soc. Gene Ther. 4, 567–573.
Table
Table I. Reaction and affinity constants of HD1, NU172 and HD22 aptamers. Table I. Reaction and affinity constants of HD1, NU172 and HD22 aptamers. Aptamer Fitting model Binding site ka 106 M-1s-1 kd 10-3 s-1 Kd 10-9 M Residence time (s) HD1 H. A. Exosite I 2.12±0.10 2.52 ±.0.28 1.19±0.15 277.2 Exosite II 1.91±0.31 32.60±4.90 17.4±3.60 21.3 NU172 H. A. Exosite I Exosite II 8.12±0.10 1.10±0.06 3.06±0.11 51.7±5.10 0.38±0.02 46.9±6.50 225.3 13.4 HD22 1:1 Exosite II 1.02±0.10 3.20±0.13 3.16±0.34 216.6 HD1 1:1 Prothrombin 2.61±0.12 96.8±8.61 37.2±3.26 9.6 NU172 1:1 Prothrombin 4.56±0.47 14.9±0.27 3.26±0.33 46.4 HD22 1:1 Prothrombin - - - -
Figure Captions
Figure 1: Insights on thrombin-aptamer molecular interactions. (A) Molecular structures of prothrombin (4NZQ), thrombin (3U69) and thrombin complexes with HD1 (4HDII), HD22 (4I7Y), ATIII (1TB6) and HCII (1JMO).
Figure 2: Aptamer interaction with thrombin and prothrombin. (A) Sensograms of HD1, NU172, and HD22 in interaction with increasing concentrations of α-Thrombin spanning 0.78 to 50 nM. Red lines represent fits: best fit for HD1 and NU172 aptamers was achieved with heterogeneous analyte model; whereas 1:1 binding model was sufficient to describe interaction kinetics with HD22. (B) The three sensograms represent interaction kinetics of HD1, NU172 and HD22 aptamer with increasing concentrations of prothrombin incubated with 50 µM argatroban. Red lines represent fits with the 1-to-1 binding model. (C) Differentiated sensogram obtained with a 50 nM reaction mix containing various proportions of thrombin and prothrombin (see supplementary Fig. 4 for details) with the three aptamers. The inset in the middle panel is a zoom of the signal at its maximum.
Figure 3: Thrombin aptamer interaction in the presence of inhibitors. The three sensograms show interaction kinetics of HD1 (A), HD22 (B) and NU172 (C) with 12.5 nM thrombin pre-incubated with 400 nM of ATIII and A2M during 30 minutes and 1 hour with HCII.
Figure 4: TBA interaction with serum proteins. The three sensograms represent interaction kinetics of HD1 (A) , HD22 (B) and NU172 (C) with increasing concentrations of BSA spanning 12.5 nM to 3.2 μM BSA, as well as 800 nM BSA spiked with 12.5 nM Thrombin.
Figure 5: Thrombin detection in murine plasma. Sensograms of HD1 (A) and HD22 (B) in interaction with plasma diluted 100 or 1000 times spiked with 50 or 12.5 nM thrombin (run in duplicate). The dilution is carried out in PBS with 10 mg/mL NSB reducer.
Supplementary Material: Investigation of the selectivity of
thrombin-binding aptamers for thrombin titration in murine plasma
Ana Trapaidze1,2, Jean-Pascal Hérault3, Jean-Marc Herbert3, Aurélien Bancaud1,2,
Anne-Marie Gué1,2
1 CNRS, LAAS, 7 avenue du colonel Roche, F-31400 Toulouse, France 2 Univ de Toulouse, LAAS, F-31400 Toulouse, France
3 Sanofi, 195 route d’Espagne, F-31036 Toulouse, France
Correspondance: Anne-Marie Gué (gue@laas.fr) & Aurélien Bancaud (abancaud@laas.fr)
Data analysis of SPR kinetic experiments
In order to define the amount of immobilized aptamers, we used following relation specified by the manufacturer:
𝑅𝑙𝑖𝑔𝑎𝑛𝑑=
𝑅𝑚𝑎𝑥× 𝑀𝑟𝑙𝑖𝑔𝑎𝑛𝑑
𝑀𝑟𝑎𝑛𝑎𝑙𝑦𝑡𝑒× 𝑉𝑎𝑙𝑒𝑛𝑐𝑦𝑙𝑖𝑔𝑎𝑛𝑑
Rligand is immobilization level, Rmaxis the maximal theoretical response of ligand
analyte interaction, Mrligand and Mranalyte are molecular weights of a ligand and an analyte
respectively.
In general for kinetic experiments it is suggested to expect Rmax ≤ 100 RU. In our
case ligand is an aptamer with molecular weight Mrligand =10-15kDa, and the analyte is
thrombin with Mranalyte =36kDa, Valencyligand=1. After substituting the values we get that
suggested immobilization level should be around 35-40 RUs. In our experiments the immobilization level of the aptamers, as indicated in the manuscript, was around 40±4 RU, which corresponds to the experimental design suggestions.
Before analysis of a kinetic data, signals from the reference flow cells, with the same length scrambled sequence ssDNA, and blank sample were subtracted from the signal of sample cell, to exclude the contribution of all the nonspecific interactions with sensor matrix and ssDNA.
In order to access affinity and reaction rate contacts of thrombin or prothrombin interaction with aptamers, experimental data of SPR association and dissociation phases were fitted manually with appropriate integrated rate equations either for one-to-one interaction or more complex, heterogeneous analyte models derived below. Excel software solver was used to optimize floating global ka and kd and local Rmax parameters
with nonlinear least square method.
One-to-one binding
The most commonly used and the simplest model for description interaction of immobilized ligand and injected analyte is the Langmuir model (Eq. S1), applicable in the vast majority of cases. It assumes that one monovalent and homogenous analyte (A) interacts with homogenous ligand (L) and that all binding events are independent. Formed complex (LA) follows pseudo-first order kinetics, assuming that reaction is not mass transport limited. (o’shannessy 1993).
The association constant ka represents the rate of the complex formation, while
dissociation constant kd is the rate of complex decay. The rate equation describing AL
complex formation at time t, may be written as: 𝑑[𝐴𝐿] 𝑑𝑡 = 𝑘𝑎[𝐴][𝐿] − 𝑘𝑑[𝐴𝐿] (Eq. S2) 𝐴 + 𝐿 𝑘𝑎 ⇄ 𝑘𝑑 𝐴𝐿 (Eq. S1)
Taking in account that ligand concentration is solution stays constant, [𝐴]𝑡=
𝑐𝑜𝑛𝑠𝑡𝑎𝑛𝑡 and with reaction time ligand concentration changes[𝐿]𝑡= [𝐿]𝑚𝑎𝑥 − [𝐴𝐿]𝑡, then
𝑑[𝐴𝐿]
𝑑𝑡 = 𝑘𝑎[𝐴]([𝐿]𝑚𝑎𝑥− [𝐴𝐿]𝑡) − 𝑘𝑑[𝐴𝐿] (Eq. S3) Term [𝐿]𝑚𝑎𝑥 corresponds to maximum concentration of the ligand. The observed SPR signal R is proportional to formed complex, and the maximum possible signal Rmax will be
proportional to the maximum ligand concentration of the surface. Therefore equation (Eq. S3) becomes:
𝑑𝑅
𝑑𝑡 = 𝑘𝑎[𝐴]([𝑅]𝑚𝑎𝑥− 𝑅) − 𝑘𝑑𝑅 (Eq. S4) It is convenient to analyze data in terms of integrated form of rate equation (Eq. S4), since it directly derives ka and kd
𝑅𝑡 =
[𝐴]𝑅𝑚𝑎𝑥𝑘𝑎
[𝐴]𝑘𝑎+ 𝑘𝑑
(1 − 1
𝑒([𝐴]𝑘𝑎+𝑘𝑑)𝑡) (Eq. S5) Equation S5 gives advantage to derive ka and kd from single binding experiment.
When the analyte solution has traversed the flow cell and the buffer is injected instead, equations S4 and S5 will have following expressions:
𝑑𝑅
𝑑𝑡 = −𝑘𝑑𝑅 (Eq. S6)
𝑅𝑡 = 𝑅𝑎𝑒−𝑘𝑑𝑡 (Eq. S7)
The integrated rate equation of the dissociation process shows that rate of complex dissociation follows simple exponential decay. Ra is the signal level at the end of association
phase. If even after complete dissociation of the complex the response is not equal to zero, correction of the baseline might be achieved by adding again new fitting parameter R (t→∞), representing response after infinite time.
Heterogeneous analyte model
This model describes more complex interaction, when the immobilized ligand is interacting with bivalent or several species of analytes and the binding events are independent.
In the case of bivalent analyte, assuming that binding sites are not equivalent and have distinct association and dissociation rate constants and that only one site of the analyte interacts with the ligand at a time, integrated rate equations of association dissociation phases can be expressed by the equations (Eq. S8) and (Eq. S9)
𝑅𝑡 = [𝐴]𝑅𝑚𝑎𝑥𝑘𝑎1 [𝐴]𝑘𝑎1+ 𝑘𝑑1 (1 − 1 𝑒([𝐴]𝑘𝑎1+𝑘𝑑1)𝑡) + [𝐴]𝑅𝑚𝑎𝑥𝑘𝑎2 [𝐴]𝑘𝑎2+ 𝑘𝑑2 (1 − 1 𝑒([𝐴]𝑘𝑎2+𝑘𝑑2)𝑡) (Eq. S8) 𝑅𝑡 = 𝑅𝑎1𝑒−𝑘𝑑1𝑡+ 𝑅𝑎2𝑒−𝑘𝑑2𝑡 (Eq. S9)
Where ka1 and kd1 are reaction constants describing interaction of the first site of
the analyte and ka2 and kd2 are describing interaction of the second site. Ra1 and Ra2
represent corresponding amplitudes of dissociation. Concentration of the analyte [A] and Rmax are the same for both sites.
When the system of the analyte contains two different species of various concentrations [A1] and [A2], in this case integrated rate equation for association and dissociation phases will look like equations (Eq. S10) and (Eq. S9) respectively.
𝑅𝑡= [𝐴1]𝑅𝑚𝑎𝑥1𝑘𝑎1 [𝐴1]𝑘𝑎1+ 𝑘𝑑1 (1 − 1 𝑒([𝐴1]𝑘𝑎1+𝑘𝑑1)𝑡) + [𝐴2]𝑅𝑚𝑎𝑥2𝑘𝑎2 [𝐴2]𝑘𝑎2+ 𝑘𝑑2 (1 − 1 𝑒([𝐴2]𝑘𝑎2+𝑘𝑑2)𝑡) (Eq. S10)
Aptamer binding modes on thrombin
Figure S1: Comparison of the fits obtained with the 1:1 binding model vs. the heterogeneous analyte (H.A.) model for (A) HD1 and (B) NU172 interaction with thrombin. With the 1:1 binding model (left panels) fits poorly describe experimental data and the discrepancy becomes even larger at the dissociation phase. Heterogeneous analyte model (right panels), assuming that thrombin can interact with aptamers either through exosite I or exosite II, described interaction kinetics with better accuracy.
Multiple binding modes of HD1 and NU172
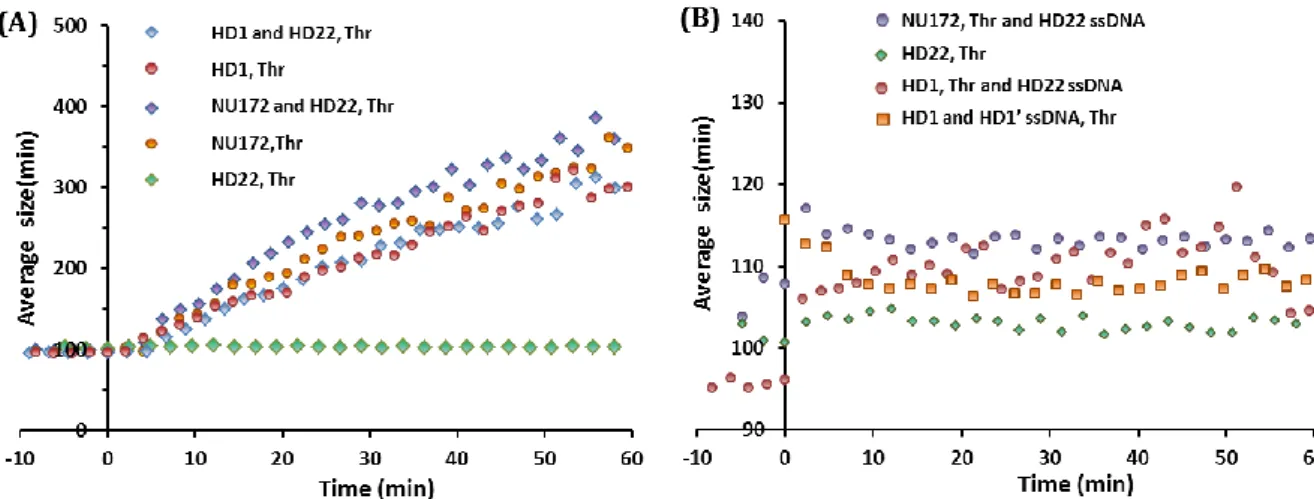
Figure S2: Aggregation assay to characterize the binding modes of HD1, HD22 and NU172. Aptamer modified gold nanoparticles (80 nm diameter) aggregate in the presence of thrombin if aptamers interact with the both exosites of thrombin simultaneously. (A) HD22 interacts specifically with thrombin exosite II, so aggregation only occurs whenever HD1 and HD22 coated nanoparticles are mixed. Conversely the multiple binding modes of HD1 and NU172 allowed us to trigger nanoparticle aggregation with these aptamers alone. (B) Saturating thrombin exosite II with single stranded HD22, inhibits aggregation of HD1 or NU172 capped gold nanoparticles, suggesting that HD1 and NU172 indeed interact with thrombin exosite II. (see (Trapaidze et al., 2015) for technical details)
Profiling thrombin contribution
Figure S3: Profiling thrombin contribution within thrombin/prothrombin mix. (A) Sensograms of HD1, NU172 and HD22 aptamer interaction with various composition thrombin and prothormbin composition. (B) The first derivatives of respective SPR signals during first 20 seconds of association phase.
Interaction of inhibitor-thrombin complexes with thrombin
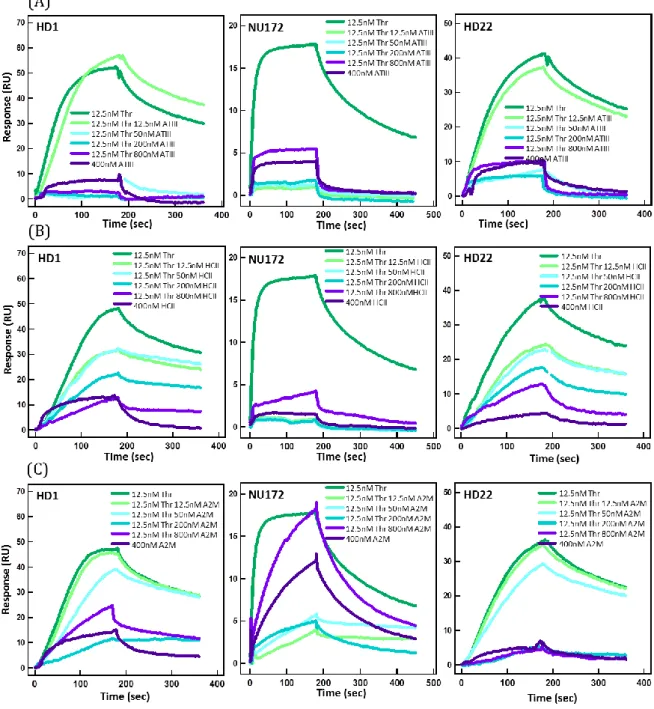
Figure S4: Interaction of inhibitor-thrombin complexes with thrombin. Sensograms of interaction of immobilized aptamers HD1, NU172, and HD22 with 12.5nM thrombin incubated for 30 minutes with increasing concentrations of (A ) ATIII,(B) HCII and (C) A2M spanning from 12.5 to 800 nM. Completely inhibited thrombin is invisible for interaction to all aptamers.
Interaction of aptamer-thrombin complexes with inhibitors
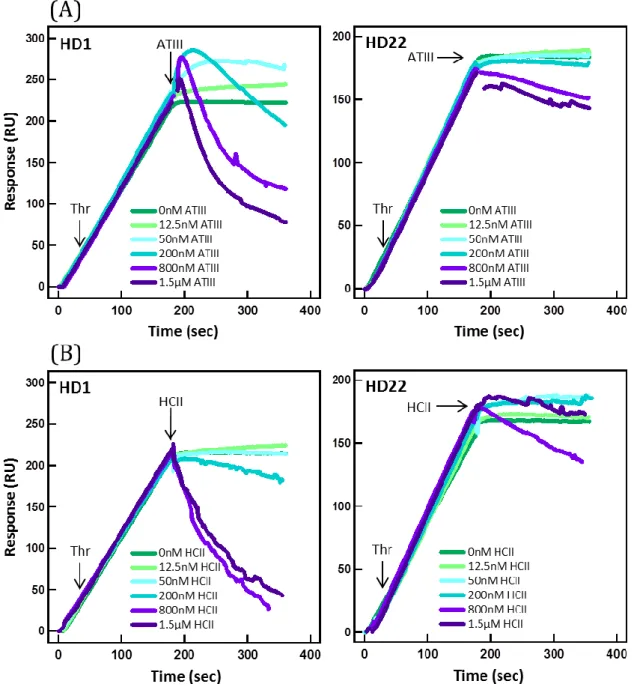
Figure S5: Interaction of thrombin-aptamer complex with inhibitors. Sensograms of interaction of increasing concentrations of (A) ATIII and (B) HCII with 12.5 nM thrombin bound to immobilized HD1 and HD22 aptamers. First, 12.5 nM thrombin was flown over the densely immobilized (about 500 RU) aptamers for 3 minutes and then, right away, increasing concentrations spanning 12.5 nM to 1.5 µM of inhibitor were injected. Starting from 200 nM concentration managed ATIII and HCII to bind thrombin and separate it from HD1 aptamer (left panels). Because HD22 binds thrombin with larger energy than HD1, binding and separating thrombin from HD22 was achieved only when inhibitors were present in concentration superior to 800 nM.