HAL Id: hal-01764694
https://hal-amu.archives-ouvertes.fr/hal-01764694
Submitted on 13 Apr 2018
HAL is a multi-disciplinary open access
archive for the deposit and dissemination of
sci-entific research documents, whether they are
pub-lished or not. The documents may come from
teaching and research institutions in France or
abroad, or from public or private research centers.
L’archive ouverte pluridisciplinaire HAL, est
destinée au dépôt et à la diffusion de documents
scientifiques de niveau recherche, publiés ou non,
émanant des établissements d’enseignement et de
recherche français ou étrangers, des laboratoires
publics ou privés.
tumour growth by stimulating non-productive
angiogenesis
Ewelina Krzywinska, Chahrazade Kantari-Mimoun, Yann Kerdiles, Michal
Sobecki, Takayuki Isagawa, Dagmar Gotthardt, Magali Castells, Johannes
Haubold, Corinne Millien, Thomas Viel, et al.
To cite this version:
Ewelina Krzywinska, Chahrazade Kantari-Mimoun, Yann Kerdiles, Michal Sobecki, Takayuki Isagawa,
et al.. Loss of HIF-1 alpha in natural killer cells inhibits tumour growth by stimulating non-productive
angiogenesis. Nature Communications, Nature Publishing Group, 2017, 8 (1),
�10.1038/s41467-017-01599-w�. �hal-01764694�
Loss of HIF-1
α in natural killer cells inhibits tumour
growth by stimulating non-productive angiogenesis
Ewelina Krzywinska
1
, Chahrazade Kantari-Mimoun
1
, Yann Kerdiles
2
, Michal Sobecki
3
, Takayuki Isagawa
4
,
Dagmar Gotthardt
5
, Magali Castells
1
, Johannes Haubold
6
, Corinne Millien
1
, Thomas Viel
1
, Bertrand Tavitian
1
,
Norihiko Takeda
7
, Joachim Fandrey
6
, Eric Vivier
2,8
, Veronika Sexl
3
& Christian Stockmann
1,9
Productive angiogenesis, a prerequisite for tumour growth, depends on the balanced release
of angiogenic and angiostatic factors by different cell types within hypoxic tumours. Natural
killer (NK) cells kill cancer cells and in
filtrate hypoxic tumour areas. Cellular adaptation to low
oxygen is mediated by Hypoxia-inducible factors (HIFs). We found that deletion of HIF-1
α in
NK cells inhibited tumour growth despite impaired tumour cell killing. Tumours developing in
these conditions were characterised by a high-density network of immature vessels, severe
haemorrhage, increased hypoxia, and facilitated metastasis due to non-productive
angio-genesis. Loss of HIF-1
α in NK cells increased the bioavailability of the major angiogenic
cytokine vascular endothelial growth factor (VEGF) by decreasing the in
filtration of NK cells
that express angiostatic soluble VEGFR-1. In summary, this identi
fies the hypoxic response in
NK cells as an inhibitor of VEGF-driven angiogenesis, yet, this promotes tumour growth by
allowing the formation of functionally improved vessels.
DOI: 10.1038/s41467-017-01599-w
OPEN
1Institut National de la Santé et de la Recherche Médicale (INSERM), Paris Cardiovascular Research Center, Unit 970, 56 Rue Leblanc, Paris 75015, France. 2Centre d’Immunologie de Marseille-Luminy, Aix Marseille Université UM2, Inserm, U1104, CNRS UMR7280, Avenue de Luminy, Marseille 13288, France. 3Institut de Biologie Intégrative de la Cellule (I2BC), Genome Biology, CEA/CNRS/Université Paris Sud, Avenue de la Terrasse, Gif sur Yvette, Paris 91190,
France.4Graduate School of Biomedical Science, Nagasaki University, 1-12-4 Sakamoto, Nagasaki 852-8523, Japan.5Institute of Pharmacology and Toxicology, University of Veterinary Medicine Vienna, Veterinärplatz 1, Viena 1210, Austria.6Institut für Physiologie, Universitätsklinikum Essen, Universität Duisburg-Essen, Essen 45147, Germany.7Department of Cardiovascular Medicine, Graduate School of Medicine, The University of Tokyo, Tokyo 113-8655,
Japan.8Immunologie, Hôpital de la Conception, Assistance Publique—Hôpitaux de Marseille, Aix-Marseille Université, Marseille 13005, France.9Institute of
Anatomy, University of Zurich, Winterthurerstrasse 190, Zurich CH-8057, Switzerland. Correspondence and requests for materials should be addressed to C.S. (email:[email protected])
123456789
A
ngiogenesis is required for tumour progression, and
involves release of angiogenic factors, including vascular
endothelial growth factor (VEGF)
1,2. In most tumours,
despite high vascular density, the vasculature differs from normal
vascular networks and is characterised by an inefficient blood
supply. Vessel abnormalities include increased permeability and
haemorrhage as well as decreased pericyte coverage, which
frequently cause tumour hypoxia and increased metastasis
3.
Therefore, angiostatic factors that counteract VEGF signalling are
also required for the formation of functional blood vessels and the
prevention of excessive angiogenesis
3–5. Hence, productive
angiogenesis depends on the balanced release of angiogenic and
angiostatic factors from both malignant and stromal cell types
3–7.
Natural killer (NK) cells are a subset of cytotoxic innate
lymphoid cells with a unique capacity to kill cancer cells and
restrict tumour growth as well as metastatic spread
8. Therefore,
adoptive NK cell transfer becomes increasingly important for the
treatment of various types of cancer
8. Moreover, NK cells are
believed to contribute to physiological angiogenesis during
pregnancy via the release of angiogenic factors
9. Yet, the role of
NK cells in pathological tumour angiogenesis remains ill defined.
Tumour infiltrating NK cells are likely required to operate in
hypoxic conditions and cellular adaptation to low oxygen is
mediated by Hypoxia-inducible transcription factors (HIFs), with
HIF-1 and HIF-2 being the most extensively studied
10–12. It is
commonly accepted that the hypoxic response plays a pivotal role
in guiding immune responses as well as driving angiogenesis
12,13.
Noteworthy, whereas adaptive immune responses may be
impaired by low oxygen, innate immune cells show a
pro-proangiogenic and proinflammatory response during hypoxia
and HIF-1 activation
12,13. Since NK cells unify features of both,
innate as well as adaptive immunity, it was key to study the
impact of the hypoxic response in this cell type.
Results
HIF-1α depletion impairs NK cell function and tumour
growth. Prompted by the observation that NKp46-expressing NK
cells infiltrate hypoxic tumours (Fig.
1
a), and in order to test the
role of HIF-1α in NK cells, we created an in vivo, targeted
deletion of HIF-1α in NK cells, via crosses of the loxP-flanked
HIF-1α allele
14to the Ncr1 (NKp46) promoter-driven Cre
recombinase
15,16, specific to NKp46-expressing innate lymphoid
cells
17, including NK cells (HIF-1α
fl+/fl+/Ncr1cre
+ mice, termed
HIF-1α KO). This results in efficient deletion of HIF-1α at the
mRNA and protein levels in isolated splenic NK cells
(Supple-mentary Fig.
1
a).
NK cell reactivity is strongly linked to NK cell maturation
which can be distinguished by the expression of CD27/CD11b
18along with the development of a repertoire of inhibiting and
activating receptors
19. Importantly, despite reduced numbers of
splenic NK cells, loss of HIF-1α did neither affect maturation, nor
the receptor repertoire of NK cells from different organs
(Supplementary Fig.
1
b–e).
To extend earlier reports on hypoxia and NK cell effector
function
20, and to specifically determine the impact of HIF-1α on
NK cell responsiveness, splenocytes from wild-type (WT) and
HIF-1α KO mice were stimulated with ligand-mediated activation
of the NK1.1 receptor, activating cytokines IL-12 and IL-18 or
unspecific activation by PMA/ionomycin under normoxia (20%
O2) and hypoxia (2% O2) for 6 h in vitro. In this setting, neither
hypoxia nor loss of HIF-1α had any effect on NK cell reactivity as
demonstrated by NK cell degranulation (CD107A+) and IFN-γ
expression (Supplementary Fig.
1
f). However, upon challenge
with the tumour target cells YAC-1 and V-abl
21, loss of HIF-1α
reduced the fraction of CD107A-positive and IFN-γ-positive NK
cells in normoxia and hypoxia (Fig.
1
b, c). This hyporeactivity
was not due to differences in surface receptor expression or
viability across genotypes (Supplementary Fig.
1
g, h) and could
not be rescued by cytokine stimulation with IL-2 or IL-15
(Fig.
1
b, c). These results indicated that HIF-1α is required for
NK cell-mediated tumour cell killing.
In order to address the impact of HIF-1α on NK
cell-dependent tumour growth control in vivo, we conducted
experiments with subcutaneous isografts of V-abl lymphomas
that are subject to NK cell-mediated killing
21. Surprisingly,
HIF-1α KO mice showed a reduction of tumour volumes of more
than 80% compared to tumours from WT littermates at endpoint
(day 18; Fig.
1
d). Flow cytometry data analysis showed that
infiltration of CD4 and CD8 lymphocytes was similar across
genotypes (Supplementary Fig.
1
i). Yet, despite reduced tumour
burden in HIF-1α KO mice, the number of tumour infiltrating
NK cells and as well as the expression of the cytotoxic effector
molecule Granzyme B in NK cells was lower than in lymphomas
from WT littermates (Fig.
1
e). These data suggest that reduced
lymphoma volumes in HIF-1α KO mice occur independently of
NK cell-mediated tumour cell killing.
HIF-1α in NK cells slows down angiogenesis. To test this
hypothesis, we analysed the effect of NK cell HIF-1α deficiency in
tumours that are less susceptible to NK cell-mediated lysis as
confirmed by in vitro activation and in vitro cytotoxicity assays
(Supplementary Fig.
2
a). Exposure of
“less-susceptible” colon
carcinoma (MC38) and Lewis Lung Carcinoma (LLC) cells to NK
cells resulted in no activation and less than 2% of specific tumour
cell lysis, regardless of the genotype or effector:target ratio
(Supplementary Fig.
2
a). In contrast, co-culture of
“susceptible”
V-abl cells with WT or HIF-1α KO NK cells, resulted in killing
efficiencies up to 75 and 50%, respectively. To this end, we
challenged our mice with subcutaneous MC38 and LLC cells
isografts. Again, tumours in HIF-1α KO mice had significantly
lower volumes at day 14 (Fig.
2
a, b and Supplementary Fig.
2
b),
despite a reduction in NK cell infiltration and a lower fraction of
degranulating CD107A
+NK cells (Supplementary Fig.
2
c). No
genotype-specific differences in infiltration of other immune cell
subsets were detectable (Supplementary Fig.
2
c), further
indicat-ing that impaired tumour growth in HIF-1α KO mice does not
primarily rely on NK cell cytotoxicity. Interestingly, quantitative
assessment of NK cell localisation relative to hypoxic areas within
the tumour by means of double immunofluorescence for NKp46
and the hypoxia-inducible surrogate marker glucose transporter-1
(Glut1) revealed that HIF-1α KO NK cells preferentially
accu-mulated in well oxygenated areas of the tumour and were less
abundant in hypoxic zones (Supplementary Fig.
2
d).
Macroscopic inspection of tumours revealed severe tumour
haemorrhage in isografts from HIF-1α KO mice (Fig.
2
b and
Supplementary Fig.
2
b), indicating an immature vascular
phenotype with excessive leakage. Therefore, we quantified
intratumoural amounts of albumin, a large serum protein that
does not extravasate across an intact vascular barrier and
therefore is indicative of pathologically increased vascular
permeability. Consistently, tumours from HIF-1α KO mice
showed an increase in extravasated albumin (Fig.
2
c and
Supplementary Fig.
2
e). This prompted us to analyse the tumour
vasculature in detail. Quantitative analysis of tumour vessel
density and pericyte coverage was then carried out using CD31
and
α-SMA, respectively, as markers for immunostaining. As
shown in Fig.
2
d and Supplementary Fig.
2
f, loss of HIF-1α in NK
cells resulted in a marked decrease of pericyte coverage, whereas
overall tumour vessel density did not change. This suggests that
the hypoxic response in tumour-infiltrating NK cells is essential
0 5 10 15 WT
*
*
*
**
**
**
*
*
*
0 10 20 30 40 WT HIF-1α KO*
*
**
**
**
*
**
*
**
**
*
*
*
0 10 20 30 40 50 WT HIF-1α KO 0 200 400 600 WT Tumour volume (mm 3) 4000 3000 2000 1000 0 % of NK1.1 +/NKp46 + in CD45 cells p = 0.0398 p = 0.0028 p = 0.0001 MFI of GzmB + NK cells HIF-1α KO HIF-1α KO WT w/o target cellsCtrl IL-2 IL-15 Ctrl IL-2 IL-15
HOX NOX HOX NOX HOX NOX HOX NOX HOX NOX HOX NOX HOX NOX HIF-1α KO YAC-1 v-ABL w/o target cells
Ctrl IL-2 IL-15 Ctrl IL-2 IL-15
HOX NOX HOX NOX HOX NOX HOX NOX HOX NOX HOX NOX HOX NOX YAC-1 v-ABL
***
***
% of CD107a + NK cells NOX – Normoxia (20% O2) HOX – Hypoxia (2% O2) NOX – Normoxia (20% O2) HOX – Hypoxia (2% O2) % of INF-γ + NK cellsa
b
e
c
d
Hypoxyprobe/NKp46Fig. 1 HIF-1α depletion in NK cells results in decreased cytotoxicity but delays tumour growth. a Representative image of tumour hypoxia in LLC isografts with the specific markers Hypoxyprobe (red), NKp46 (green), and nuclei (blue). b Splenocytes from WT and HIF-1α KO mice were stimulated with target cells (YAC-1 and V-abl lymphoma cells, Ratio E/T 1:1), in absence or presence of rhIL-2 and rmIL15. NK cell degranulation (CD107A+) andc INF-γ
expression were analysed byflow cytometry (n = 4 for each group). d Tumour volume analysis of V-abl tumours injected subcutaneously in WT and HIF-1α KO mice with representative images at endpoint, day 21 (n = 11 for each group). Scale bars in macroscopic figures indicate 5 mm. e Flow cytometry analysis for NK1.1, NKp46 (for NK cells), GzmB (for NK cell activation state) on V-abl tumours from WT and HIF-1α KO mice at endpoint, day 21 (n = 3). Statistical significance was determined by an unpaired Student’s t-test or one-way analysis of variance, where appropriate. Bars represent mean values; error bars indicate the s.e.m. Statistical significance is indicated as *P < 0.05, **P < 0.01, and ***P < 0.001. Scale bar, 100 μm
b
WT p = 0.022 ns 0 10 20 30 40 HIF-1α KO 0 1 2 3 0 200 400 600 800 1000 AngiostampTM 150 200 250 300 350 120 140 160 180 200 220 Range: 0–4.09E+05 Min: 1.49E+05 Max: 3.85E+05 ×103 counts Range: 0–2.42E+05 Min: 1.1E+05 Max: 2.21E+05 ×103 counts HypoxisenseTM WT MC38 HIF-1α KO HIF-1α KO HIF-1α KO HIF-1α KO HIF-1α KO GLUT1 CD31 Casp-3 6 8 10 12 14 0 500 1000 1500 2000 WT HIF-1α KO*
**
75 kDa Albumin B-actin 37 kDaCD31-positive area (arbitrary units)
Pericyte coverage (%) 1.5 1.0 0.5 0.0 p = 0.0003 WT HIF-1α KO WT HIF-1α KO WT GLUT1-positive area (arbitrary units) p = 0.014
Caspase 3-positive area (arbitrary units)
p = 0.0356 WT WT WT HIF-1α KO WT WT HIF-1α KO CD31 α-SMA Albumin/ β -actin ratio 2.5 2.0 1.5 1.0 0.5 0.0 WT HIF-1α KO Tumour volume (mm 3) MC38 Day
a
c
d
e
f
g
Fig. 2 Loss of HIF-1α in NK cells impairs tumour growth and promotes non-functional angiogenesis. a Tumour volume analysis of MC38 isografts injected subcutaneously in WT and HIF-1α KO mice (n = 10 for each group), b and representative images at endpoint, day 14. Scale bars in macroscopic figures indicate 5 mm.c Left: Western blot of albumin andβ-actin for MC38 tumours from WT and HIF-1α KO mice; Right: Quantitative analysis of intratumoural amounts of albumin for MC38 isografts from WT and HIF-1α KO mice (n = 8). d Left: representative images of simultaneous immunodetection of endothelial cells and pericytes in MC38 tumours with the specific markers CD31 and alpha smooth muscle actin (α-SMA); Right: Quantitative analysis of CD31-positive endothelial cells in WT and HIF-1α KO mice (n = 8) and pericyte coverage as assessed by α-SMA/CD31 co-localisation (n = 8). e Left: representative images of tumour hypoxia in MC38 isografts with the specific markers CD31 and GLUT1; Right: Quantitative analysis of hypoxic tumour areas (n = 8). f Left: representative images of caspase-3-positive area in MC38 tumours; Right: Quantitative analysis of caspase-3-positive areas (n = 10). g Representative images of non-invasivefluorescence molecular real-time imaging with the fluorescent probes AngioSense®and HypoxiSense®for
in vivo monitoring of angiogenesis and tumour oxygenation at day 8 after tumour inocculation. Statistical significance was determined by an unpaired Student’s t-test or one-way analysis of variance, where appropriate. Bars represent mean values; error bars indicate the s.e.m. Statistical significance is indicated as *P < 0.05, **P < 0.01, and ***P < 0.001. Scale bar, 100 μm
to prevent pericyte loss and to preserve a more mature vessel
phenotype during remodelling of the tumour vasculature.
Hypoxia is a typical feature of solid tumours and often a result
of an immature and non-functional vasculature, despite the
presence of a high-density vascular network
3,22. We found that
the more slowly growing tumours from HIF-1α KO mice had
markedly increased levels of hypoxia determined by Glut1
staining (Fig.
2
e and Supplementary Fig.
2
g), which also occurred
in areas with high vessel density along with increased tumour cell
death as assessed by caspase 3 staining (Fig.
2
f and
Supplemen-tary Fig.
2
h). This striking uncoupling of angiogenesis and
tumour oxygenation in HIF-1α KO mice was confirmed in an
independent experimental setup. We co-injected the
fluorescent
probes AngioSense
®, that binds to endothelial integrins that are
exposed during vascular remodelling and HypoxiSense
®, that
binds to hypoxia-inducible carbonic anhydrase IX, into
tumour-bearing mice at day 8 post-tumour inocculation when tumour
volumes are still similar across genotypes (Fig.
2
a). In vivo
real-time imaging of both probes then allows monitoring of
angiogenic activity and tumour hypoxia. This revealed increased
tumour hypoxia despite increased angiogenic activity HIF-1α KO
mice (Fig.
2
g) that preceeds differences in tumour growth kinetics
(Fig.
2
a). This led us to conclude that loss of HIF-1α in NK cells
induces non-productive angiogenesis.
NK cell HIF-1α deficiency increases VEGF bioavailability.
Functional angiogenesis and the formation of mature vessels
require the balanced release of angiogenic and angiostatic
fac-tors
3,4,6. Gene expression analysis for angiogenic and angiostatic
factors at endpoint (Supplementary Fig.
3
a) revealed, in addition
to changes in
fibroblast growth factor-2 and angiopoietin-2
expression, a marked decrease in the expression of the angiostatic
soluble form of VEGF receptor 1 (sVEGFR1) in tumours from
HIF-1α KO mice, whereas VEGF expression was similar across
genotypes (Supplementary Fig.
3
a). This pattern was confirmed
on tumour protein lysates by ELISA (Fig.
3
a and Supplementary
Fig.
3
b). sVEGFR1 binds and sequesters VEGF with high affinity,
thus reducing VEGF bioavailability and angiogenic signalling in
the tumour microenvironment
4,23. Hence, we determined
whe-ther VEGF-dependent signalling to the tumour endothelium was
affected by the loss of HIF-1α in NK cells. VEGFR2 is an
endo-thelial cell-specific receptor tyrosine kinase that is critical for
VEGF signalling
23. By immunoprecipitating VEGFR2 from
tumour lysates and probing with anti-phosphotyrosine followed
by anti-VEGFR2 antibody via Western blot, we quantified total
and activated VEGFR2 from whole tumour lysates
6. As shown in
Fig.
3
b and Supplementary Fig.
3
c, loss of HIF-1α in NK cells
significantly increased the ratio of phosphorylated VEGFR2
relative to total VEGFR2, when compared to WT conditions. The
ns WT WT 150 50,000 40,000 30,000 20,000 10,000 0 100 50 0 ns ns 0.0 ns ns 0 ns 0 1×10⁻⁸ 2×10⁻⁸ 3×10⁻⁸ ns ns ns sVEGFR1 (pg ml
–1 per mg of protein) 250 kDa
250 kDa VEGFR2 p-Tyr VEGF (pg ml –1 per mg of protein) Relatif expression to 18S Relatif expression to 18S 0 1×10⁻⁷ 2×10⁻⁷ 3×10⁻⁷ Relatif expression to 18S 0 0 1×10⁻⁶ 2×10⁻⁶ 3×10⁻⁶ 4×10⁻⁶ 2×10⁻⁶ 6×10⁻⁶ 4×10⁻⁶ 1×10⁻⁵ 8×10⁻⁶ Relatif expression to 18S Relatif expression to 18S 4×10⁻⁷ 3×10⁻⁷ 2×10⁻⁷ 1×10⁻⁷ 0.0 Relatif expression to 18S 2.0×10⁻⁶ 1.5×10⁻⁶ 1.0×10⁻⁶ 5.0×10⁻⁷ 0.0 Relatif expression to 18S Relatif expression to 18S 2.5×10⁻⁵ 2.0×10⁻⁵ 1.5×10⁻⁵ 1.0×10⁻⁵ 5.0×10⁻⁶ 1.5×10⁻⁵ 1.0×10⁻⁵ 5.0×10⁻⁶ sFLT1 / NK cells naive spleen sFLT1 / endothelial
cells naive spleen
sFLT1 / NK cells sFLT1 / endothelial cells Total FLT1 / endothelial cells Total FLT1 / NK cells Total FLT1 / endothelial cells naive spleen Total FLT1 / NK cells naive spleen HIF1α KO WT HIF1α KO WT HIF1α KO WT HIF1α KO WT HIF1α KO WT HIF1α KO WT HIF1α KO WT HIF1α KO WT p-Tyr/VEGFR-2 (fold ctrl) 2.0 1.5 1.0 0.5 0.0 p = 0.0003 HIF-1α KO WT HIF-1α KO HIF-1α KO p = 0.034
b
a
c
d
Fig. 3 NK cell HIF-1α deficiency increases VEGF bioavailability and endothelial cell migration. a Determination of levels of VEGF and sVEGFR1 protein in MC38 isografts implanted in WT and HIF-1α KO mice by ELISA at endpoint, day 14 (n = 8). b Immunoblotting for VEGFR2 and phosphotyrosine (p-Tyr) after immunoprecipitation of VEGFR2 from MC38 tumour lysates and ratio of p-Tyr and VEGFR2 signal intensities as measured by photon emission at endpoint, day 14 (n = 8). c Gene expression analysis for soluble variant of FLT1 and total form of FLT1 on sorted NK cells and endothelial cells from naïve spleens from WT and HIF-1α KO mice (n = 6). d Gene expression analysis for soluble variant of FLT1 and total form of FLT1 on sorted intratumoural NK cells and endothelial cells from MC38 tumours injected subcutaneously in WT and HIF-1α KO mice at endpoint, day 10 (n = 10). Statistical significance was determined by an unpaired Student’s t-test or one-way analysis of variance, where appropriate. Bars represent mean values; error bars indicate the s.e.m. Statistical significance is indicated as *P < 0.05, **P < 0.01, and ***P < 0.001
reduction in sVEGFR1 levels and subsequently enhanced
VEGFR2 activation suggests that NK cells critically contribute to
intratumoural sVEGFR1 levels and control VEGF bioavailability
in a HIF-1α-dependent manner.
Next, we compared the mRNA expression of sVEGFR1 and
total VEGFR1 in
flow-sorted endothelial cells and NK cells from
naive spleens from both genotypes. In the spleen, sVEGFR1
expression in NK cells was generally lower than in endothelial
cells (Fig.
3
c), without genotype-specific differences in splenic NK
cells from HIF-1α KO and WT mice (Fig.
3
c). This might be due
to the fact that the spleen is relatively well oxygenated under
steady state conditions (pO2
= 15–25 mm Hg) compared to
tumours. Interestingly,
flow-sorted, tumour-associated NK cells
from MC38 tumour-bearing HIF-1α KO mice showed similar
expression of sVEGFR1 at the mRNA and protein level across
genotypes (Fig.
3
d and Supplementary Fig.
3
d). This indicates
that, in contrast to splenic NK cells sVEGFR1 production in
tumour-infiltrating NK cells is induced by salvage pathways and
does not solely rely on HIF-1α expression. Therefore, the changes
in vascular phenotype under these conditions are related to a
reduced NK cell infiltration (Supplementary Fig.
2
c). Noteworthy,
the magnitude of sVEGFR1 expression in tumour-derived NK
cells was similar to tumour-sorted endothelial cells, a known
source of sVEGFR1 in hypoxic tumours
4(Fig.
3
d). This data led
us to conclude that NK cells are a relevant source of
intratumoural sVEGFR1, and that differential NK cell positioning
within hypoxic vs. normoxic tumour regions regulates tumour
angiogenesis (Supplementary Fig.
2
d).
Reconstitution of sVEGFR1 rescues the HIF-1
α KO phenotype.
To further corroborate the role of the HIF-1-sVEGFR1 axis in
NK cells for vascular remodelling and tumour growth, we
next analysed the effect of sVEGFR1 reconstitution on tumour
growth. For this purpose, we continuously delivered MC38-bearing
WT and HIF-1α KO mice with sVEGFR1 by means of
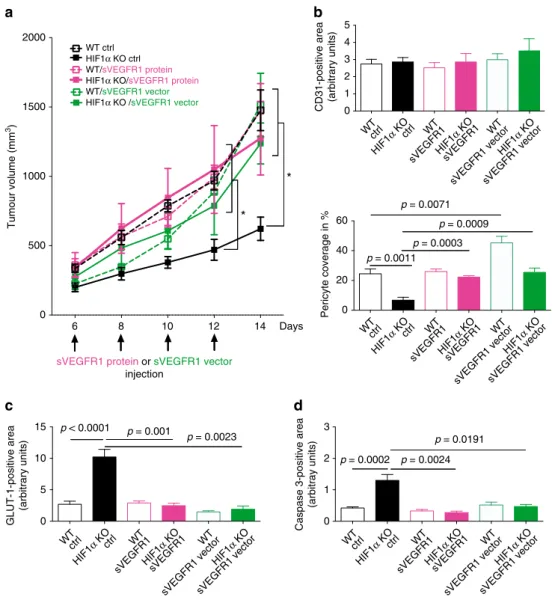
0 5 10 15 p = 0.0023 0 1 2 3 WTctrl HIF1 α KOctrl WT sVEGFR1HIF1 α KO sVEGFR1 WT sVEGFR1 vector HIF1 α KO sVEGFR1 vector WTctrl HIF1 α KOctrl WT sVEGFR1HIF1 α KO sVEGFR1 WT sVEGFR1 vector HIF1 α KO sVEGFR1 vector GLUT-1-positive area (arbitrary units) p = 0.001 p < 0.0001 p = 0.0191 p = 0.0024 p = 0.0002Caspase 3-positive area
(arbitray units) 6 8 10 12 14 0 500 1000 1500 2000
*
*
Days Tumour volume (mm 3)sVEGFR1 protein or sVEGFR1 vector injection
WT ctrl
HIF1α KO /sVEGFR1 vector
WT/sVEGFR1 vector
HIF1α KO/sVEGFR1 protein WT/sVEGFR1 protein HIF1α KO ctrl
a
0 1 2 3 4 5 0 20 40 60 p = 0.0003CD31-positive area (arbitrary units)
Pericyte coverage in % p = 0.0071 p = 0.0009 p = 0.0011 WTctrl HIF1 α KOctrl WT sVEGFR1HIF1 α KO sVEGFR1 WT sVEGFR1 vector HIF1 α KO sVEGFR1 vector WTctrl HIF1 α KOctrl WT sVEGFR1HIF 1α KO sVEGFR1 WT sVEGFR1 vector HIF1 α KO sVEGFR1 vector
b
c
d
Fig. 4 Reconstitution of sVEGFR1 rescues the HIF-1α KO phenotype. a Tumour volume analysis of MC38 isografts implanted in WT and HIF-1α KO mice after intratumoural injection with recombinant sVEGFR1 protein or sVEGFR1 vector at day 4, 6, 8, and 12 at endpoint, day 14. Control mice received intratumoural injections of 100μl PBS or ctrl vector. b Quantitative analysis of CD31-positive endothelial cells and pericyte coverage as assessed by α-SMA/CD31 co-localisation at endpoint, day 14.c Quantitative analysis of hypoxic tumour areas with the specific marker GLUT1 at endpoint, day 14. d Quantitative analysis of caspase-3-positive areas at endpoint, day 14 (n = 10 for ctrl group; n = 5 for sVEGFR1 protein injection group; n = 3 for sFLT1 vector injection group). Statistical significance was determined by an unpaired Student’s t-test or one-way analysis of variance, where appropriate. Bars represent mean values; error bars indicate the s.e.m. Statistical significance is indicated as *P < 0.05, **P < 0.01, and ***P < 0.001
intratumoural injection of the recombinant protein. Alternatively,
we employed a sVEGFR1 encoding plasmid on day 6 (when tumour
growth kinetics start to differ between genotypes, see Figs.
2
a,
4
a), 8,
10, and 12 post tumour inoculation (Fig.
4
a and Supplementary
Fig.
4
a). In tumour bearing WT mice, sVEGFR1 supplementation
increased pericyte coverage of tumour blood vessels, reminiscent of
vascular normalisation
24(Fig.
4
b). Yet, this change in vascular
morphology did not impact on tumour oxygenation (Fig.
4
c),
tumour cell death (Fig.
4
d) or overall tumour growth (Fig.
4
a). In
contrast, in HIF-1α KO mice, delivery of recombinant sVEGFR1
rescued growth of MC38 tumours (Fig.
4
a), along with an increase
in pericyte coverage (Fig.
4
b) and tumour oxygenation (Fig.
4
c) as
well as decrease in tumour cell death (Fig.
4
d). Noteworthy,
sVEGFR1 supplementation failed to rescue the infiltration defect of
HIF-1α KO NK cells and did not alter the infiltration of other
immune cell subsets (Supplementary Fig.
4
b). These data links
reduced tumour volumes to low intratumoural sVEGFR1 and
non-productive angiogenesis.
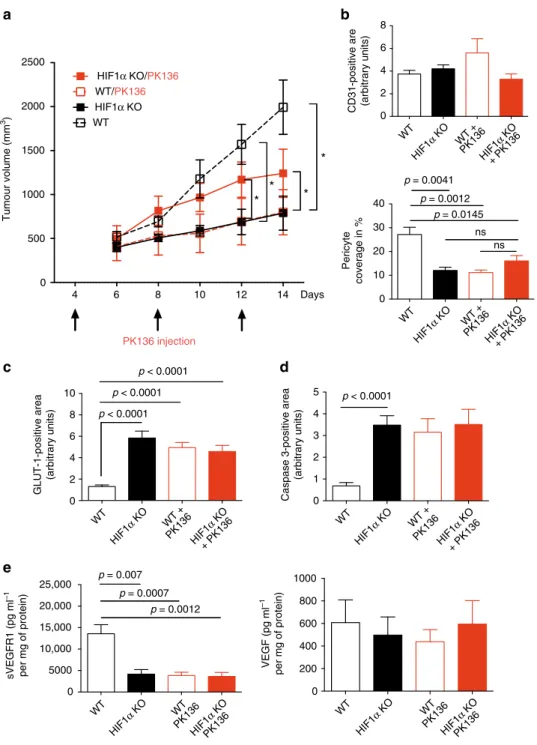
0 1 2 3 4 5 p = 0.0012 0 0 2 4 6 8 10 p < 0.0001 1000 800 600 25,000 20,000 15,000 10,000 5000 0 400 200 WT HIF1 α KO WT + PK136 HIF1 α KO + PK136 WT HIF1 α KO WT PK136 HIF1 α KO PK136 WT HIF1 α KO WT + PK136 HIF1 α KO + PK136 WT HIF1 α KO WT PK136 HIF1 α KO PK136 GLUT-1-positive area (arbitrary units)Caspase 3-positive area
(arbitrary units) p < 0.0001 p < 0.0001 p < 0.0001 VEGF (pg ml –1 per mg of protein) sVEGFR1 (pg ml –1 per mg of protein) p = 0.0007 p = 0.007 0 2 4 6 8 0 10 20 30 40 p = 0.0041 ns ns
CD31-positive are (arbitrary units)
Pericyte coverage in % p = 0.0012 p = 0.0145 WT HIF1 α KO WT + PK136 HIF1 α KO + PK136 WT HIF1 α KO WT + PK136 HIF1 α KO + PK136
b
d
c
e
0 500 1000 1500 2000 2500 WT 4 6 8 10 12 14 Days*
*
*
*
Tumour volume (mm 3) PK136 injectiona
HIF1α KO/PK136 WT/PK136 HIF1α KOFig. 5 NK cell depletion recapitulates the HIF-1α KO phenotype. a Tumour volume analysis of MC38 isografts implanted in WT and HIF-1α KO mice injected i.p. with anti-NK1.1 monoclonal antibody PK136 (4 mg per kg body weight) at day 4, 8, and 12. Control mice received i.p. injections of 100μl PBS. b Quantitative analysis of CD31-positive endothelial cells and pericyte coverage as assessed byα-SMA/CD31 co-localisation at endpoint, day 14. c Quantitative analysis of hypoxic tumour areas with the specific marker GLUT1 at endpoint, day 14. d Quantitative analysis of caspase-3-positive areas at endpoint, day 14.e Determination of levels of sVEGFR1 and VEGF protein in MC38 isografts implanted in WT and HIF-1α KO mice by ELISA at endpoint, day 14 (n = 9 for WT group; n = 5 for HIF-1α KO group; n = 8 for PK136 depleted WT group; n = 7 for PK136 depleted HIF-1α KO group). Statistical significance was determined by an unpaired Student’s t-test or one-way analysis of variance, where appropriate. Bars represent mean values; error bars indicate the s.e.m. Statistical significance is indicated as *P < 0.05, **P < 0.01, and ***P < 0.001
NK cell depletion recapitulates the HIF-1α KO phenotype. To
study the extent of the impact of NK cells for tumour
angio-genesis we depleted NK cells in MC38 tumour-bearing WT and
HIF-1α KO mice
21,25(Supplementary Fig.
5
a) on day 4, 8, and 12
(Fig.
5
a). This schedule allows to avoid interference with early
tumour rejection events and to achieve NK depletion in
estab-lished, macroscopic tumours where vascular changes increasingly
impact on growth kinetics (Figs.
2
a,
5
a). NK cell depletion in
tumour-bearing WT mice resulted in significantly reduced
tumour volumes (Fig.
5
a), along with pericyte loss (Fig.
5
b),
increases in tumour hypoxia (Fig.
5
c) and cell death (Fig.
5
d), but
failed to impact on other immune cell subsets (Supplementary
Fig.
5
b). These changes in NK cell-depleted WT tumours,
remi-niscent of non-functional angiogenesis, were associated with a
drop in sVEGFR1 levels, whereas VEGF levels remained
unchanged (Fig.
5
e).
In contrast, NK cell depletion in tumour-bearing HIF-1α KO
mice led to a discrete rescue of tumour growth, without impact on
the vascular phenotype (Fig.
5
b), tumour hypoxia (Fig.
5
c), or
tumour cell death (Fig.
5
d). NK cell depletion was associated with
0 5 10 15 20 ns 8 11 13 15 18 0 1000 2000 3000 4000
*
**
**
0 2 4 6 ns 0 10 20 30 40 50 0 5 10 15 20 25 0 0 3 6 9 12 WT WT S100b - blood (day 14) ns ns 0 1000 2000 3000 4000 ns 5000 10,000 15,000 20,000 0 1 2 3 4 5 nsCD31-positive area (arbitrary units)
Caspase 3-positive area (arbitrary units)
Pericyte coverage in % GLUT1-positive area
(arbitrary units)
sVEGFR1 (pg ml
–1
per mg of protein) VEGF (pg ml
–1 per mg of protein) Relatif expression to18S 0 1×10⁻¹⁰ 2×10⁻¹⁰ 3×10⁻¹⁰ 4×10⁻¹⁰ 5×10⁻¹⁰ Relatif expression to18S 0.0 2.0×10⁻⁶ 1.5×10⁻⁶ 1.0×10⁻⁶ 5.0×10⁻⁷ S100b - lung HIF1α KO
WT HIF1α KO WT HIF1α KO WT HIF1α KO
WT HIF1α KO WT HIF1α KO WT HIF1α KO WT HIF1α KO WT HIF1α KO HIF1α KO p = 0.006 p = 0.001 p = 0.0032 p = 0.0203 Metastatic foci Metastatic area (%) Tumour volume (mm 3) Days WT HIF1α KO
***
a
b
c
d
e
f
g
h
Fig. 6 NK cell HIF-1α deficiency facilitates tumour cell intravasation and pulmonary metastasis. a The quantification of the metastatic foci and metastatic area in LLC tumour-bearing mice determined by H&E staining on 10μm lung paraffin serial sections at day 14 post tumour injection. b Tumour volume analysis of B16F10 melanoma isografts implanted in WT and HIF-1α KO mice. c Quantitative analysis of CD31-positive endothelial cells and pericyte coverage as assessed byα-SMA/CD31 co-localisation at endpoint, day 14. d Quantitative analysis of hypoxic tumour areas with the specific marker GLUT1 at endpoint, day 14.e Quantitative analysis of caspase-3-positive areas at endpoint, day 14. f Determination of levels of sVEGFR1 and VEGF protein in B16F10 melanoma isografts implanted in WT and HIF-1α KO mice by ELISA at endpoint, day 18. g Gene expression analysis of the melanoma-specific geneS100B in peripheral blood (day 14 post tumour inoculation) and h lungs from melanoma-bearing animals (at endpoint, day 18 post tumour inoculation) (n = 10 for WT group; n = 6 for HIF-1α KO group). Statistical significance was determined by an unpaired Student’s t-test or one-way analysis of variance, where appropriate. Bars represent mean values; error bars indicate the s.e.m. Statistical significance is indicated as *P < 0.05, **P < 0.01, and ***P < 0.001
an increase in CD8 T cell numbers and a decrease in F4/80
macrophages (Supplementary Fig.
5
b), but these changes are
unlikely to explain increased tumour volumes in NK cell-depleted
HIF-1α KO mice (Fig.
5
a).
These results show that NK cell depletion in established MC38
carcinomas largely phenocopies the vascular changes induced by
NK cell-specific HIF-1α loss. This further suggests that NK cells
can slow down angiogenesis in a sVEGFR1-dependent manner,
a
b
WT WT 0 500 1000 1500 2000 p = 0.007c
d
e
f
g
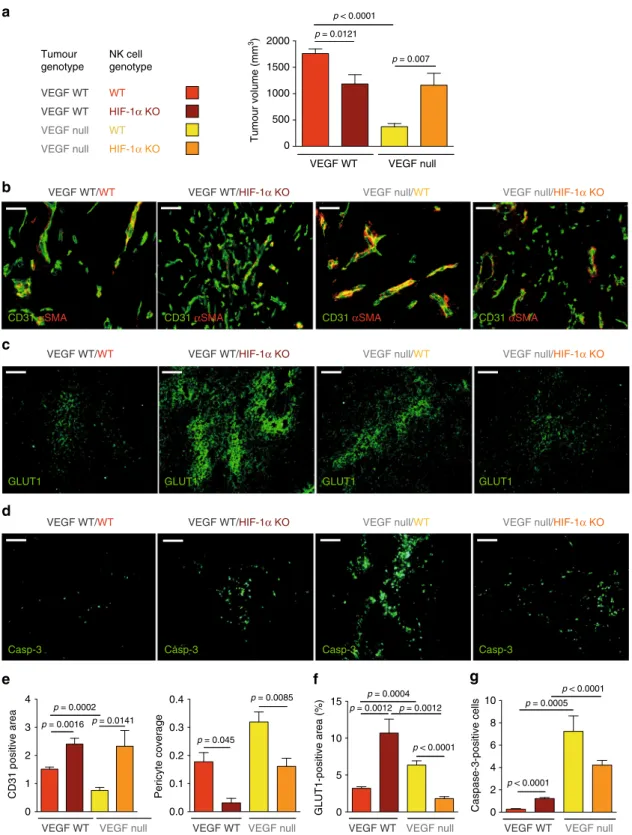
0 1 2 3 4 p = 0.045 0 5 10 15 0 2 4 6 8 10 p < 0.0001 Tumour genotype NK cell genotype Tumour volume (mm 3) VEGF null VEGF WT p < 0.0001 p = 0.0121 VEGF WT VEGF WT VEGF nullVEGF null HIF-1α KO HIF-1α KO
VEGF WT/WT VEGF WT/HIF-1α KO VEGF null/WT
VEGF WT/HIF-1α KO VEGF WT/WT VEGF null/HIF-1α KO VEGF null/HIF-1α KO VEGF null/HIF-1α KO VEGF null/WT VEGF WT/HIF-1α KO VEGF null/WT VEGF WT/WT
CD31 positive area Pericyte coverage
GLUT1-positive area (%) 0.4 0.3 0.2 0.1 0.0 Caspase-3-positive cells VEGF null
VEGF WT VEGF WT VEGF null VEGF WT VEGF null VEGF WT VEGF null
p < 0.0001 p = 0.0005 p = 0.0004 p = 0.0012 p = 0.0012 p = 0.0085 p = 0.0141 p = 0.0016 p = 0.0002 p < 0.0001
Casp-3 Casp-3 Casp-3 Casp-3
CD31 αSMA CD31 αSMA CD31 αSMA CD31 αSMA
GLUT1 GLUT1
GLUT1 GLUT1
Fig. 7 Deletion of HIF-1α in NK cells rescues the growth of VEGF-deficient tumours. a Tumour volume analysis of VEGF WT and VEGF null fibrosarcoma isografts implanted in WT and HIF-1α KO mice at endpoint, day 10. b Representative images of CD31/α-SMA immunostaining on fibrosarcoma isografts. c Representative images of hypoxic areas (GLUT1) infibrosarcoma isografts. d Detection of apoptotic cells in fibrosarcomas by caspase-3 staining. e Quantitative analysis of CD31-positive endothelial cells and pericyte coverage as assessed byα-SMA/CD31 co-localisation in fibrosacromas at endpoint, day 10.f Quantitative analysis of hypoxic tumour areas at endpoint, day 10. g Quantitative analysis of caspase-3-positive areas at endpoint, day 10 (n = 7 for each group). Statistical significance was determined by an unpaired Student’s t-test or one-way analysis of variance, where appropriate. Bars represent mean values; error bars indicate the s.e.m. Statistical significance is indicated as *P < 0.05, **P < 0.01, and ***P < 0.001. Scale bar, 100 μm
particularly in tumours that are hardly susceptible to NK
cell-mediated killing.
NK cell HIF-1α deficiency facilitates metastasis. Vascular
integrity is crucial to prevent metastatic spread
3,4. We reasoned
that the immature tumour blood vessel phenotype in HIF-1α KO
mice may enhance tumour cell intravasation and metastatic
spread. To test this idea, we analysed the lungs from WT and
HIF-1α KO mice with subcutaneous LLC isografts for the
pul-monary metastasis
26. As shown in Fig.
6
a, the number metastic
nodules in the lungs of LLC-bearing animals was similar across
genotypes, despite a pronounced reduction in the size of primary
tumours from HIF-1α KO mice (Supplementary Fig.
2
b). This
indicates that loss of HIF1α in NK cells increases the metastatic
index, which defines the relation between metastatic burden
relative to tumour volume.
To further substantiate this
finding, we applied an additional
model of subcutaneous melanoma formation that gives rise to
pulmonary metastasis
26. Again, subcutaneous B16F10
melano-mas in HIF-1α KO mice had significantly lower tumour volumes
at day 18 (Fig.
6
b), without genotype-specific differences in
infiltration of immune cell subsets or NK cell activation
(Supplementary Fig.
6
a). This once more indicates that impaired
tumour growth in HIF-1α KO mice does not primarily rely on
NK cell cytotoxicity. Consistent with our results, loss of HIF-1α in
NK cells resulted in a decrease of pericyte coverage (Fig.
6
c),
along with increased hypoxia (Fig.
6
d) and tumour cell death
(Fig.
6
e). Again, we found a decrease in angiostatic sVEGFR1
levels in tumours from HIF-1α KO mice, whereas VEGF
expression was similar across genotypes (Fig.
6
f).
To determine the degree of melanoma cell intravasation and
circulating melanoma cells as well as pulmonary metastasis, we
first analysed the expression of the melanoma-specific gene S100B
in peripheral blood (day 14 post tumour inoculation) and lungs
from melanoma-bearing animals
26(at endpoint, day 18 post
tumour inoculation). Despite the differences in tumour size at day
14 (Fig.
6
b), the expression of S100B in blood samples from
HIF-1α KO, indicative of the number of circulating melanoma cells
was found elevated comparable to WT mice (Fig.
6
g). In line, at
endpoint (day 18) the expression of S100B in lungs from
melanoma-bearing animals was similar across genotypes (Fig.
6
h)
despite pronounced differences in the primary tumour size
(Fig.
6
b). This verifies that HIF-1α deficiency in NK cells
enhances the metastatic index.
NK cell HIF-1α depletion promotes the VEGF null tumour
growth. Next, we sought to determine the impact of the
HIF-1α-sVEGFR1-axis in NK cells on angiogenesis and growth of
tumours with different levels of VEGF bioavilability. To this end,
we injected isogenic VEGF-deficient fibrosarcoma cells (VEGF
null)
6, representing a model with low VEGF bioavailability
(Supplementary Fig.
7
a) within the tumour and the matching
VEGF-expressing WT
fibrosarcomas
6(high VEGF
bioavail-ability) (Supplementary Fig.
7
a) subcutaneously into WT and
HIF-1α KO mice (Fig.
7
a). Again, tumours that expressed VEGF
grew significantly smaller in HIF-1α KO mice (Fig.
7
a) showed
lower levels of sVEGFR1 (Supplementary Fig.
7
a) and enhanced
VEGFR2 signalling (Supplementary Fig.
7
b), resulting in
non-productive angiogenesis, characterised by pericyte loss (Fig.
7
b, e),
increased hypoxia (Fig.
7
c, f) and tumour cell death (Fig.
7
d, g).
Consistent with previous
findings, fibrosarcomas lacking VEGF
expression
6,27(Supplementary Fig.
7
a) grew more slowly than
those expressing VEGF when implanted into WT mice (Fig.
7
a),
due to insufficient angiogenesis (Fig.
7
b, e), severe hypoxia
(Fig.
7
c, f), and apoptosis (Fig.
7
d, g). Strikingly, however,
deletion of HIF-1α in NK cells and a reduction in sVEGFR1 levels
(Supplementary Fig.
7
a) in VEGF null tumours rescued
VEGFR2 signalling (Supplementary Fig.
7
b) and tumour growth
(Fig.
7
a) along with restored angiogenesis (Fig.
7
e) and alleviated
hypoxia (Fig.
7
f). This demonstrates a unique and unexpected
role for HIF-1α in NK cells in the regulation of VEGF
bioavail-ability in the tumour microenvironment and the coupling of
vascular remodelling and tumour growth (summarised in
Sup-plementary Fig.
8
).
Discussion
Like other tumour infiltrating immune cell subsets, NK cells have
been shown to contribute to tumour angiogenesis by deleting
individual angiogenic factors in response to various stimuli
21.
However, NK cell responses during adaptation to hypoxia, a
condition that NK cells face in the tumour microenvironment,
had not been addressed. By dissecting this aspect experimentally,
we show that deletion of HIF-1α results in NK cell hyporeactivity
upon stimulation in both, normoxia and hypoxia. Although the
precise role of HIF transcription factors in NK cell function has
previously not been investigated, earlier reports on the impact of
hypoxia on NK cell function are inconclusive. Sarkar et al.
20demonstrated that hypoxia (0–1% O2
for 14–16 h) impaired
cytotoxic action of human NK cells that can be rescued by IL-2
stimulation, whereas Velásquez et al.
28report a synergistic effect
of short-term hypoxia (1% O2
for 28 h) with IL-15 (for the last
6 h)-induced NK cell activation. This highlights the importance of
particular experimental conditions, e.g., degree and duration of
hypoxic incubation, as well the nature of stimulatory signal, e.g.,
target cell type and addition of co-stimulatory cytokines. In line
with this, we observe modest hypoxic suppression (2% O2
for 6 h)
of NK cell degranulation but not IFN-γ release upon exposure to
YAC-1 target cells that cannot be rescued by IL-2 or IL-15
(Fig.
1
b). In contrast, hypoxia had no effect on NK cell
degra-nulation or IFN-γ release upon stimulation with V-abl target
cells.
Furthermore, we demonstrate that NK cells are a critical source
of sVEGFR1, thereby negatively regulating VEGF bioavailability
in the tumour microenvironment (graphical summary in
Sup-plementary Fig.
8
). Flow-sorted, tumour-associated NK cells from
HIF-1α KO mice did not show a reduction of sVEGFR1
expression. It has been shown in other cell types that sVEGFR1 is
co-regulated by HIF-1α and HIF-2α
4. Therefore, in
tumour-infiltrating NK cells, 2α may compensate for the loss of
HIF-1α during long-term exposure to hypoxia in the
microenviron-ment. Noteworthy, the level of sVEGFR1 expression at the
mRNA level in tumour-derived NK cells was as high as in
tumour-sorted endothelial cells, a previously identified critical
source of sVEGFR1 in hypoxic tumours
4. Moreover, sVEGFR1
expression in NK cells was even higher than in endothelial cells
when measured at the protein level by
flow cytometry (Fig.
3
f).
These results identify NK cells as an important source of
sVEGFR1 in tumours and potentially also other tissues. Given the
defect in NK cell infiltration in HIF-1α KO mice, reduced
sVEGFR1 levels in tumours from HIF-1α KO mice are most likely
a result of a lower number of sVEGFR1-expressing NK cells
(Supplementary Fig.
2
c). Moreover, we show that HIF-1α KO NK
cells are less present in hypoxic zones (Supplementary Fig.
2
d),
suggesting a failure to infiltrate or survive particularly in hypoxic
tumours. Therefore, differential, HIF-1α-dependent NK cell
positioning within hypoxic vs. normoxic tumour regions may
contribute to the lack of NK cell-derived sVEGFR1 in hypoxic
areas and subsequent non-productive angiogenesis. Interestingly,
it has been shown that NK cells, rather than promote, can inhibit
tumour angiogenesis upon stimulation with IL-12 in an
IFN-γ-dependent manner
29. We observe indeed reduced IFN-γ levels in
HIF-1α-deficient NK cells after IL-12/18 stimulation. Therefore,
low expression of angiostatic IFN-γ by NK cells in the absence of
HIF-1α could contribute to non-productive angiogenesis.
More-over, in vivo reconstitution of MC38 tumours in HIF-1α KO mice
with sVEGFR1 rescued the vascular phenotype and tumour
growth (Fig.
4
), whereas NK cell depletion of established tumours
reduced sVEGFR1 levels, which led to non-productive
angio-genesis and a decrease in tumour size (Fig.
5
). This further
sub-stantiates the role of NK cell-derived sVEGFR1 for
fine-tuning
the process of vascular remodelling. In this context, it is
impor-tant to mention that the vast majority NK cell depletion studies
apply a protocol where NK cell depletion precedes the onset of
NK cell-susceptible tumours in order to study early tumour cell
rejection events; a protocol that usually results in increased
tumour incidence/growth
30,31. We applied a different protocol
and achieved NK depletion in established, macroscopic tumours
(4 days after inoculation of 1 × 10
7“less-susceptible” MC38 cells),
where vascular changes increasingly impact on growth kinetics
(Figs.
2
a,
5
a) to avoid interference with early tumour rejection
events. In this setting, NK cell depletion in WT mice led to
non-productive angiogenesis and a decrease in intratumoural
sVEGFR1 levels along with reduced tumour growth (Fig.
5
).
Importantly, depletion of HIF-1α KO NK cells rescued tumour
growth without inducing changes in sVEGFR1 and vascular
morphology (Fig.
5
). This was associated with an increase in CD8
T cells and impaired macrophage recruitment (Supplementary
Fig.
5
). Yet, such alterations of the immune infiltrate are believed
to rather slow down tumour growth, and therefore are unlikely to
contribute to tumour growth promotion in NK cell-depleted
tumours from HIF-1α KO. However, we cannot exclude
addi-tional alterations in the microenvironment upon sudden removal
of HIF-1α-deficient NK cells, particularly changes in the cytokine
milieu and the functionality of other immune cell subsets, that
may promote tumour growth.
Immature tumour vessels with decreased pericyte coverage
increased permeability facilitate tumour cell intravasation and
distant metastasis
3. We observe that drastically smaller tumours
from HIF-1α KO mice give rise to a degree of circulating
mela-noma cells and pulmonary seeds that is comparable to WT
tumours (Fig.
6
). This observation supports the notion that the
immature vascular phenotype in tumours from HIF-1α KO mice
facilitates tumour cell intravasation and distant metastasis.
Moreover, the reduced cytotoxic potential in HIF-1α-deficient
NK cells could impair the interception and elimination of
intra-vasated tumour cells in the circulation, and hence facilitate
pul-monary metastasis by an additional mechanism.
NK cells are known to participate in angiogenesis and vascular
remodelling in the pregnant uterus
9. Yet, in addition to vessel
neoformation, vascular remodelling during pregnancy also involves
maturation and even pruning of blood vessels. Therefore, the
mechanism we demonstrate here could contribute to coordinated
expansion of the uterine vasculature at later stages of pregnancy.
However, during normal pregnancy the oxygen tension (pO2) in the
uterus does not decrease to levels that are found in tumours
(≤10 mm Hg)
22, suggesting that HIF-1α-dependent sVEGFR1
release by NK cell is more important in the tumour setting.
Con-sistently, female HIF-1α KO mice reproduce normally and litter sizes
are similar across genotypes (data not shown).
Given the emerging importance of adoptive NK cell transfer in
clinical routine, these novel
findings provide a rationale to
con-sider and target the hypoxic response in NK cells.
Methods
Mouse models. Experiments were conducted according to the European Commu-nity for experimental animal use guidelines (L358-86/609EEC) and were approved by
the Ethical Committee of INSERM. Targeted deletion of HIF-1α in NKp46-expressing NK cells was achieved by crossing the loxP-flanked HIF-1α allele14to the Ncr1
(NKp46) promoter-driven cre recombinase15(termed HIF-1α KO mice). To mitigate
the influence of strain variation, mice were kept in a >99% C57Bl/6J background. Adult HIF-1α KO mice did not show obvious phenotypical changes, e.g., size, body weight, susceptibility to infections; life span. To generate isografts, 1 × 10⁶V-abl
lymphoma cells, 1 × 10⁶B16F10 melanoma cells, 1 × 10⁷LLC cells or MC38 colon
carcinoma cells on a BL6 background (ATCC) were injected subcutaneously into Ncr1Cre-/HIF-1α+f/+f(WT) and Ncr1Cre + /HIF-1α+f/+fmice in a volume of 100μl
PBS. Mouse embryonicfibroblasts (MEFs) were isolated from mice both alleles of exon 3 of VEGF-Aflanked by loxP sites (VEGF+f/+fmice)6. The transgenic MEFs were immortalised by stable transfection with SV40 large T antigen and then transformed with a vector expressing oncogenic mutant H-Ras (Val-12). Subsequently, the VEGF+f/+fMEFs were infected with an adenovirus expressing Cre
recombinase to delete exon 3 of the VEGF gene6. A total of 5 × 10⁶of VEGF null or WT MEF’s were injected subcutaneously into mice in a volume of 100 μl PBS. Data are expressed as mean± SEM. Statistical significance was determined by ANOVA or unpaired t-test.
Depletion of NK cells. Randomised cohorts of the tumour-bearing WT and HIF-1α KO mice mice were injected i.p. with anti-NK1.1 monoclonal antibody PK136 (4 mg per kg body weight; kindly provided by Prof. Veronika Sexl from Vienna) at day 4, 8, and 12. Control mice received i.p. injections of 100μl PBS.
sVEGFR1 injection. Randomised cohorts of the tumour-bearing WT and HIF-1α KO mice received intratumoural injections of 250 ng of recombinant, active, carrier-free murine sVEGFR1 (R&D Systems, 7756-FL-050) reconstituted in PBS every 2 days starting on day 6 until endpoint at day 14. Control mice were injected with PBS.
sVEGFR1-expressing plasmid. Aortic arch was excised from C57BL/6J mice. Total RNA was extracted from aortic arch by using the RNeasy mini kit (Qiagen K. K, Tokyo, Japan) and reversely transcribed with SuperScript III First Strand Synthesis System (Thermo Fisher Scientific K. K., Yokohama, Japan). Murine sFlt-1 (D88690.1) was amplified by polymerase chain reaction (PCR) using KOD DNA polymerase (Toyobo, Osaka, Japan) and the primers: sense 5 ′-CCCAAGCT-TATGGTCAGCTGCTGGGACACC-3′ and antisense 5′-AAAGCGGCCGCGA-GACAACTGTTACTTTTCAAATGAGTCCT-3′. PCR products were digested with HindIII and NotI, and subcloned into pcDNA3 expression vector (Thermo Fisher Scientific K.K.).
Preparation of PEI–DNA complexes and injections. For in vivo administration, FLT1 and ctrl plasmid DNA was complexed with in vivo-jetPEI (Polyplus Transfection, Illkirch, France), according to the manufacturer’s guidelines. 15 μg of DNA per one injection was complexed with in vivo-JetPEI at an N/P ratio of 6 in 5% glucose solution for intratumoural injection. The mixture was incubated for at least 30 min at room temperature in order for the complexes to form before being injected into the mice. Randomised cohorts of the tumour-bearing WT and HIF-1α KO mice received intratumoural injections of 15μg of DNA in 100 μl of 5% glucose solution every 2 days starting on day 6 until endpoint at day 14. Control mice were injected with control plasmid.
Flow cytometry. Single-cell suspension of BM, spleen, liver, and tumour were obtained and stained. Intracellular stainings for Granzyme B and IFN-γ were performed using Cytofix/Cytoperm (BD-Bioscience). Cell viability was measured using LIVE/DEAD® Fixable Aqua Dead Cell Stain Kit (Thermo Fisher). Flow cytometry was carried out on a FACS LSR II (Becton-Dickinson). Data were analysed using FlowJo (Treestar). The following mAbs from eBioscience or BD-Biosciences or BioLegend were used: anti-CD19 (1D3; 562291), anti-CD3 (145-2C11; 562286), anti-CD4 (GK1.5; BLE100408), anti-CD8 (53-6.7; BLE100723), anti-F4/80 (BM8; BLE123118), anti-CD11c (N418; BLE117310), anti-MHC II (M5/ 114.15.2; 11-5321-85), anti-NK1.1 (PK136; 12-5941-82), anti NKp46 (29A1.4; 25-3351-82), CD11b (M1/70; 560455), CD27 (LG.7F9; 12-0271-81), anti-CD45 (30-F11; 45-0451-82), anti-Ly49H (3D10; 5886-82), anti-Ly49D (4e5; 13-5782-82), Ly49C/I (5E6; 557418), NKG2AB6 (16a11; 12-5897-83), anti-NKG2D (CX5; 12-5882-81), anti-KLRG1 (2F1; 561620), anti-CD43 (S7; 560663), anti-CD49a (HMα1; 142604), anti-CD49b (DX5; 47-5971-80), anti-Granzyme B (NGZB; 12-8898-82), anti-IFN-γ (XMG1; 554413), anti-CD107a (1D4B; 553793), and relevant isotype controls.
For VEGFR1 detection following antibodies were used: for visualise total VEGFR1 (anti-VEGFR1-Alexa Fluor 488; Abcam; ab195253; dilution 1/50) and for membrane-anchored VEGFR1 (rabbit anti-VEGFR1; Abcam; ab2350; dilution 1/ 50; with secondary antibody goat anti-rabbit IgG AF647; dilution 1/500). The gating strategy is depicted in Supplementary Fig.9.
Splenocyte isolation and stimulation. Splenic lymphocytes were prepared and cultured in the presence of GolgiStop (BD) without or with cytokines (rmIL-15 100 ng ml−1; rmIL-12 25 ng ml−1; rmIL-18 5 ng ml−1; rhIL-2 1000 U ml−1), or on
antibody-coated plates (anti-NK1.1 at 1-3-10μg ml−1) or with PMA (20 ng ml−1) and ionomycin (1μg ml−1) or with one of the following tumoural cell lines MC38, LLC, or v-ABL (400,000 cells per well) for 6 h at 37 °C in hypoxia/normoxia culturing conditions in the presence of anti-CD107a (1D4B; 560648). Surface and intracellular stainings for granzyme B (NGZB; 12-8898-82) and IFN-γ (XMG1; 554413) were performed using Cytofix/Cytoperm (BD-Bioscience). Cell viability was measured using LIVE/DEAD®Fixable Aqua Dead Cell Stain Kit (Thermo Fisher).
NK cell purification. NK cells were purified using NK Cell Isolation Kit II (Mil-tenyi) an LS Column (Mil(Mil-tenyi), and a MidiMACS™ Separator (Mil(Mil-tenyi). In vitro cytotoxicity assays. In vitro cytotoxicity assays were performed with purified, splenic, naive NK cells and the MC38, LLC and V-abl tumour cell lines. Target cells were washed and labelled with CFSE (Sigma-Aldrich). Following the washing steps, NK cells were co-cultured with target cells at E:T ratios of 1:1 and 10:1 for 6 h at 37 °C and 5% CO2in RPMI 1640 medium (Invitrogen)
supple-mented with 10% fetal bovine serum (FBS), 50 U/ml penicillin-streptomycin (Lonza) in normoxia (20% of O2) and hypoxia (2% of O2). Culture of target cells
alone was used as a negative control. Each experimental condition was performed in three replicates. Then cells were washed with PBS containing 0.5% BSA (Miltenyi Biotec) and labelled with a Live/Dead Fixable Aqua Dead Cell Stain Kit (Invitrogen), according to the manufacturer’s protocol before data acquisition on a BD LSRIIflow cytometer (BD Biosciences, PARCC, Paris). The data were analysed using FlowJo (Treestar). The target cells were identified as CFSE+, and effector cells were identified as CFSE−. The dead target cells were identified as CFSE+Live/Dead+. Spontaneous death was defined as the proportion of dead target cells cultured alone (negative control), and this value was subtracted from the proportion of dead target cells cocultured with effector cells. Each cytotoxicity assay was repeated in at least three independent experiments.
In vivofluorescence imaging of angiogenesis and hypoxia. Fluorescence acquisition were performed using the planar optical camera PhotonImager RT (Biospace Lab, France). Mice were narcotised with isoflurane (2–3% isoflurane, 0.5 l per minute air) and injected intravenously with 10 nmol of AngioStamp®700 (50μmol L−1in PBS; Fluoptics, France) or with 2 nmol of HypoxiSense 680
(20µmol L−1in PBS; Perkin Elmer, USA) for imaging angiogenesis (expression of αvβ integrin, overexpressed in neovessel endothelial cells during angiogenesis) or hypoxia (expression of carbonic anhydrase 9 protein, which increases in hypoxic regions within tumours), respectively. Images were acquired before and 5 min, 1, 2, 4, 6, 12, 24, 48 post tracer injection. Filters were set as following: excitation filter: 650 nm, emission filter: 575 nm, background filter: 575 nm. Images analyses was performed using the software M3Vision (Biospace Lab, France). Grayscale photographic images andfluorescence colour images were superimposed. Regions of interest were drawn over each tumour to determine the signal intensity. Histology, immunohistochemistry, and immunofluorescence. After removal, tumours and lungs werefixed in 4% paraformaldehyde and then embedded in paraffin. 7 μm sections were deparaffinised with xylene and rehydrated with graded ethanol. The sections were stained according to routine immunohistochemistry procedures and visualised by Vectastain ABC or ABC-AP kit (Vector Laboratories, Burlingame, CA). Alternatively, samples were frozen in OCT andfixed in acetone/ methanol before standard immunofluorescence procedures.
Primary antibodies used for immmunohistochemistry and
immunofluorescence: Rat anti-CD31 at 1:200 dilution (BD Pharmingen; 550274), rat anti-CD31 (DIANOVA; DIA-310), biotinylated mouse anti-SMA-alpha at 1:200 (Thermo Scientific; 14-9760-82), rat anti-NKp46 (BioLegend; 137606), rabbit anti-GLUT-1 (Abcam; ab652) at 1:500, rabbit anti-cleaved caspase-3 (Cell Signalling; 9661) at 1:500. Thefluorochrome-conjugated Alexa 488 (A11070; A11006; A11017) and Alexa 568 (A11077; A11031) were used as secondary antibodies (1:200).
Lung metastases in the LLC model was analysed by Haematoxylin and Eosin (H&E) staining on 10μm lung paraffin serial sections at day 14 post tumour injection26.
Quantitative analysis of histologic markers. For quantitative analysis of the distribution of immunohistochemical markers within the tumour, the midline sections of tumours were photographed into TIFF images using a ZEISS Axioskope 2 plus microscope and ZEISS Axiocam camera system and the area (number of pixels) with positive staining equal to or greater than a set threshold was measured using the ImageJ programme and such marked areas were normalised by the number of images for each tumour. To determine vessel density, the vasculature marked by CD31 was skeletonised using the ImageJ programme and the area covered by blood vessels was determined. To determine pericyte coverage of blood vessels, CD31/α-SMA colocalisation was quantified.
Immunoprecipitation and immunoblotting. Tumours were lysed in RIPA buffer and 500μg of lysate were used for immunoprecipitation of VEGFR2. The following
antibodies were used in this study: rabbit anti-VEGFR2 (55B11, Cell Signalling; 2479), HRP-conjugated anti-phosphotyrosine (4G10®, Millipore; 16-105), goat anti-Albumin (Abcam; ab19194), and HRP-conjugated mouse anti-β-actin (Santa Cruz; sc-47778). For a quantitative analysis the membranes were scanned with a fluorescence scanner and the signal strength was determined by using Image-Quant®software. Full-size images are presented in Supplementary Fig.10. ELISA. Concentrations of VEGF-A and sVEGFR1 in tumours and aliquots of supernatants were determined using commercial kits (Quantikine ELISA Immunoassay, R&D Systems) and expressed in pg ml−1per mg of whole tissue protein.
Gene expression by quantitative PCR. General procedure: Cells were lysed and tissue samples were homogenised in RLT buffer (Quiagen). Total RNA was isolated with Quiagen RNA extraction kits following the manufacturer’s instructions. For real-time PCR analysis, the isolated RNA was reverse transcribed (Eurogentec). For PCR reactions, TaqMan Mastermix (Eurogentec) was used. 50 ng cDNA was used as template to determine the relative amount of mRNA by real-time PCR (BioRad Detection System). PCR conditions were as follows: 95 °C for 10 min followed by 40 cycles of 95 °C for 15 s and 60 °C for 1 min. Data were normalised to 16S mRNA levels. The following primers were used: 16s forward primer: 5 ′-AGATGATC-GAGCCGCGC-3′, reverse primer: 5′-GCTACCAGGGCCTTTGAGATGGA-3′; VEGF-A forward primer: ATCCGCATGATCTGCATGG-3′, reverse primer: 5′-ATCCGCATGATCTGCATGG-3′; soluble VEGFR1 forward primer: 5′-GTCA-CAGATGTGCCGAATGG-3′, reverse primer: 5′-TGACTTTGTGTGGTA-CAATC-3′; PDGF-beta forward primer: 5′-CATCCGCTCCTTTGATGATCTT-3′, reverse primer: 5′-ATGAGCTTTCCAACTCGACTCC-3′; FGF-2 forward primer: 5′-GGCTTCTTCCTGCGCATCCA-3′, reverse primer: 5′-GCTCTTAGCAGA-CATTGGAAGA-3′; PlGF forward primer: 5′-TGCTGGTCATGAAGCTGTTC-3′, reverse primer: 5′-GGACACAGGACGGACTGAAT-3′; Angiopoietin-1 forward primer: 5′-GATCTTACACGGTGCCGATT-3′, reverse primer: 5′-TTAGATTG GAAGGGCCACAG-3′; Angiopoietin-2 forward primer: 5′-TCCAAGAGCTCG GTTGCTAT-3′, reverse primer: 5′-AGTTGGGGAAGGTCAGTGTG-3′; FLT-1 (extracellular domain): forward primer: 5 ′-CATTGTAAACGTGAAACCTCA-GATCT-3′, reverse primer: 5′-CTGCTGCCCAGCGGATAG-3′; FLT-1 (intracel-lular domain): forward primer: 5′-GGGAAAGGAGTCCTGCTGTTCT-3′, reverse primer: 5′-GAGCGGAATAGGTGTAAACTCATAGAT-3′.
The expression of the melanocyte specific gene S100b was measured as readout of lung colonisation by qRT-PCR following reverse transcription to cDNA with the QuantiTect Reverse Transcription kit and custom made primers for S100b and 18S (Qiagen).
Gene expression analysis on purified NK cells and endothelial cells from tumours and spleens: 4500 NK cells and endothelial cells were directly lysed and analysed according to the CellsDirect™ protocol (CellsDirect™ One-Step qRT-PCR Kits, Invitrogen). A low abundance targets, sFLT1 and total FLT1, were detected using a TaqMan®probe. The following TaqMan®probes were used: FLT-1 (extracellular domain): 5′-FAM-CCGTGTCCTCGCTTCCAAGCCC-TAMRA-3′; FLT-1 (intracellular domain): probe 5′-FAM-ACCCCCAGACTACAACTCC GTGGTGT-TAMRA-3′. Data were normalised to 18S (commercial Taqman probe: Mm03928990_g1).
Cell culture. Cell lines (LLC; MC38, colon carcinoma; YAC-1, Mus musculus lymphoma; B16F10, Mus musculus skin melanoma) were obtained from ATCC and V-abl cell line kindly provided by Prof. Veronika Sexl from Vienna. Tumour cells were cultured in Dulbecco’s Modified Eagle’s Medium (DMEM High Glu-cose), supplemented with 10% FBS, 2 mM glutamine, 50 U ml−1penicillin and 100 μg ml−1streptomycin at 37 °C in a humidified atmosphere of 5% CO
2in air and
were checked for Mycoplasma contamination. YAC-1, splenocytes, and isolated NK cells were maintained in RPMI supplemented with 10% FBS. Murine endo-thelial cells were grown in endoendo-thelial cell growth medium (Lonza).
Statistical analysis. Statistical analysis was performed with the Prism 6.0 software (GraphPad Software). Statistical significance was determined by an unpaired Stu-dent’s t-test or one-way analysis of variance, where appropriate. Statistical sig-nificance is indicated as *P < 0.05, **P < 0.01, ***P < 0.001, and ****P < 0.0001. Data availability. The data that support thefindings of this study are available from the corresponding author upon request.