HAL Id: hal-02899651
https://hal.archives-ouvertes.fr/hal-02899651
Submitted on 16 Sep 2020
HAL is a multi-disciplinary open access
archive for the deposit and dissemination of
sci-entific research documents, whether they are
pub-lished or not. The documents may come from
teaching and research institutions in France or
abroad, or from public or private research centers.
L’archive ouverte pluridisciplinaire HAL, est
destinée au dépôt et à la diffusion de documents
scientifiques de niveau recherche, publiés ou non,
émanant des établissements d’enseignement et de
recherche français ou étrangers, des laboratoires
publics ou privés.
Distributed under a Creative Commons Attribution| 4.0 International License
Benchmark estimates for aboveground litterfall data
derived from ecosystem models
Shihua Li, Wenping Yuan, Philippe Ciais, Nicolas Viovy, Akihiko Ito, Bingrui
Jia, Dan Zhu
To cite this version:
Shihua Li, Wenping Yuan, Philippe Ciais, Nicolas Viovy, Akihiko Ito, et al.. Benchmark estimates
for aboveground litterfall data derived from ecosystem models. Environmental Research Letters, IOP
Publishing, 2019, 14 (8), pp.084020. �10.1088/1748-9326/ab2ee4�. �hal-02899651�
LETTER • OPEN ACCESS
Benchmark estimates for aboveground litterfall data derived from
ecosystem models
To cite this article: Shihua Li et al 2019 Environ. Res. Lett. 14 084020
View the article online for updates and enhancements.
Environ. Res. Lett. 14(2019) 084020 https://doi.org/10.1088/1748-9326/ab2ee4
LETTER
Benchmark estimates for aboveground litterfall data derived from
ecosystem models
Shihua Li1,2 , Wenping Yuan1,2 , Philippe Ciais3 , Nicolas Viovy3 , Akihiko Ito4 , Bingrui Jia5and Dan Zhu3
1 School of Atmospheric Sciences, Zhuhai Key Laboratory of Dynamics Urban Climate and Ecology, Sun Yat-sen University, Zhuhai
519082, Guangdong, China
2 Southern Marine Science and Engineering Guangdong Laboratory, Zhuhai 519082, Guangdong, China
3 Laboratoire des Sciences du Climat et de l’Environnement (LSCE), CEA CNRS UVSQ, Gif-sur-Yvette 91191, France 4 National Institute for Environmental Studies, Tsukuba, Ibaraki 305-8506, Japan
5 State Key Laboratory of Vegetation and Environmental Change, Institute of Botany, Chinese Academy of Sciences, Beijing 100093,
People’s Republic of China E-mail:[email protected]
Keywords: aboveground litterfall production, leaf area index, random forest, ecosystem model Supplementary material for this article is availableonline
Abstract
Litter production is a fundamental ecosystem process, which plays an important role in regulating
terrestrial carbon and nitrogen cycles. However, there are substantial differences in the litter
production simulations among ecosystem models, and a global benchmarking evaluation to measure
the performance of these models is still lacking. In this study, we generated a global dataset of
aboveground litterfall production
(i.e. cLitter), a benchmark as the defined reference to test model
performance, by combining systematic measurements taken from a substantial number of surveys
(1079 sites) with a machine learning technique (i.e. random forest, RF). Our study demonstrated that
the RF model is an effective tool for upscaling local litterfall production observations to the global
scale. On average, the model predicted 23.15 Pg C yr
−1of aboveground litterfall production. Our
results revealed substantial differences in the aboveground litterfall production simulations among
the
five investigated ecosystem models. Compared to the reference data at the global scale, most of
models could reproduce the spatial patterns of aboveground litterfall production, but the magnitude
of simulations differed substantially from the reference data. Overall, ORCHIDEE-MICT performed
the best among the
five investigated ecosystem models.
1. Introduction
Litterfall is a particularly key process for determining the carbon and nutrient cycling of terrestrial ecosys-tems, and it controls the main respiration substrates on the forestfloor (Roig et al2005, Chen and Chen2018).
The magnitude of litterfall regulates the rate of soil respiration and soil organic carbon content indirectly (Sayer2006, Hansen et al2009, Neumann et al2018).
Moreover, litterfall maintains the soil fertility as it is the most important resource of soil organic matter and soil nutrients(Gairola et al2009). Litterfall can also regulate
the properties of the underlying surface by changing the hydraulic conductivity and albedo(Liu et al1997),
and impact the responses and feedbacks of terrestrial
ecosystems to climatic conditions(Winkler et al2010).
Therefore, litterfall is one of the key parameters in measuring, modeling and predicting terrestrial ecosys-tem dynamics(Liski et al2005).
All ecosystem models have simulated litterfall pro-duction and its spatial variability, however, to date, different models remain inconclusive regarding the magnitude of production. For example, Rotmans and Den Elzen(1993) used an empirical model to estimate
total litterfallflux (including aboveground and below-ground) on a global scale at 47.5 Pg C yr−1, which is 3.28 times the estimate of 14.5 Pg C yr−1, reported by Lonsdale(1988). These results imply that the models,
which have been well validated on parameters related to productivity(and then are in good agreements), are
OPEN ACCESS
RECEIVED 5 November 2018 REVISED 17 June 2019 ACCEPTED FOR PUBLICATION 3 July 2019 PUBLISHED 31 July 2019
Original content from this work may be used under the terms of theCreative Commons Attribution 3.0 licence.
Any further distribution of this work must maintain attribution to the author(s) and the title of the work, journal citation and DOI.
totally different in simulating litterfall production, and have not been compared against data. Therefore, these models should be evaluated over regional scales against defined references (i.e. benchmarks) that can be used to diagnose their strengths and deficiencies for future improvement. However, to our knowledge, no study has been conducted to evaluate model perfor-mance with respect to the litterfall production, and there is still very limited knowledge of the perfor-mance capabilities. Therefore, benchmark analysis is urgently needed to evaluate ecosystem models against observations as it allows us to identify uncertainties in predictions, as well as guides the priorities for model development(Luo et al2012).
The most critical component of any benchmark analysis is to define the benchmarks, which must be objective, effective, and reliable for evaluating model performance. Currently, as advanced empirical mod-els, machine learning methods have been increasingly developed for explicitly quantifying carbon cycle vari-ables regionally and globally(Jung et al2010, Xia et al
2018). Several approaches including artificial neural
networks, regression trees, support vector regression, and random forest(RF) have been widely employed to predict regional biomass and other carbon cycle vari-ables. Machine learning methods are independent of the relationships between response variables and pre-dictive variables, especially when compared with tra-ditional empirical models such as linear regression that requires a Gaussian distribution for the input variables. More importantly, the increasing observa-tions now available cover a wide range of geographic and climate regions, which is of clear value for upscal-ing site-level observations to the regional scale. In this study, we combined four global aboveground litterfall production datasets and the related environmental conditions. The primary objectives of this study were to:(1) develop the RF model for predicting above-ground litterfall production by using adequate site observations, (2) quantify the aboveground litterfall production based on the RF model, and(3) conduct a benchmarking evaluation of ecosystem models regarding to the aboveground litterfall production.
2. Data and methods
2.1. Aboveground litterfall production datasets In forest ecosystems, aboveground litter includes mainly foliage, branches, bark, and reproductive organs, and usually, foliage litterfall occupies a major fraction of total litterfall(Liu et al2003).
In this study, we used four datasets of observed aboveground litterfall production data (Zhang et al
2014, Holland et al 2014, Jia et al 2016, Neumann et al2018) and some other relevant studies were also
included(Mina1955, Remezov et al1959, Marchenko
and Karlov 1962, Rodin and Bazilevich 1967,
Goryshina 1974a 1974b, Ranawat and Vyas 1975,
Gaur and Pandey1978, Djhalilov and Safarov1981, Jakucs 1985, Breymeyer 1991, Berg et al 1993, Vedrova 1995). These observations were collected
from published studies, and have been critically reviewed and incorporated into comprehensive forest litterfall datasets. Litterfall data were measured by lit-terfall-trap experiments. Replicate measurements obtained from a series of plots or litterfall traps at a single site were averaged. In these datasets, litterfall production referred to plant material shed in one year, and was composed primarily of leaves, twigs(<2.5 cm in diameter), flowers, fruits and bark. Dead roots and
coarse woody detritus (CWD) were not included.
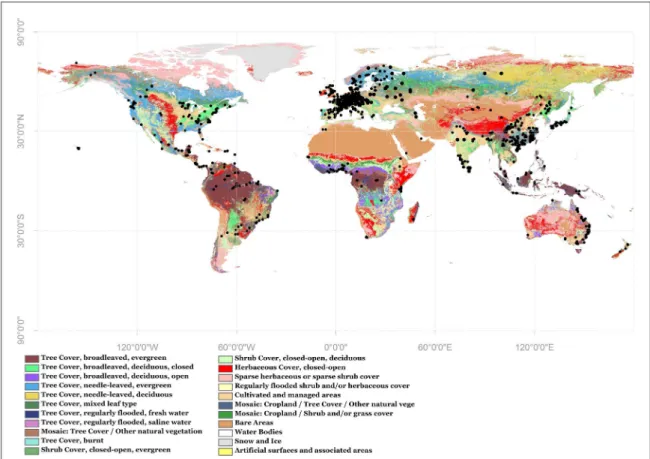
CWD include a wide variety of types and sizes of mate-rials. Generally, items larger than 2.5 cm in diameter are referred to as CWD. In total, the litterfall datasets included measurements from 1079 study sites. The observation sites dispersed across various climate zones with latitudes from−42.45 to 71.3 and long-itudes from−156.7 to 176.3, and covered different forest types(figure1). To match our observed
above-ground litterfall data, CWD were excluded from the aboveground litterfall outputs of thefive ecosystem models.
2.2. Random forest
RF is a machine learning method for classification and regression. It combines tree predictors, such that each tree depends on the values of a random vector that is sampled independently, with the same distribution for all trees in the forest. RF operates by constructing a multitude of decision trees for a given training time and outputting the class that is the mode of the classes (classification) or the mean prediction (regression) of the individual trees. The generalization error for RF con-verges to a limit as the number of trees in the forest increases. The first algorithm for random decision forests was created by Ho (1998) using the random
subspace method, which is an extension of the algorithm developed by Breiman(2001). This study constructed
the aboveground litterfall production model based on RF in R. The R package‘randomForest’ used in the study has been modified by Liaw and Wiener (2002) from the
original Fortran by Breiman and Cutler(https: //cran.r-project.org/web/packages/randomForest/).
We developed a predictive aboveground litterfall production model using RF. The explanatory variables included: mean air temperature, maximum air temp-erature, minimum air temptemp-erature, precipitation, relative humidity, wind speed, solar radiation and the normalized difference vegetation index (NDVI), by year and by the four seasons(i.e. winter, spring, sum-mer and autumn), for a total of 8 variables. The period of the time series of all these variables was from 1982 to 2013. NDVI were derived from the Global Inventory
and the rest meteorological factors were derived from the CRU-NCEP(National Centers for Environmental Prediction) v8 datasets. We used complete combina-torial method to produce the optimal combination out of the 8 variables. Full combinations of 2–8 vari-ables were examined, and totally there are combina-tions of 247 variables (1235 combinations for four seasons and one year). To select the best model, we evaluated the performance of each model based on
their root mean squared error (RMSE). For each
model, 80% of the observations were selected ran-domly for training, leaving 20% for validation, and the model was run 2000 times.
To analyze the model uncertainty of the RF model, we used different forcing datasets to produce an ensemble of RF predictions. In our RF model, mean annual temperature and NDVI were selected as pre-dictor variables of aboveground litterfall production. Thus, we used four different air temperature datasets
of CRU-NCEP(National Centers for Environmental
Prediction) v8, Climate Research Center (CRU) TS3.25, the Modern Era Retrospective-Analysis for Research and Applications, Version 2(MERRA-2) and ERA-Interim, together with NDVI of the GIMMS to force the RF model. The time period of these input data was from 1982 to 2013. Then we took the median absolute deviation(MAD) across different ensemble members as model uncertainty for the RF model (figure3(b)).
2.3. Terrestrial ecosystem models
In this study, we compared the RF withfive terrestrial ecosystem models about their predictions or estima-tions of aboveground litterfall production. These
models included: BioGeochemical Cycles
(Biome-BGC; Running and Gower 1991), Integrated
Bio-sphere Simulator(IBIS; Foley et al2005, Yuan et al
2014), Lund-Postdam-Jena ( Sitch et al2003),
ORga-nizing Carbon and Hydrology in Dynamic Ecosys-tEms-aMeliorated Interations between Carbon and
Temperature(ORCHIDEE-MICT; Guimberteau et al
2017) and Vegetation Integrated Simulator for Trace
Gases (VISIT; Ito and Oikawa 2002). While VISIT
was driven by Climate Research Unit(CRU) TS3.25 datasets(http://data.ceda.ac.uk/badc/cru/data/cru_
ts/cru_ts_3.25/), the others were forced with
CRU-NCEP(National Centers for Environmental Predic-tion) v8 datasets (https://vesg.ipsl.upmc.fr/thredds/
catalog/work/p529viov/cruncep/V8_1901_2016/
catalog.html). Both of two climate datasets are derived
from quasi-point based measurements and have the same spatial scale(0.5°). CRU-NCEP data are pro-vided every 6 h and CRU data are propro-vided monthly. CRU-NCEP data averaged on a monthly time step are equivalent with CRU data, in that CRU-NCEP data are based on CRU monthly data and NCEP data are used to simulate the 6-hourly variability of different para-meters. Consequently, it is reasonable to consider that all models including VISIT were based on the same climate forcing.
Figure 1. Distribution of sampling points for aboveground litterfall production, with land cover types indicated by color. The Global Land Cover 2000(GLC-2000; Giri et al2005) was used to identify the vegetation types.
3
This study examined the performance of the RF model and thefive ecosystem models, and the results were presented with a Taylor diagram(figure4).
Speci-fically, we used Pearson’s correlation to evaluate the relationship between the observed and simulated aboveground litterfall production. Furthermore, we used the centered pattern root mean square(RMS) dif-ference in order to isolate the difdif-ferences in models from differences in the means of the observed and simulated patterns.
In this study, we also analyzed the correlation between aboveground litterfall production of thefive ecosystem models and their leaf area index(LAI) and heterotrophic respiration(RH). The LAI and RH esti-mations were derived from the ecosystem model that used in this study respectively. RH estimations include the CO2emission from the decomposition of litterfall and soil organic carbon.
3. Results
3.1. Litterfall predictions by RF method
Based on the aboveground litterfall production observa-tions, we evaluated model performance on all possible
combinations of the explanatory variables (see
section2.2). Annual mean air temperature and annual
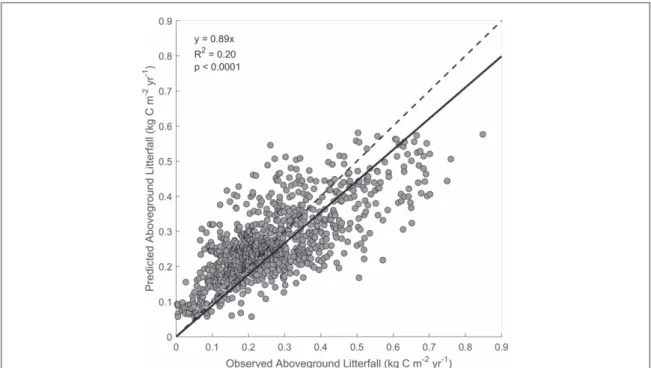
mean NDVI were found to be the best combinations for predicting litterfallflux. We then validated the model in the spatial domain using cross-validation. To analyze the performance of the RF, the average predicted litter-fall production of the same site from 20% validation datasets of each model run were calculated(figure2).
The RMSE of the aboveground litterfall production for the RF was 0.0994 kg C m−2yr−1. Based on the RF model, we generated global aboveground litterfall production from 1982 to 2013. On average, there was 23.15 Pg C yr−1 aboveground litterfall production
Figure 2. Observed and predicted aboveground litterfall production. The dashed line indicates 1:1 correspondence and the solid line is thefitted linear regression to the data.
during this period. Aboveground litterfall production was the highest in the tropical moist forest regions and lowest in cold tundra and dry desert regions (figure3(a)). Overall, the model uncertainties of
above-ground litterfall production for the RF were small and there were larger uncertainties in low latitude area (figure3(b)). As figures S2 and S3 showed, both annual
mean air temperature and annual mean NDVI(driving data for the RF) were positively correlated with cLitter predicted by the RF, implying that the two identified drivers theoretically affected the prediction of above-ground litterfall production for the RF.
3.2. Model-data comparison
Based on the observations of aboveground litterfall production, we examined the performance of the RF model and thefive ecosystem models (figure4). Here
we used Pearson’s correlation to evaluate the relation-ship between the observed and simulated above-ground litterfall production. Furthermore, we used the centered RMS difference in order to isolate the differences in models from differences in the means of the observed and simulated patterns. The centered RMS difference approaches zero as two patterns become more similar. The standard deviations of Biome-BGC was the most similar to the reference point, the distance from which to the origin indicates the standard deviation of the observed value. For the correlation coefficient and the centered RMS differ-ence, the RF’s correlation coefficient was the largest while its RMSE was the lowest, which indicates that the RF’s performance was the best when modeling
aboveground litterfall production. Overall,
ORCHI-DEE-MICT performed the best among the five
ecosystem models.
3.3. Benchmarking evaluation
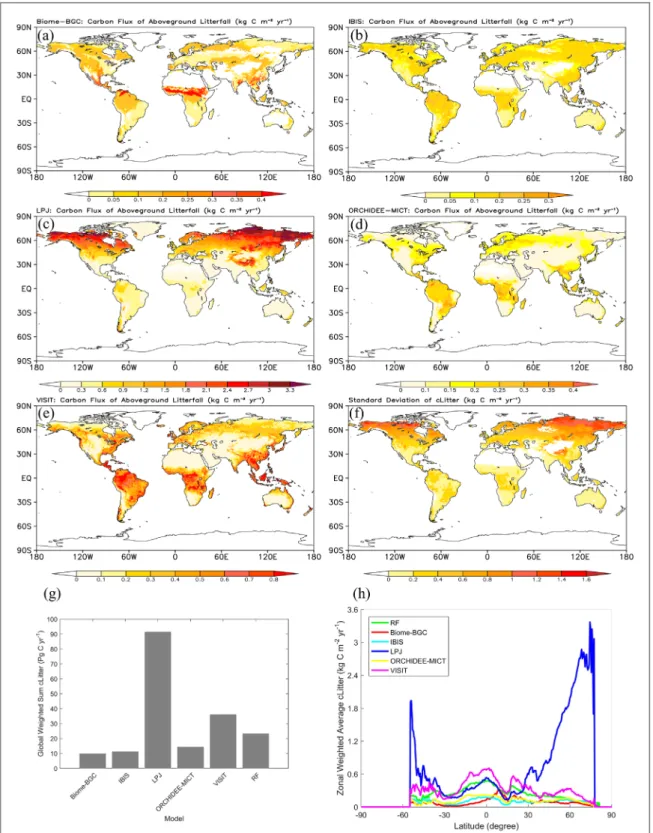
There were large differences in the simulated above-ground litterfall production among thefive investigated ecosystem models , the simulations derived by the LPJ model(91.41 Pg C yr−1) was 9 times the estimate of 9.85 Pg C yr−1, derived from the Biome-BGC model (figure 5(g)). Specifically, LPJ simulated high
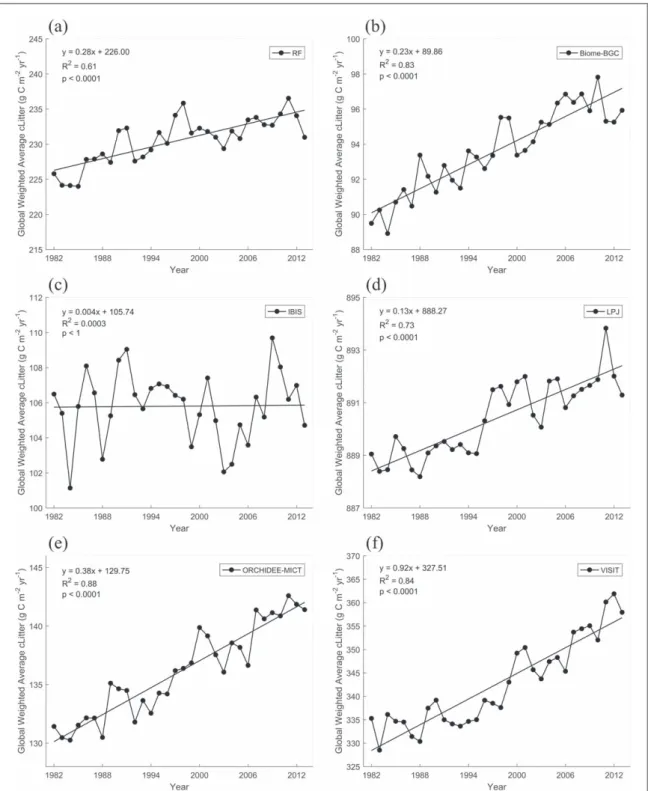
above-ground litterfall production at high latitudes. In terms of the global aboveground litterfall production trend, five of the six models (i.e. RF, Biome-BGC, LPJ, ORCHIDEE-MICT and VISIT) showed a significant cLitter increase from 1982 to 2013, with the trend ranging from 0.13 to 0.92 g C m−2yr−1(figure6). The
greatest increase of aboveground litterfall production was found in the VISIT model(figure6(f)). The IBIS
model presented relatively constant long-term changes (0.004 g C m−2yr−1, p=0.92). In general, the trend of cLitter for Biome-BGC was the nearest to the RF’s, implying that the simulations of cLitter’s time variation for Biome-BGC were the best among thefive ecosystem models.
The LPJ model simulated the extremely high leaf litterfall at high latitudes, and which probably results from two potential causes. First, LAI for LPJ is high in the latitude around 60 degrees(figure8(g)). Second,
the leaf longevity of boreal needleleaf evergreen trees for LPJ is 2 years(table S1 is available online at
stacks.iop.org/ERL/14/084020/mmedia), which is
Figure 4. Taylor diagram displaying a statistical comparison with observations of six model estimates of the global pattern of aboveground litterfall production.
5
smaller than the other models. For instance, the leaf longevity of evergreen needleleaf forest-cool climate for Biome-BGC is 4 years and the leaf longevity of bor-eal needleleaf evergreen trees for ORCHIDEE-MICT is 2.49 years(table S1). In contrast, the leaf longevity in tropical for LPJ is the longest, which makes the cLitter for high latitudes for LPJ much higher than the other models and the cLitter in tropical area extremely low.
3.4. Relationships between LAI and litterfall production
In order to explain the substantial differences of aboveground litterfall production between the five ecosystem models, we analyzed the relationship between LAI and aboveground litterfall production for these models. The LAI was derived from each ecosystem models used in this study respectively. The
Figure 5. Distribution map of global aboveground litterfall production simulated by:(a) Biome-BGC, (b) IBIS, (c) LPJ, (d) ORCHIDEE-MICT and (e) VISIT. (f) Standard deviations of aboveground litterfall production (cLitter) simulated by the five ecosystem models.(g) Global area-weighted sum cLitter and (h) Zonal area-weighted averaged cLitter predicted by the RF model and simulated by thefive ecosystem models.
simulations of LAI have strong connection with the simulations of cLitter in terrestrial carbon cycle models. We analyzed the relationship between the cLitter and LAI of the outputs for all models, their correlation coefficients are shown in figure7. Addi-tionally, the ratios of the different correlations (sig-nificant negative correlation, negative correlation, positive correlation and significant positive correla-tion) are shown in figure7. In this study, the RF model was only used to predict aboveground litterfall pro-duction. We did not use the RF model to predict LAI, so we analyzed the relationship between cLitter and its
forcing data, the GIMMS NDVI. For Biome-BGC, IBIS, ORCHIDEE-MICT and VISIT, cLitter was significantly and positively correlated with LAI in most areas. However, for RF and LPJ, the correlations were much weaker, especially for LPJ(figure7(d)).
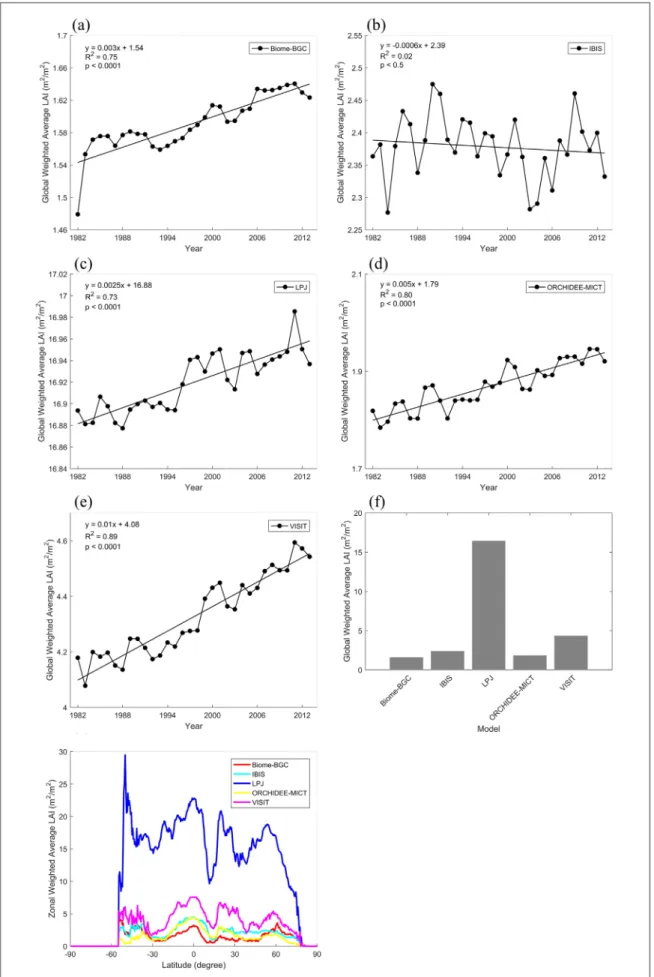
There were obvious differences in the LAI simula-tions of thefive ecosystem models (figure8(f)). The
same as with cLitter, the simulated values of LAI for LPJ were the largest, while those for Biome-BGC were the smallest. We also analyzed the LAI trend of thefive ecosystem models. Figure8illustrates that there were slight increasing trends in the LAI simulations of
Figure 6. Trends of global area-weighted averaged cLitter predicted by(a) RF, simulated by: (b) Biome-BGC, (c) IBIS, (d) LPJ, (e) ORCHIDEE-MICT and (f) VISIT from 1982 to 2013.
7
Biome-BGC, LPJ, ORCHIDEE-MICT and VISIT, with little change in the LAI simulations of IBIS, which corresponded to the cLitter trend.
4. Discussion
Our results demonstrated that in combination with other satellite-derived and climatic variables, the RF performed well for predicting litterfall production, as was confirmed by cross-validation and Taylor diagram (figures2and4). Often, the performance of the
data-driven methods are highly restricted by the quantity of training datasets (Chen et al 2014). Our current
predictions greatly benefited from the abundant observations, which covered the major geographical and climate regions.
The predicted aboveground litterfall production by the RF model showed a strong correlation with the satellite-based GIMMS NDVI(figure7(a)). Previous
studies have shown that leaf litter substantially
contributes to total litterfall, and the contribution per-centages from 64%–73% (Zhang et al2014). All five
investigated ecosystem models consistently exhibited strong relationships of simulated LAI on aboveground litterfall production(figure7), which implies that the
leaf area simulation is important for reproducing the aboveground litterfall production. However, there remain large uncertainties in predicting leaf area in the ecosystem models due to certain ecological processes involved, such as vegetation production and carbon allocation(Gower et al1999, Kucharik et al2000, Xia et al2015).
Moreover, leaf longevities and turnover rates are important plant traits that substantially determine lit-terfall production(Schleip et al2013). Existing
vegeta-tion models usually assumed inaccurate leaf longevities and turnover rates for each plant function type(PFTs) (Kucharik et al2000, Sitch et al2003). White et al (2000)
reported that the specified leaf longevities in Biome-BGC showed large discrepancies with the observed
Figure 7.(a) Distribution map of correlation coefficients between cLitter predicted by RF and the Global Inventory Modeling and Mapping Studies(GIMMS) normalized difference vegetation index (NDVI). Distribution maps of correlation coefficients between cLitter and leaf area index(LAI) simulated by: (b) Biome-BGC, (c) IBIS, (d) LPJ, (e) ORCHIDEE-MICT and (f) VISIT, where colors indicate significant negative correlations (SNCs, p<0.05), negative correlations (NCs), positive correlations (PCs), and significant positive correlations(SPCs, p<0.05).
Figure 8. Trends of global area-weighted averaged LAI simulated by:(a) Biome-BGC, (b) IBIS, (c) LPJ, (d) ORCHIDEE-MICT and (e) VISIT from 1982 to 2013.(f) Global area-weighted averaged and (g) Zonal area-weighted averaged LAI simulated by the five ecosystem models.
9
values in the United States. Similarly, Zhang et al(2016)
also indicated that there were significant differences between the observed and default leaf longevities of ecosystem models for four major evergreen PFTs. For example, the observed leaf longevity of boreal needle-leaf forest was greater than three times the default value (Zhang et al2016). The significant errors and
uncer-tainties in leaf longevities and turnover rates resulted in more than 10% of predicted errors for aboveground lit-terfall production(Zhang et al2016). There are large
differences in leaf longevities between different ecosys-tem models and observations. For example, the leaf longevity of needleleaf evergreen forest in Biome-BGC was 4 year, which was almost three times the leaf long-evity in VISIT and nearly one third of the observed values(table S1; Zhang et al 2016). Therefore, more
accurate leaf longevities are critical for simulating aboveground litterfall production.
Our results also indicated the substantial regula-tions of litterfall production on heterotrophic respira-tion. In allfive investigated ecosystem models, there were strong correlations between aboveground litterfall production and heterotrophic respiration (figure S1). Specifically, for ORCHIIDEE-MICT and VISIT, nearly 90% and 80% of the vegetated areas showed significant positive correlations between these variables (figures S1(d) and (e)). Numerous field experiments have highlighted that the aboveground litterfall production supply is a significant source of heterotrophic respiration(van Groenigen et al2014).
A meta-analysis of 100 published experimental studies found that a 100% aboveground litter addition(i.e. double litter) increased heterotrophic respiration by 26.1%(Chen and Chen2018). Additionally, increased
inputs of fresh organic matter resulting from litterfall could result in‘priming effects’. Priming is the extra decomposition of soil organic matter that occurs when microbes are stimulated by the addition of easily decomposable organic matter(Bingeman et al1953),
causing a disproportionate increase in soil CO2efflux. For example, a large-scale litter manipulation experi-ment combined with carbon isotope measureexperi-ments found that the efflux of CO2derived from soil organic carbon was significantly increased by the addition of litter(Sayer et al2011).
Our study provides a new global prediction of aboveground litterfall production and offers an opportunity to bridge the gap between sparse data and correct parameterization of future ecosystem models. Undoubtedly, ecosystem models must attempt to bet-ter characbet-terize the spatial and temporal hebet-terogeneity of ecosystem processes and pursue further validation against observations(Baldocchi et al1996, Friend et al
2007, Yuan et al 2010). To reliably simulate the
dynamics of litterfall production, the models should accurately reproduce the relevant key ecosystem processes, namely vegetation primary production, carbon allocation, and turnover rate(Bonan et al2013, Hararuk et al 2014). Based on the RF model, our
predictions will be useful as a benchmark for evaluat-ing ecosystem models.
5. Conclusions
The magnitude of litterfall production is a crucial estimate for projecting the terrestrial carbon budget. Based on a substantial number offield surveys, this study used a machine learning method(i.e. random forest, RF) to develop a data-driven model for predict-ing global aboveground litterfall production. The results show that the RF enables the adequate retrieval of the global pattern of aboveground litterfall produc-tion. The predicted global aboveground litterfall production was 23.15 Pg C yr−1. Moreover, our study revealed substantial model differences regarding the aboveground litterfall production amongfive ecosys-tem models. Compared to the reference data at the global scale, most of models could reproduce the spatial patterns of aboveground litterfall production, but the magnitude of simulations differed substan-tially from the reference data. Overall, ORCHIDEE-MICT performed the best among thefive ecosystem models. Our study thus provides an extensive and normalized model benchmark for aboveground litter-fall production, which should be useful for advancing ecosystem models and their parameterization and validation.
Acknowledgments
This study was supported by the National Key Basic Research Program of China(2018YFA0606104), the National Youth Top-Notch Talent Support Program (2015-48), the Changjiang Young Scholars Program of China(Q2016161) and the Training Project of Sun Yat-sen University(16lgjc53). P. C. and D. Z. acknowl-edge support from the European Research Council
Synergy project(SyG-2013-610028 IMBALANCE-P)
and P. C. acknowledges the support of the ANR CLAND Convergence Institute.
ORCID iDs
Shihua Li https://orcid.org/0000-0001-6796-0856
Bingrui Jia
https://orcid.org/0000-0001-9662-0738
References
Baldocchi D, Valentini R, Running S, Oechel W and Dahlman R 1996 Strategies for measuring and modelling carbon dioxide and water vapourfluxes over terrestrial ecosystems Glob. Change Biol.2 159–68
Berg B, Berg M P, Cortina J, Flower-Ellis J, Gallardo A, Johansson M-B, Lundmark J-E and Madeira M 1993 Geography of Organic Matter Production and Decay ed A Breymeyer(Warsaw: Institute of Geography and Spatial Organization, Polish Academy of Sciences)
Bingeman C W, Varner J E and Martin W P 1953 The effect of the addition of organic materials on the decomposition of an organic soil Soil Sci. Soc. Am. J.17 34–8
Breiman L 2001 Random forests Mach. Learn.45 5–32
Breymeyer A I 1991 Coniferous Forest Ecology From An International Perspective ed N Nakagoshi and F B Golley(The Hague: SPB Academic Publishing)
Bonan G B, Hartman M D, Parton W J and Wieder W R 2013 Evaluating litter decomposition in earth system models with long-term litterbag experiments: an example using the Community Land Model Version 4(CLM4) Glob. Change Biol.19 957–74
Chen X and Chen H 2018 Global effects of plant litter alterations on soil CO2to the atmosphere Glob. Change Biol.24
3462–71
Chen Y et al 2014 Comparison of satellite-based evapotranspiration models over terrestrial ecosystems in China Remote Sens. Environ.140 279–93
Djhalilov K G and Safarov I S 1981 Dynamic Properties of Forest Ecosystems ed D E Reichle(Cambridge, London, New York and Melbourne: Cambridge University Press)
Foley J A, Kucharik C J and Polzin D 2005 Integrated Biosphere Simulator Model (IBIS) Version 2.5(Oak Ridge, Tennessee: Oak Ridge National Laboratory Distributed Active Archive Center) (http://daac.ornl.gov)
Friend A D, Arneth A, Kiang N Y, Lomas M, Ogee J, R̈odenbeck C, Running S W, Santaren J D, Sitch S and Viovy N 2007 FLUXNET and modelling the global carbon cycle Glob. Change Biol.13 610–33
Gairola S, Rawal R S and Dhar U 2009 Patterns of litterfall and return of nutrients across anthropogenic disturbance gradients in three subalpine forests of west Himalaya India J. Forest Res.14 73–80
Gaur J P and Pandey H N 1978 Litter production in two tropical deciduous forest communities at Varanasi, India Oikos30 570–5
Giri C, Zhu Z and Reed B 2005 A comparative analysis of the Global Land Cover 2000 and MODIS land cover data sets Remote Sens. Environ.94 123–32
Gower S T, Kucharik C J and Norman J M 1999 Direct and indirect estimation of leaf area index, fAPAR, and net primary
production of terrestrial ecosystems Remote Sens. Environ.70 29–51
Goryshina T K 1974a Investigations of biological productivity and factors affecting it in the Les na Vorske forest-steppe oak wood Ekologija 3 5–10
Goryshina T K 1974b Biological Productivity and its Factors in the Oaks of the Forest Steppe Scientific Notes (Series of Biological Science) (Leningrad: Leningrad University Press) Guimberteau M et al 2017 ORCHIDEE-MICT(v8.4.1), a land
surface model for the high latitudes: model description and validation Geosci. Model Dev.11 121–63
Hansen K, Vesterdal L, Schmidt I K, Gundersen P, Sevel L, Basturp-Birk A, Pedersen L B and Bille-Hansen J 2009 Litterfall and nutrient return infive tree species in a common garden experiment Forest Ecol. Manag.257 2133–44
Hararuk O, Xia J and Luo Y 2014 Evaluation and improvement of a global land model against soil carbon data using a Bayesian Markov chain Monte Carlo method J. Geophys. Res. Biogeosci.
119 403–17
Ho T K 1998 The random subspace method for constructing decision forests IEEE Trans. Pattern Anal.20 832–44
Holland E A et al 2014 A Global Database of Litterfall Mass and Litter Pool Carbon and Nutrients(https://doi.org/10.3334/ ORNLDAAC/1244)
Ito A and Oikawa T 2002 A simulation model of the carbon cycle in land ecosystems(Sim-CYCLE): a description based on dry-matter production theory and plot-scale validation Ecol. Model.151 147–79
Jung M et al 2010 Recent decline in the global land
evapotranspiration trend due to limited moisture supply Nature467 951–4
Jia B, Zhou G and Xu Z 2016 Forest litterfall and its composition: a new data set of observational data from China Ecology97 1365
Jakucs P 1985 Ecology of an Oak forest in Hungary(Budapest: Akademiai Kiado)
Kucharik C J, Foley J A, Delire C, Fisher V A, Coe M T, Lenters J D, Yong-Molling C and Ramankutty N 2000 Testing the performance of a dynamic global ecosystem model: water balance, carbon balance, and vegetation structure Glob. Biogeochem. Cycles14 795–825
Liu C, Ilvesniemi H, Berg B, Kutsch W, Yang Y, Ma X and Westman C 2003 Aboveground litterfall in Eurasian forest J. Forestry Res.14 27–34
Liski J, Palosuo T, Peltoniemi M and Sievanen R 2005 Carbon and decomposition model Yasso for forest soils Ecol. Model.189 168–82
Liu S, Riekerk H and Gholz H L 1997 Leaf litterfall, leaf area index, and radiation transmittance in cypress wetlands and slash pine plantations in north-central Florida Wetlands Ecol. Manage. 4 257–71
Liaw A and Wiener M 2002 Classification and Regression by random Forest R News 2 18–22
Lonsdale W M 1988 Predicting the amount of litterfall in forests of the world Ann. Bot.61 319–24
Luo Y et al 2012 A framework for benchmarking land models Biogeosciences9 3857–74
Marchenko A I and Karlov Y M 1962 Mineral exchange in spruce forests of the Northern taiga and the forest-tundra of the Arkhangel province Pochvovedenie 7
Mina V N 1955 The nitrogen and ash element cycle in the oak woods of the forest-steppe Pochvovedenie 6 20–5
Neumann M et al 2018 Quantifying carbon and nutrient input from litterfall in European forests usingfield observations and modeling Glob. Biogeochem. Cycles32 784–98
Ranawat M P S and Vyas L N 1975 Litter production in deciduous forests of Koriyat, Udipur(South Rajasthen), India Biologia 30 41–7
Remezov N P, Bykova L N and Smirnova K M 1959 Uptake and cycle of nitrogen and ash elements in the forests of European Russia (Moscow State University)
Rodin L E and Bazilevich N I 1967 Production and Mineral Cycling in Terrestrial Vegetation(Edinburgh and London: Oliver and Boyd)
Roig S, del Río M, Cañellas I and Montero G 2005 Litter fall in Mediterranean Pinus pinaster Ait. stands under different thinning regimes Forest Ecol. Manage.206 179–90
Rotmans J and Den Elzen M G J 1993 Modelling feedback mechanisms in the carbon cycle: balancing the carbon budget Tellus B45 301–20
Running S W and Gower S T 1991 FOREST-BGC, a general model of forest ecosystem processes for regional applications: II. Dynamic carbon allocation and nitrogen budgets Tree Physiol.9 147–60
Sayer E J 2006 Using experimental manipulation to assess the roles of leaf litter in the functioning of forest ecosystems Biol. Rev.
81 1–31
Sayer E J, Heard M S, Grant H K, Marthews T R and Tanner E V J 2011 Soil carbon release enhanced by increased tropical forest litterfall Nat. Clim. Change1 304–7
Schleip I, Lattanzi F A and Schnyder H 2013 Common leaf life span of co-dominant species in a continuously grazed temperate pasture Basic Appl. Ecol.14 54–63
Sitch S et al 2003 Evaluation of ecosystem dynamics, plant geography and terrestrial carbon cycling in the LPJ dynamic vegetation model Glob. Change Biol.9 161–85
van Groenigen K J, Qi X, Osenberg C W, Luo Y and Hungate B A 2014 Faster decomposition under increased atmospheric CO2limits soil carbon storage Science344 508–9
Vedrova E F 1995 Carbon pools andfluxes of 25-year old coniferous and deciduous stands in middle Siberia Water Air Soil Pollut.
82 239–46
White M A, Thornton P E, Running S W and Nemani R R 2000 Parameterization and sensitivity analysis of the BIOME–BGC
11
terrestrial ecosystem model: net primary production controls Earth Interact.4 1–85
Winkler R, Boon S, Zimonick B and Baleshta K 2010 Assessing the effects of post-pine beetle forest litter on snow albedo Hydrol. Process.24 803–12
Xia J, Chen Y, Liang S, Liu D and Yuan W 2015 Global simulations of carbon allocation coefficients for deciduous vegetation types Tellus B67 28016
Xia J, Ma M, Liang T, Wu C, Yang Y, Zhang L, Zhang Y and Yuan W 2018 Estimates of grassland biomass and turnover time on the Tibetan Plateau Environ. Res. Lett.13 014020
Yuan W et al 2010 Global estimates of evapotranspiration and gross primary production based on MODIS and global
meteorology data Remote Sens. Environ.114 1416–31
Yuan W et al 2014 Multiyear precipitation reduction strongly decreases carbon uptake over northern China J. Geophys. Res-Biogeo.119 881–96
Zhang H C, Yuan W P, Dong W J and Liu S G 2014 Seasonal patterns of litterfall in forest ecosystem worldwide Ecol. Complexity20 240–7
Zhang H, Liu D, Dong W, Cai W and Yuan W 2016 Accurate representation of leaf longevity is important for simulating ecosystem carbon cycle Basic Appl. Ecol.17 396–407