HAL Id: inserm-01147415
https://www.hal.inserm.fr/inserm-01147415
Submitted on 30 Apr 2015
HAL is a multi-disciplinary open access archive for the deposit and dissemination of sci-entific research documents, whether they are pub-lished or not. The documents may come from teaching and research institutions in France or abroad, or from public or private research centers.
L’archive ouverte pluridisciplinaire HAL, est destinée au dépôt et à la diffusion de documents scientifiques de niveau recherche, publiés ou non, émanant des établissements d’enseignement et de recherche français ou étrangers, des laboratoires publics ou privés.
Influence of individual and combined healthy behaviours
on successful aging.
Séverine Sabia, Archana Singh-Manoux, Gareth Hagger-Johnson, Emmanuelle
Cambois, Eric Brunner, Mika Kivimaki
To cite this version:
Séverine Sabia, Archana Singh-Manoux, Gareth Hagger-Johnson, Emmanuelle Cambois, Eric Brunner, et al.. Influence of individual and combined healthy behaviours on successful aging.. CMAJ, Canadian Medical Association, 2012, 184 (18), pp.1985-92. �10.1503/cmaj.121080�. �inserm-01147415�
I
ncreases in life expectancy make remaining free of disease and in good functional health for as long as possible an important objective for the present and future genera-tions.1Most research in this domain has focusedon risk factors for single health outcomes, such as mortality, chronic diseases or functioning. However, good health at older ages is a multidi-mensional concept, having been defined vari-ously with reference to absence of disease and good functional status.2–5There is considerable
research on disability outcomes at older ages,2,6–8but less attention has been paid to
suc-cessful aging combining favourable functioning outcomes with good mental health and the absence of chronic diseases and disability.9–13
Smoking, alcohol consumption, poor diet and physical inactivity are among the top 10 leading risk factors for death and disability in intermediate- and high-income countries.14There
is increasing interest in the combined effect of these behaviours on health. Studies show that people who engage in multiple unhealthy behav-iours have a higher risk of death,15–23chronic
dis-ease24–30and poor cognitive function than people
who do not engage in as many unhealthy behav-iours.31 However, whether healthy behaviours
determine good functional status at older ages, combined with the absence of chronic diseases, remains unknown.
Our objective was to examine the extent to which individual and combined healthy behav-iours in midlife predict successful aging about 16 years later, at 60 years of age or older. We used a comprehensive definition of successful aging that included having good mental health, having good cognitive, physical and cardiorespi-ratory function, and being free of disability and chronic disease (coronary artery disease, stroke, diabetes and cancer).
Influence of individual and combined healthy behaviours
on successful aging
Séverine Sabia PhD, Archana Singh-Manoux PhD, Gareth Hagger-Johnson PhD, Emmanuelle Cambois PhD, Eric J. Brunner PhD, Mika Kivimaki PhD
Competing interests: Séverine Sabia has received grant funding from the National Institute on Aging. Archana Singh-Manoux has received grant funding from the National Institutes of Health. Gareth Hagger-Johnson is supported by grants from the National Institute on Aging, the National Institutes of Health and the National Health Service Leeds Flexibility and Sustainability fund; he has received payment for lectures from the University of Leeds and the University of Ulster; and he receives royalties from Pearson International. Mika Kivimaki receives salary support from the Medical Research Council; he has received grant funding from the National Institute on Aging; and he has received a professorial fellowship from the Economic and Social Research Council. No other competing interests were declared. This article has been peer reviewed. Correspondence to: Séverine Sabia, [email protected] CMAJ 2012. DOI:10.1503 /cmaj.121080
Research
Background: Increases in life expectancy make it important to remain healthy for as long as possi-ble. Our objective was to examine the extent to which healthy behaviours in midlife, separately and in combination, predict successful aging. Methods: We used a prospective cohort design involving 5100 men and women aged 42–63 years. Participants were free of cancer, coronary artery disease and stroke when their health behaviours were assessed in 1991–1994 as part of the Whitehall II study. We defined healthy behaviours as never smoking, moderate alcohol consumption, physical activity (≥ 2.5 h/wk mod-erate physical activity or ≥ 1 h/wk vigorous physical activity), and eating fruits and vegeta-bles daily. We defined successful aging, mea-sured over a median 16.3-year follow-up, as good cognitive, physical, respiratory and cardio-vascular functioning, in addition to the absence of disability, mental health problems and chronic disease (coronary artery disease, stroke, cancer and diabetes).
Results: At the end of follow-up, 549 partici-pants had died and 953 qualified as aging successfully. Compared with participants who engaged in no healthy behaviours, par-ticipants engaging in all 4 healthy behav-iours had 3.3 times greater odds of success-ful aging (95% confidence interval [CI] 2.1–5.1). The association with successful aging was linear, with the odds ratio (OR) per increment of healthy behaviour being 1.3 (95% CI 1.2–1.4; population-attributable risk for 1–4 v. 0 healthy behaviours 47%). When missing data were considered in the analysis, the results were similar to those of our main analysis.
Interpretation: Although individual healthy behaviours are moderately associated with successful aging, their combined impact is substantial. We did not investigate the mech-anisms underlying these associations, but we saw clear evidence of the importance of healthy behaviours for successful aging.
Abstract
Materials and methods
Study population
We used data from the Whitehall II cohort study, which was established in 1985–1988 and involv-ing 10 308 British civil servants (67% men) aged 35–55 years.32Participants gave their written
con-sent to participate in the study, and the ethics com-mittee of the University College London approved the study. The Whitehall II study design consists of a clinical examination about every 5 years: 1985– 1988, 1991–1994, 1997–1999, 2002–2004 and 2007–2009.
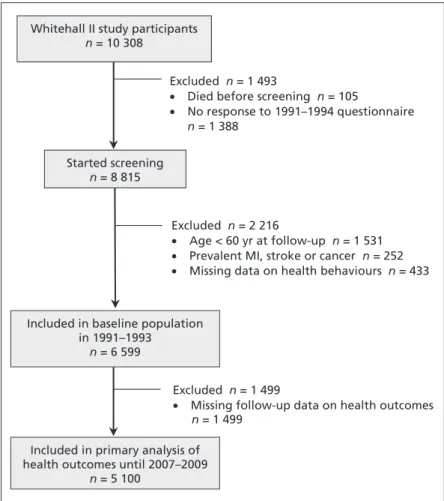
The target population of our study comprised all participants of this occupational cohort for whom data on healthy behaviours in 1991–1994 were available, and who were at least 60 years old at the end of follow-up (2008–2009), with no history of stroke, myocardial infarction or cancer in 1991–1994 (n = 6599). Our analysis included the 5100 participants for whom data on the out-come variables were available (Figure 1).
Baseline measures (1991–1994)
We assessed participants’ healthy behaviours based on their responses to a questionnaire. We categorized smoking status as “current,”
“for-mer” and “never smoked.” We assessed alcohol consumption by asking for the number of alco-holic drinks consumed in the past 7 days, and categorized consumption as “abstinence from alcohol” (no alcohol in the last week), “moderate alcohol consumption” (1–14 units/wk for women; 1–21 units/wk for men)33and “heavy
alcohol consumption” (≥ 15 units/wk for women; ≥ 21 units/wk for men). A participant’s level of physical activity was categorized as “active” (≥ 2.5 h/wk moderate physical activity or ≥ 1 h/wk vigorous physical activity) or “inac-tive” (no physical activity).31,34 We assessed
dietary behaviour by asking for the frequency with which fruits and vegetables were eaten.
We defined participants as having healthy behaviours if they met the following criteria: never smoked, moderate alcohol consump-tion,17,33physically active, and eating fruits and
vegetables daily. For further information on this categorization, see Appendices 1 and 2 (available at www .cmaj .ca /lookup /suppl /doi: 10. 1503 /cmaj .121080 / -/ DC1).
The sociodemographic variables in our analysis were age, sex, marital status and level of education (5-level variable), as described previously.35
Outcome assessment (from 1991–1994 to 2008–2009)
We assessed mortality using the national mortal-ity register kept by the National Health Services Central Registry and the National Health Service identification numbers assigned to each British citizen. Among surviving participants, we de -fined successful aging at 60 years of age or older as satisfying each of following criteria: no his-tory of cancer, coronary artery disease, stroke or diabetes; good cognitive, physical, respiratory and cardiovascular functioning, and the absence of disability; and good mental health.
We assessed chronic diseases throughout follow-up (from 1991–1994 to 2007–2009). We determined the incidence of coronary artery dis-ease using clinically verified events, including myocardial infarction and definite angina. We defined nonfatal myocardial infarction using the Monitoring Trends and Determinants of Cardio-vascular Disease (MONICA) criteria,3 6 and
determined its incidence using data from resting electrocardiographs (ECGs) taken during the Whitehall II study, hospital records of ECGs and cardiac enzyme levels. We identified definite angina using a questionnaire37and corroborated
cases with medical records or abnormal results on resting ECG, exercise ECG or coronary angiography.38 We assessed stroke using a
self-reported measure of physician diagnosis. We defined diabetes mellitus as a fasting blood
glu-Research
1986 CMAJ, December 11, 2012, 184(18)
Excluded n = 1 493
• Died before screening n = 105
• No response to 1991–1994 questionnaire
n = 1 388
Excluded n = 2 216
• Age < 60 yr at follow-up n = 1 531
• Prevalent MI, stroke or cancer n = 252
• Missing data on health behaviours n = 433
Excluded n = 1 499
• Missing follow-up data on health outcomes
n = 1 499
Included in primary analysis of health outcomes until 2007–2009
n = 5 100
Whitehall II study participants
n = 10 308
Included in baseline population in 1991–1993
n = 6 599
Started screening
n = 8 815
cose level of 7.0 mmol/L or more, a 2-hour post-load blood glucose level of 11.1 mmol/L or more, self-reported doctor-diagnosed diabetes or the use of medications for diabetes.39We
identi-fied cases of cancer using the National Health Service’s cancer register.
We assessed disability based on participants’ responses to 14 questions on perceived difficulties in basic40and instrumental activities of daily
liv-ing.41Participants with difficulties in one or more
activities were considered to have a disability. We assessed functioning during the 2007– 2009 clinical examinations using standard proto-cols (Appendix 1). We defined poor functioning as scores in the lowest sex- and age -standardized quintile (i.e., below the 20th percentile) for each measure of functioning, with the exception of blood pressure. For blood pressure, the highest quintile (i.e., above the 80th percentile) was used. We assessed cognitive functioning using a score of global cognition calculated from 5 cog-nitive tests;42we assessed physical functioning
using walking speed measured over an 8-foot-long course;43,44we assessed respiratory function
using forced expiratory volume in 1 second;44
and we assessed cardiovascular function using systolic blood pressure (an average of 2 mea-surements in a sitting position after a 5-min rest using a sphygmomanometer [OMRON HEM 907]).
We defined good mental health as a score of more than 42 points on the mental health compo-nent of the short-form general health survey45,46
included in the 2007–2009 questionnaire.
Statistical analysis
We defined 3 categories of outcome: successful aging, death during follow-up and normal aging. The normally aging group included all partici-pants who were alive at the end of follow-up, but who were not classified as aging successfully. We performed 2 separate logistic regressions: the first to estimate the odds ratios (ORs) for successful aging (with normal aging/death as the noncases), and the second to estimate the ORs for survival (with death as the noncases). To test whether the associations with healthy behaviours differed by sex, we tested statistical interactions between each behaviour and sex using the Wald test.
To estimate the contribution of healthy behav-iours to successful aging, we calculated population-attributable risk (PAR) for individual and combined healthy behaviours. Population-attributable risk is the reduction in the rate of a disease that would be seen if the population were entirely unexposed to the risk factor, compared with the current pattern of exposure. Applied to successful aging, PAR represents the gain in
cases of successful aging that would be achieved if everyone engaged in healthy behaviours, assuming that the association between healthy behaviours and successful aging is causal. The relation can be expressed by the following equation:
PAR = f(OR – 1)/(1 + f(OR – 1)
where f is the proportion of healthy behaviours in the total population at baseline, and OR is the odds ratio for successful aging for the specific healthy behaviour compared with the reference. We adjusted these estimates for covariates in a fashion similar to the corresponding logistic models for ORs.
In our first set of analyses, healthy behaviours were entered together in a model adjusted for age, sex, level of education and marital status. We then used the same method to assess the association between the number of healthy behaviours and successful aging and survival. To test whether there was a dose–response relation between the number of healthy behaviours and each outcome, we treated the number of healthy behaviours in the logistic model as a continuous variable; the Wald test p for this variable was the test for linear trend, and p less than 0.05 was considered significant. Finally, we examined separately the association between the number of healthy behaviours and each measure of
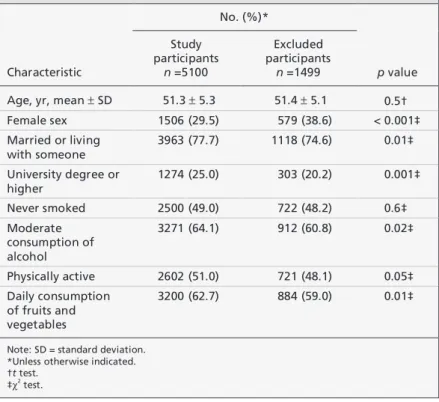
func-Table 1: Baseline characteristics of participants included in the analysis in
comparison with those excluded because of missing data on health outcomes
Characteristic No. (%)* p value Study participants n =5100 Excluded participants n =1499
Age, yr, mean ± SD 51.3 ± 5.3 51.4 ± 5.1 0.5† Female sex 1506 (29.5) 579 (38.6) < 0.001‡ Married or living with someone 3963 (77.7) 1118 (74.6) 0.01‡ University degree or higher 1274 (25.0) 303 (20.2) 0.001‡ Never smoked 2500 (49.0) 722 (48.2) 0.6‡ Moderate consumption of alcohol 3271 (64.1) 912 (60.8) 0.02‡ Physically active 2602 (51.0) 721 (48.1) 0.05‡ Daily consumption of fruits and vegetables 3200 (62.7) 884 (59.0) 0.01‡
Note: SD = standard deviation. *Unless otherwise indicated. †t test.
‡χ2
tioning using separate logistic regression models for each functioning outcome. The p for trend was estimated using the p associated with the number of healthy behaviours when entered as a continu-ous variable in the logistic regression models.
We did several sets of sensitivity analyses. To assess whether the association with successful aging was influenced by deaths, we excluded deaths from the analytic sample. In addition, because scores on the mental health component of the 2007–2009 questionnaire are known to improve with age, we tested the robustness of our results using age- and sex-specific quintiles to define good mental health. Finally, to examine the extent to which missing data influenced our results, we used inverse probability weighting (see Appendix 1 for further details).47
Results
We included 5100 participants in the study. The mean age of participants was similar to that of the 1499 people excluded from our analysis because of missing data on health outcomes (51.3 v. 51.4 yr, p = 0.50) (Table 1). However, the analytic sample comprised fewer women (29.5% v. 38.6%, p < 0.001) and more partici-pants with healthy behaviours other than smok-ing (Table 1).
Among participants, 549 died during follow-up, and 953 met the criteria for successful aging
Research
1988 CMAJ, December 11, 2012, 184(18)
Table 2: Comparison of characteristics between participants in the
successful and normal aging groups
Characteristic Successful aging* n = 953 Normal aging† n = 3598 At baseline
Age, yr, mean ± SD 49.7 ± 4.9 51.3 ± 5.3 Married or living with someone, no. (%) 774 (81.2) 2798 (77.8) University degree or higher, no. (%) 301 (31.6) 872 (24.2) Female sex, no. (%) 247 (25.9) 1087 (30.2)
At follow-up
Coronary artery disease, no. (%) 0 (0) 581 (16.1) Stroke‡, no. (%) 0 (0) 178 (5.3) Cancer‡, no. (%) 0 (0) 614 (17.1) Diabetes mellitus‡, no. (%) 0 (0) 618 (17.1)
≥ 1 limitation in ADL/IADL, no. (%) 0 (0) 581 (16.2) Systolic blood pressure, mm Hg,
mean ± SD
120.2 ± 10.9 128.9 ± 17.6 Forced expiratory volume, L/m2
, mean ± SD
1.1 ± 0.2 0.9 ± 0.2 Walking speed, m/s, mean ± SD 1.3 ± 0.2 1.1 ± 0.3 Cognitive function, z score, mean ± SD 0.5 ± 0.7 –0.2 ± 1.0 Mental health score, mean ± SD 56.3 ± 4.2 52.9 ± 9.2
Note: ADL = activities of daily living, IADL = instrumental activities of daily living, SD = standard deviation.
*For criteria defining successful aging, see Methods.
†Participants who were alive at the end of follow-up, but who were not classified as successful agers.
‡Calculated using available data. For stroke, data were missing for 239 participants; for cancer, data were missing for 6 participants; for diabetes, data were missing for 5 participants.
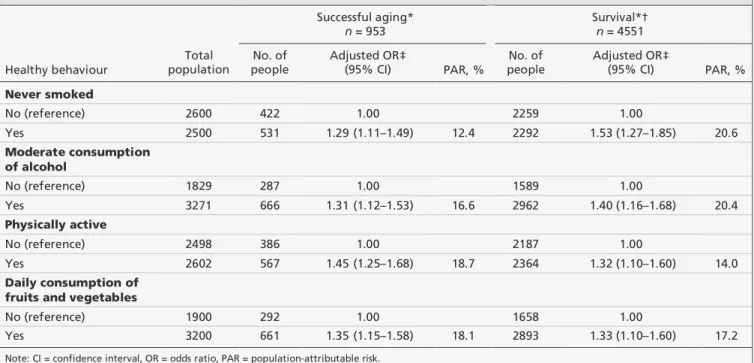
Table 3: Association between healthy behaviours, successful aging and survival to end of follow-up among 5100 participants
Healthy behaviour Total population Successful aging* n = 953 Survival*† n = 4551 No. of people Adjusted OR‡ (95% CI) PAR, % No. of people Adjusted OR‡ (95% CI) PAR, % Never smoked No (reference) 2600 422 1.00 2259 1.00 Yes 2500 531 1.29 (1.11–1.49) 12.4 2292 1.53 (1.27–1.85) 20.6 Moderate consumption of alcohol No (reference) 1829 287 1.00 1589 1.00 Yes 3271 666 1.31 (1.12–1.53) 16.6 2962 1.40 (1.16–1.68) 20.4 Physically active No (reference) 2498 386 1.00 2187 1.00 Yes 2602 567 1.45 (1.25–1.68) 18.7 2364 1.32 (1.10–1.60) 14.0 Daily consumption of fruits and vegetables
No (reference) 1900 292 1.00 1658 1.00
Yes 3200 661 1.35 (1.15–1.58) 18.1 2893 1.33 (1.10–1.60) 17.2
Note: CI = confidence interval, OR = odds ratio, PAR = population-attributable risk.
*The binary outcomes are successful aging versus normal aging or death, and survival to the end of follow-up versus death. †Includes successful and normal aging groups.
at the end of follow-up. Compared with the nor-mally aging group, parti cipants in the success-fully aging group were younger (mean age 49.7 [standard deviation (SD) 4.9] v. 51.3 [SD 5.3] yr), and were more likely to be married (81.2% v. 77.8%) and have a university educa-tion or higher (31.6% v. 24.2%) (t test for contin-uous variables, χ2test for categorical variables,
all p < 0.001) (Table 2).
Table 3 shows the association of each healthy behaviour with successful aging and staying alive for the duration of follow-up (i.e., survival). Because there was no interaction between healthy behaviours and sex (data not shown, Wald test, all p > 0.17), we combined men and women in the analysis. Compared with former and current smokers, participants who had never smoked had 1.3 times greater odds of meeting the criteria for successful aging (OR 1.29, 95% confidence interval [CI] 1.11–1.49; PAR 12.4%) and 1.5 times greater odds of survival (OR 1.53, 95% CI 1.27–1.85; PAR 20.6%) (Table 3). Com-pared with no and heavy alcohol consumption, moderate consumption was associated with greater odds of successful aging (OR 1.31, 95% CI 1.12–1.53; PAR = 16.6%) and survival (OR 1.40, 95% CI 1.16–1.68; PAR 20.4%) (Table 3). Compared with inactive participants, participants who were physically active were more likely to meet the criteria for successful aging (OR 1.45, 95% CI 1.25–1.68; PAR = 18.7%) and to be alive at the end of follow-up (OR 1.32, 95% CI 1.10– 1.60; PAR 14.0%) (Table 3). Finally, consuming fruits and vegetables daily was associated with greater odds of successful aging (OR 1.35, 95% CI 1.15–1.58; PAR 18.1%) and survival (OR 1.33, 95% CI 1.10–1.60; PAR 17.2%) (Table 3).
In our study population, 4.9% of the partici-pants engaged in no healthy behaviours (score = 0), 18.3% engaged in 1 (score = 1), 33.8% engaged in 2 (score = 2), 31.3% engaged in 3 (score = 3), and 11.8% engaged in 4 (score = 4) (data not shown). The mean change in score 5 years later was small for both the normally aging group (0.08 ± 0.95) and the successfully aging group (0.00 ± 0.95) (data not shown). By the end of follow-up, the mean score for healthy behaviours had increased in both groups (0.10 ± 1.00 for the normally aging group; 0.17 ± 0.95 for the successfully aging group) (data not shown). The correlation between repeated mea-surements of the score was 0.58 (Spearman cor-relation, p < 0.001, n = 4381) at 5 years’ follow-up and 0.53 (Spearman correlation, p < 0.001, n = 4186) at the final follow-up (data not shown).
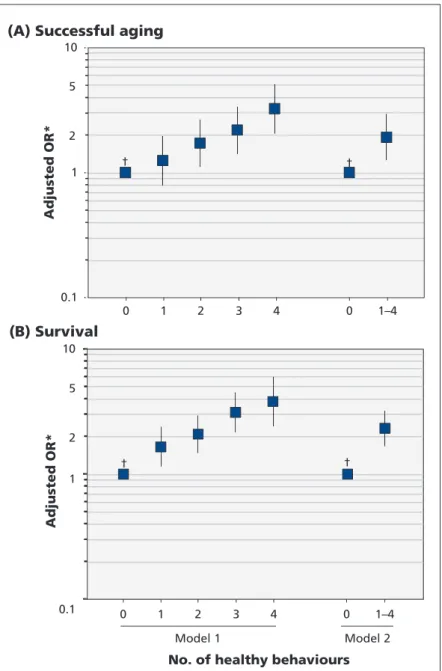
Compared with participants who engaged in no healthy behaviours at baseline, participants who engaged in 2 or more healthy behaviours
had greater odds of successful aging and survival (Figure 2). The OR for having at least 1 healthy behaviour was 1.92 for successful aging (PAR 46.6%) and 2.32 for being alive at the end of follow-up (PAR 55.6%) (Figure 2). The benefit of healthy behaviours appeared to increase lin-early (Wald test, p < 0.001): when the score for healthy behaviours was entered in the logistic model as a continuous variable, the OR per 1 additional healthy behaviour was 1.33 (95% CI
0.1 1 10 0 1 2 3 4 0 1–4 Adjusted OR*
(A) Successful aging
0.1 1 10
No. of healthy behaviours
Adjusted OR* (B) Survival 0 1 2 3 4 0 1–4 2 l e d o M 1 l e d o M † † † † 2 5 2 5
Figure 2: Association between the number of healthy behaviours participants showed at baseline and (A) successful aging or (B) survival. In model 1, each number of healthy behaviours is included in the model as a category, and ORs are calculated with “0 healthy behaviours” as the reference group. In model 2, the category 1–4 includes all participants with 1–4 healthy behaviours, and the ORs are calculated with “0 healthy behaviours” as the reference group. The binary outcomes are successful aging versus death or normal aging, and survival to the end of follow-up versus death. OR = odds ratio. Error bars indicate 95% confidence intervals. *Models were adjusted for age, sex, level of education and marital status, and were mutually adjusted for all health behaviours. †Reference.
1.24–1.43) for successful aging and 1.39 (95% CI 1.27–1.52) for survival.
As the number of healthy behaviours in -creased, so did the odds of absence of disability; good lung, cognitive and physical functioning; and mental health (Table 4, all p for trend < 0.001; Appendix 3, available at www .cmaj .ca /lookup /suppl /doi:10.1503/cmaj.121080/-/DC1). We saw no corresponding association for sys-tolic blood pressure before taking into account antihypertensive drugs; repeating the analysis using medication data and good systolic blood pressure to define good functioning showed a clear association with the number of healthy behaviours (p for trend < 0.001).
Our sensitivity analyses showed that exclud-ing deaths from the main analysis did not change the association between healthy behaviours and successful aging (OR per 1 additional healthy behaviour was 1.29, 95% CI 1.20–1.38; Appen-dix 4, available at www .cmaj .ca /lookup /suppl /doi:10.1503/cmaj.121080/-/DC1). We found similar results when alternative cut-offs for good mental health were used (OR per 1 additional healthy behaviour 1.37, 95% CI 1.27–1.47; Appendix 5, available at www .cmaj .ca /lookup /suppl/doi:10.1503/cmaj.121080/-/DC1). In addition, the results were little changed with inverse probability weighting to account for missing data (OR per 1 additional healthy behav-iour 1.35, 95% CI 1.25–1.45 for successful aging; OR 1.40, 95% CI 1.29–1.53 for survival; Ap pendix 6, available at www.cmaj .ca /lookup /suppl /doi :10 .1503 /cmaj .121080 /- /DC1).
Interpretation
Among members of a large cohort of British men and women 42–63 years of age at baseline, all 4 healthy behaviours examined during midlife (i.e., never smoking, moderate consumption of alcohol, engaging in some physical activity and eating fruits and vegetables daily) were associ-ated with greater odds of successful aging during a 16-year follow-up. Compared with participants who engaged in no healthy behaviours, those who engaged in all 4 healthy behaviours had greater odds of aging successfully.
The benefits of healthy behaviours appeared to increase linearly as a function of the number of healthy behaviours present. In addition, the effect of healthy behaviours does not appear to be confined to any particular domain of success-ful aging. Associations were evident for each of the functional domains we measured: cognitive, mental, respiratory and cardiovascular.
Our findings advance current knowledge on successful aging.2,7,9–13,27,48–51Few previous studies
Research
1990 CMAJ, December 11, 2012, 184(18) T a b le 4 : A ss o ci a ti o n s b e tw e e n th e n u m b e r o f h e a lt h y b e h a v io u rs a n d m e a su re s of fu n ct io n in g u se d t o d e fi n e s u cc e ss fu l a g in g M e a su re o f fu n ct io n in g , a d ju st e d * O R (9 5 % C I) N o . o f h e a lt h y b e h a v io u rs G o o d l u n g fu n ction † G o o d c o g n it iv e fu n ction † G o o d p h y si ca l fu n ction † No di sa b il it y ‡ G o o d m e n ta l h e a lt h § G o o d s y st o li c B P ¶ G o o d s y st o li c B P o r n o u se o f a n tihy pert e n si v e d ru g s 0 (r e fe re n ce ) 1 .0 0 1 .0 0 1 .0 0 1 .0 0 1 .0 0 1 .0 0 1 .0 0 1 1 .6 9 (1 .1 2 – 2 .5 5 ) 0 .8 5 (0 .5 8 – 1 .2 6 ) 1 .3 4 (0 .9 3 – 1 .9 1 ) 1 .1 9 (0 .8 1 – 1 .7 4 ) 1 .1 8 (0 .7 5 – 1 .8 3 ) 0 .7 8 (0 .5 0 – 1 .2 2 ) 1 .0 2 (0 .7 3 – 1 .4 1 ) 2 2 .0 8 (1 .4 1 – 3 .0 7 ) 1 .1 2 (0 .7 7 – 1 .6 3 ) 1 .8 2 (1 .2 9 – 2 .5 6 ) 1 .6 0 (1 .1 1 – 2 .3 1 ) 1 .8 1 (1 .1 7 – 2 .7 9 ) 0 .7 9 (0 .5 5 – 1 .1 5 ) 1 .3 0 (0 .9 6 – 1 .7 9 ) 3 2 .8 4 (1 .9 1 – 4 .2 2 ) 1 .6 2 (1 .1 0 – 2 .3 7 ) 2 .1 7 (1 .5 4 – 3 .0 8 ) 1 .8 2 (1 .2 5 – 2 .6 3 ) 2 .3 3 (1 .5 0 – 3 .6 2 ) 0 .9 8 (0 .7 1 – 1 .3 9 ) 1 .4 0 (1 .0 2 – 1 .9 1 ) 4 3 .6 3 (2 .3 1 – 5 .7 1 ) 2 .1 5 (1 .3 9 – 3 .3 3 ) 2 .9 7 (1 .9 9 – 4 .4 5 ) 2 .2 7 (1 .4 9 – 3 .4 7 ) 3 .1 2 (1 .8 3 – 5 .2 9 ) 1 .0 5 (0 .8 0 – 1 .7 1 ) 1 .6 1 (1 .1 5 – 2 .2 6 ) p f o r tr e n d < 0 .0 0 1 < 0 .0 0 1 < 0 .0 0 1 < 0 .0 0 1 < 0 .0 0 1 0 .4 < 0 .0 0 1 N o te : B P = b lo o d p re ss u re , C I = co n fi d en ce in te rv al , OR = o d d s ra ti o . *A d ju st e d f o r ag e, s e x , le v e l o f e d u cat io n a n d ma ri tal s ta tu s. N u mb e rs o f p a rt ic ip an ts v a ry f ro m 3487 to 4455, d ep e n d in g o n t h e meas u re o f fu n ct io n in g (s e e A p p en d ix 3 fo r fu rt h e r d e tai ls ). †D ef in ed as n o t b ei n g i n t h e lo w es t ag e- an d s e x -s ta n d a rd iz ed q u in ti le . ‡D ef in ed as n o s el f-re p o rt e d d if fi cu lt ies i n b a si c an d i n st ru me n tal ac ti v it ie s o f d a il y l iv in g . §D ef in ed as s co re > 42 o n me n tal co m p o n e n t o f th e 2007– 2009 q u e st io n n a ir e. ¶ D ef in ed as n o t b e in g i n t h e h ig h e st ag e- a n d s ex -s tan d a rd iz ed q u in ti le o f sy st o li c b lo o d p re ss u re .have examined the importance of healthy behav-iours for successful aging, with successful aging defined using both good functioning and the absence of disease.10–12 The associations we saw
were similar to those from previous studies,10–12with
the exception of physical activity. The association between physical activity and successful aging has shown heterogeneity across studies. In addition, our study shows the cumulative impact of healthy behaviours on successful aging — the greater the number of healthy behaviours, the greater the bene-fit. Furthermore, our sensitivity analyses show that the increased risk of death associated with un -healthy behaviours does not explain our results.
Strengths and limitations
Our study’s strengths include its comprehensive definition of successful aging based on a large set of objective functioning measures, its prospective design and long follow-up, and its large sample size.
We did not examine the mechanisms underly-ing the associations we saw in this study.
Because our results are from a study involv-ing an occupational cohort, the participants are healthier than the general population.52Few of
the participants engaged in very unhealthy behaviours, such as heavy alcohol consumption. For this reason, it is possible that some of the associations we report are underestimated.
We were not able to determine health status for some of the participants owing to missing data on functional outcomes. Because participants who dropped-out were more likely to have health prob-lems,53,54the associations we report may be
under-estimated. However, sensitivity analyses using inverse probability weighting suggested that any bias due to missing data is likely to be small.
Because we assessed health behaviours using self-reports, our data could be subject to poten-tial measurement errors.
The variables used to construct the outcomes were available at different times — chronic dis-eases throughout follow-up, and functioning measures at the end of the follow-up. Thus, it was not possible to examine the association between the duration of exposure and the out-comes. Such analyses may have been biased by reverse causation.
The sample population did not include anyone older than 80 years, so we were unable to examine whether our results extend to older age groups.
Conclusion
Although individual healthy behaviours are mod-erately associated with successful aging, their combined impact is quite substantial. Multiple healthy behaviours appear to increase the chance
of reaching old age disease-free and fully func-tional in an additive manner. Our results should motivate lifestyle changes that not only reduce mortality and morbidity, but also improve quality of life at older ages.
References
1. Christensen K, Doblhammer G, Rau R, et al. Ageing popula-tions: the challenges ahead. Lancet 2009;374:1196-208. 2. Depp CA, Jeste DV. Definitions and predictors of successful
aging: a comprehensive review of larger quantitative studies. Am
J Geriatr Psychiatry2006;14:6-20.
3. Kivimäki M, Ferrie JE. Epidemiology of healthy ageing and the idea of more refined outcome measures. Int J Epidemiol 2011; 40:845-7.
4. Rockwood K, Andrew M, Mitnitski A. A comparison of two approaches to measuring frailty in elderly people. J Gerontol A
Biol Sci Med Sci2007;62:738-43.
5. Kulminski AM, Ukraintseva SV, Kulminskaya IV, et al. Cumula-tive deficits better characterize susceptibility to death in elderly people than phenotypic frailty: lessons from the Cardiovascular Health Study. J Am Geriatr Soc 2008;56:898-903.
6. Jagger C, Gillies C, Moscone F, et al. Inequalities in healthy life years in the 25 countries of the European Union in 2005: a cross-national meta-regression analysis. Lancet 2008;372:2124-31. 7. Klijs B, Mackenbach JP, Kunst AE. Obesity, smoking, alcohol
consumption and years lived with disability: a Sullivan life table approach. BMC Public Health 2011;11:378.
8. Strawbridge WJ, Cohen RD, Shema SJ, et al. Successful aging: pre-dictors and associated activities. Am J Epidemiol 1996; 144: 135-41. 9. Reed DM, Foley DJ, White LR, et al. Predictors of healthy aging
in men with high life expectancies. Am J Public Health 1998; 88:1463-8.
10. Sun Q, Townsend MK, Okereke OI, et al. Physical activity at midlife in relation to successful survival in women at age 70 years or older. Arch Intern Med 2010;170:194-201.
11. Willcox BJ, He Q, Chen R, et al. Midlife risk factors and healthy survival in men. JAMA 2006;296:2343-50.
12. Sun Q, Townsend MK, Okereke OI, et al. Alcohol consumption at midlife and successful ageing in women: a prospective cohort analysis in the nurses’ health study. PLoS Med 2011; 8: e1001090. 13. Parslow RA, Lewis VJ, Nay R. Successful aging: development and testing of a multidimensional model using data from a large sample of older Australians. J Am Geriatr Soc 2011;59:2077-83. 14. Global health risks. Mortality and burden of disease attributable to selected major risks. Geneva (Switzerland): World Health Organization; 2009.
15. Gopinath B, Flood VM, Burlutsky G, et al. Combined influence of health behaviors on total and cause-specific mortality. Arch
Intern Med2010;170:1605-7.
16. Hamer M, Bates CJ, Mishra GD. Multiple health behaviors and mortality risk in older adults. J Am Geriatr Soc 2011;59:370-2. 17. Khaw KT, Wareham N, Bingham S, et al. Combined impact of
health behaviours and mortality in men and women: the EPIC-Norfolk prospective population study. PLoS Med 2008;5:e12. 18. King DE, Mainous AG III, Geesey ME. Turning back the clock:
adopting a healthy lifestyle in middle age. Am J Med 2007; 120: 598-603.
19. Knoops KT, de Groot LC, Kromhout D, et al. Mediterranean diet, lifestyle factors, and 10-year mortality in elderly European men and women: the HALE project. JAMA 2004;292:1433-9. 20. Kvaavik E, Batty GD, Ursin G, et al. Influence of individual and
combined health behaviors on total and cause-specific mortality in men and women: the United Kingdom Health and Lifestyle Survey. Arch Intern Med 2010;170:711-8.
21. van Dam RM, Li T, Spiegelman D, et al. Combined impact of lifestyle factors on mortality: prospective cohort study in US women. BMJ 2008;337:a1440.
22. Ford ES, Zhao G, Tsai J, et al. Low-risk lifestyle behaviors and all-cause mortality: findings from the National Health and Nutri-tion ExaminaNutri-tion Survey III Mortality Study. Am J Public Health 2011;101:1922-9.
23. van den Brandt PA. The impact of a Mediterranean diet and healthy lifestyle on premature mortality in men and women. Am
J Clin Nutr2011;94:913-20.
24. Chiuve SE, McCullough ML, Sacks FM, et al. Healthy lifestyle factors in the primary prevention of coronary heart disease among men: benefits among users and nonusers of lipid-lowering and antihypertensive medications. Circulation 2006; 114: 160-7. 25. Chiuve SE, Rexrode KM, Spiegelman D, et al. Primary
26. Myint PK, Luben RN, Wareham NJ, et al. Combined effect of health behaviours and risk of first ever stroke in 20,040 men and women over 11 years’ follow-up in Norfolk cohort of European Prospective Investigation of Cancer (EPIC Norfolk): prospective population study. BMJ 2009;338:b349.
27. Ford ES, Bergmann MM, Kroger J, et al. Healthy living is the best revenge: findings from the European Prospective Investiga-tion Into Cancer and NutriInvestiga-tion-Potsdam study. Arch Intern Med 2009; 169:1355-62.
28. Hu FB, Manson JE, Stampfer MJ, et al. Diet, lifestyle, and the risk of type 2 diabetes mellitus in women. N Engl J Med 2001; 345: 790-7.
29. Stampfer MJ, Hu FB, Manson JE, et al. Primary prevention of coronary heart disease in women through diet and lifestyle. N
Engl J Med2000;343:16-22.
30. Platz EA, Willett WC, Colditz GA, et al. Proportion of colon cancer risk that might be preventable in a cohort of middle-aged US men. Cancer Causes Control 2000;11:579-88.
31. Sabia S, Nabi H, Kivimäki M, et al. Health behaviors from early to late midlife as predictors of cognitive function: the Whitehall II study. Am J Epidemiol 2009;170:428-37.
32. Marmot M, Brunner E. Cohort profile: the Whitehall II study. Int
J Epidemiol2005;34:251-6.
33. Royal College of Physicians; Science and Technology Select
Com-mittee inquiry on alcohol guidelines. London (UK): The College; 2011. Available: www .publications .parliament .uk /pa /cm201012 /cmselect /cmsctech/writev/1536/ag22.htm (accessed 2012 Oct. 11). 34. Stringhini S, Dugravot A, Shipley M, et al. Health behaviours, socioeconomic status, and mortality: further analyses of the British Whitehall II and the French GAZEL prospective cohorts.
PLoS Med2011;8:e1000419.
35. Sabia S, Elbaz A, Dugravot A, et al. Impact of smoking on cog-nitive decline in early old age: the Whitehall II cohort study.
Arch Gen Psychiatry2012;69:627-35.
36. Tunstall-Pedoe H, Kuulasmaa K, Amouyel P, et al. Myocardial infarction and coronary deaths in the World Health Organization MONICA Project. Registration procedures, event rates, and case-fatality rates in 38 populations from 21 countries in four continents. Circulation 1994;90:583-612.
37. World Health Organization. Rose GA, Blackburn H, Gillum RF, et al. Cardiovascular survey methods. 2nd ed. Geneva (Switzer-land): The Organization; 1982.
38. Ferrie JE, Langenberg C, Shipley MJ, et al. Birth weight, com-ponents of height and coronary heart disease: evidence from the Whitehall II study. Int J Epidemiol 2006;35:1532-42. 39. Expert Committee on the Diagnosis and Classification of
Dia-betes Mellitus. Report of the expert committee on the diagnosis and classification of diabetes mellitus. Diabetes Care 2003; 26(Suppl 1):S5-20.
40. Katz S, Downs TD, Cash HR, et al. Progress in development of the index of ADL. Gerontologist 1970;10:20-30.
41. Lawton MP, Brody EM. Assessment of older people: self-main-taining and instrumental activities of daily living. Gerontologist 1969; 9:179-86.
42. Singh-Manoux A, Marmot MG, Glymour M, et al. Does cognitive reserve shape cognitive decline? Ann Neurol 2011;70:296-304. 43. Guralnik JM, Simonsick EM, Ferrucci L, et al. A short physical
performance battery assessing lower extremity function: associa-tion with self-reported disability and predicassocia-tion of mortality and nursing home admission. J Gerontol 1994;49:M85-94. 44. Singh-Manoux A, Dugravot A, Kauffmann F, et al. Association
of lung function with physical, mental and cognitive function in early old age. Age (Dordr) 2011;33:385-92.
45. Ware JE, Snow KK, Kosinski M. SF-36 Health Survey: manual
and interpretation guide. Boston (MA): The Health Institute, New England Medical Centre; 1993.
46. Silveira E, Taft C, Sundh V, et al. Performance of the SF-36 Health Survey in screening for depressive and anxiety disorders in an elderly female Swedish population. Qual Life Res 2005; 14:1263-74.
47. Seaman SR, White IR. Review of inverse probability weighting for dealing with missing data. Stat Methods Med Res 2011 Jan. 10 [Epub ahead of print].
48. Nusselder WJ, Franco OH, Peeters A, et al. Living healthier for longer: comparative effects of three heart-healthy behaviors on life expectancy with and without cardiovascular disease. BMC
Public Health2009;9:487.
49. Myint PK, Smith RD, Luben RN et al. Lifestyle behaviours and quality-adjusted life years in middle and older age. Age Ageing 2011;40:589-95.
50. Savela SL, Koistinen P, Tilvis RS, et al. Physical activity at midlife and health-related quality of life in older men. Arch
Intern Med2010;170:1171-2.
51. Strandberg AY, Strandberg TE, Pitkala K, et al. The effect of smoking in midlife on health-related quality of life in old age: a 26-year prospective study. Arch Intern Med 2008;168:1968-74. 52. Wills AK, Lawlor DA, Matthews FE, et al. Life course
trajecto-ries of systolic blood pressure using longitudinal data from eight UK cohorts. PLoS Med 2011;8:e1000440.
53. Ferrie JE, Kivimaki M, Singh-Manoux A, et al. Non-response to baseline, non-response to follow-up and mortality in the White-hall II cohort. Int J Epidemiol 2009;38:831-7.
54. Tyas SL, Tate RB, Wooldrage K, et al. Estimating the incidence of dementia: the impact of adjusting for subject attrition using health care utilization data. Ann Epidemiol 2006;16:477-84. Affiliations:From the Department of Epidemiology and Public Health (Sabia, Singh-Manoux, Hagger-Johnson, Brunner, Kivimaki), University College London, London, UK; Inserm U1018 (Singh-Manoux), Institut national de la santé et de la recherche médicale, Villejuif Cedex, France; the Centre de Gérontologie (Singh-Manoux), Hôpital Ste Périne, AP-HP, France; and the Institut national d’études démographiques INED (Cambois), Paris, France.
Contributors: Séverine Sabia drafted and wrote the manu-script and performed the statistical analyses. All of the authors contributed to the design of the study, interpreted the results, revised the manuscript and approved the final version submitted for publication.
Funding:Data collection was funded by the UK Medical Research Council (G0902037), the British Heart Foundation and the US National Institute on Aging (R01AG013196). Salary support received by the investigators was obtained from the Medical Research Council (G0902037 for Eric Brunner and Mika Kivimaki), the National Institute on Aging (R01AG013196 and R01AG034454 for Séverine Sabia, Archana Singh-Manoux, Gareth Hagger-Johnson, Mika Kivi-maki), a European Young Investigator Award from the Euro-pean Science Foundation (Archana Singh-Manoux) and an Economic and Social Research Council professorial fellowship (Mika Kivimaki). The funders had no role in the design or con-duct of the study; in the collection, analysis and interpretation of data; in the preparation or approval of the manuscript; and in the decision to submit it for publication.
Acknowledgements: The authors thank all of the participating civil service departments and their welfare, personnel, and establishment officers; the British Occupational Health and Safety Agency; the British Council of Civil Service Unions; all of the Whitehall II study participants; and all members of the Whitehall II study team. The Whitehall II study team comprises research scientists, statisticians, study coordinators, nurses, data managers, administrative assistants and data-entry staff, who make the study possible.