HAL Id: hal-01864270
https://hal-univ-paris.archives-ouvertes.fr/hal-01864270
Submitted on 29 Aug 2018
HAL is a multi-disciplinary open access
archive for the deposit and dissemination of
sci-entific research documents, whether they are
pub-lished or not. The documents may come from
teaching and research institutions in France or
abroad, or from public or private research centers.
L’archive ouverte pluridisciplinaire HAL, est
destinée au dépôt et à la diffusion de documents
scientifiques de niveau recherche, publiés ou non,
émanant des établissements d’enseignement et de
recherche français ou étrangers, des laboratoires
publics ou privés.
Distributed under a Creative Commons Attribution - NonCommercial - NoDerivatives| 4.0
International License
ultrafast ultrasound for hybrid molecular, anatomical
and functional imaging
Jean Provost, Anikitos Garofalakis, Joevin Sourdon, Damien Bouda, Béatrice
Berthon, Thomas Viel, Mailyn Perez-Liva, Charlotte Lussey-Lepoutre, Judith
Favier, Mafalda Correia, et al.
To cite this version:
Jean Provost, Anikitos Garofalakis, Joevin Sourdon, Damien Bouda, Béatrice Berthon, et al..
Si-multaneous positron emission tomography and ultrafast ultrasound for hybrid molecular, anatomical
and functional imaging. Nature Biomedical Engineering, Nature Publishing Group, 2018, 2, pp.85-94.
�10.1038/s41551-018-0188-z�. �hal-01864270�
1Institut Langevin, Ecole Supérieure de Physique et de Chimie Industrielles, Paris Sciences and Letters Research University CNRS UMR 7587 Inserm U979,
Inserm Technology Research Accelerator in Biomedical Ultrasound, Paris, France. 2Inserm, UMR970, Paris Cardiovascular Research Center, Paris, France. 3Faculté de Médecine, Université Paris Descartes, Sorbonne Paris Cité, Paris, France. 4Faculté de Médecine, Université Pierre et Marie Curie, Paris, France. 5Nuclear Medicine Department, Pitié-Salpêtrière Hospital, Paris, France. 6Faculté de Médecine, Université de Nice Sophia Antipolis, Nice, France. 7Équipe
Contrôle Métabolique des Morts Cellulaires, Inserm, U1065, Centre Méditerranéen de Médecine Moléculaire, Nice, France. 8Institute for Research on Cancer
and Aging, Université de Nice Sophia Antipolis, Centre Antoine Lacassagne, Nice, France. 9Department of Medical Biology, Centre Scientifique de Monaco,
Monaco, Monaco. 10Department of Radiology, Georges Pompidou European Hospital, Paris, France. Jean Provost and Anikitos Garofalakis contributed
equally to this work. Mickael Tanter and Bertrand Tavitian jointly supervised this work. *e-mail: mickael.tanter@espci.fr; bertrand.tavitian@inserm.fr
I
n vivo imaging is a major driver of biomedical sciences, as well
as an important pillar of evidence-based medicine for diagnosis,
follow-up of disease evolution and assessment of treatment
effi-cacy
1. In contrast with most bioanalytical techniques, in vivo
imag-ing is non-invasive and non-destructive, and therefore repeatable. It
can also be directly translated clinically, but comes with increased
cost and complexity and typically yields just one or a few biological
parameters at a time. This low parametric output is far from the
multi-parametric data derived from omics technologies and greatly
limits the capacity of in vivo imaging to decipher complex diseases
with multiple hallmarks, such as cancer
2. A preferred approach to
overcoming this limitation is to combine different imaging
tech-niques that superimpose co-registered information from the same
subject. Accordingly, modern imaging calls increasingly on bimodal
instruments, such as positron emission tomography
(PET)–com-puted tomography (CT)
3, single-photon emission computed
tomography–CT (SPECT–CT)
4or the more recent PET–magnetic
resonance imaging (MRI)
5,6.
We propose a hybrid imaging instrument and approach based on
PET–CT and ultrafast ultrasound imaging (UUI)
7–10to link
meta-bolic activity with the physiological correlates described by
hae-modynamic, biomechanical, electrophysiological and quantitative
structural parameters. PET is the gold standard for molecular
imag-ing because it can detect picomolar concentrations of molecular
probes with a resolution typically in the millimetre range. PET–CT
combines anatomical and molecular imaging modalities and is the
reference clinical imaging technique for staging cancer extension.
Other applications of PET include the diagnosis and follow-up of
Alzheimer’s disease
11, differential diagnosis of neurological
dis-orders
12and identification of vulnerable atheroma plaques
13. The
exquisite capacity of PET to non-invasively depict local
biochemis-try has triggered the invention of myriad PET tracers (referenced in
the Molecular Imaging and Contrast Agent Database
14), of which an
increasing number reach clinical approval for diagnostics.
UUI has the unique capability of acquiring images in a large
field of view within a fraction of a millisecond, which enables the
study of rapid phenomena and the accumulation of large amounts
of data to achieve high sensitivity. UUI benefits from a very active
field of research from which imaging modes emerge on a regular
basis
15. Applications include the imaging of brain activation
7,9,10,
quantification of tissue stiffness for cancer or fibrosis staging
16,
car-diac activation
17, fat content
18, mechanical stress
19and non-invasive
angiography of small vessels
20in vivo. Most recently, UUI has been
extended to three dimensions, allowing for the acquisition of
thou-sands of volumes per second
21, and the introduction of a
super-reso-lution UUI mode non-invasively revealed the anatomy and the fully
quantified function of resolved capillaries of the entire rat brain
in vivo and on the microscopic scale
8. UUI is also highly
transla-tional since imaging modes developed for small animals can be
readily applied clinically using adapted ultrasound probes.
Simultaneous positron emission tomography
and ultrafast ultrasound for hybrid molecular,
anatomical and functional imaging
Jean Provost
1, Anikitos Garofalakis
2,3, Joevin Sourdon
2,3, Damien Bouda
2,3, Béatrice Berthon
1,
Thomas Viel
2,3, Mailyn Perez-Liva
2,3, Charlotte Lussey-Lepoutre
2,4,5, Judith Favier
2,3,
Mafalda Correia
1, Mathieu Pernot
1, Johanna Chiche
6,7, Jacques Pouysségur
8,9, Mickael Tanter
1* and
Bertrand Tavitian
2,3,10*
Positron emission tomography–computed tomography (PET–CT) is the most sensitive molecular imaging modality, but it does
not easily allow for rapid temporal acquisition. Ultrafast ultrasound imaging (UUI)—a recently introduced technology based on
ultrasonic holography—leverages frame rates of up to several thousand images per second to quantitatively map, at high
reso-lution, haemodynamic, biomechanical, electrophysiological and structural parameters. Here, we describe a pre-clinical scanner
that registers PET–CT and UUI volumes acquired simultaneously and offers multiple combinations for imaging. We
demon-strate that PET–CT–UUI allows for simultaneous images of the vasculature and metabolism during tumour growth in mice and
rats, as well as for synchronized multi-modal cardiac cine-loops. Combined anatomical, functional and molecular imaging with
PET–CT–UUI represents a high-performance and clinically translatable technology for biomedical research.
We present a PET–CT–UUI triple-imaging modality that
inte-grates the three imaging modalities in one device for simultaneous,
fully co-registered imaging, enabling image fusion independent of
motion and without increasing acquisition times. The PET–CT–
UUI instrument was assembled from existing, commercially
avail-able devices using lightweight and portavail-able UUI instrumentation
for which dedicated, customized sequences were developed. We
show that full, markerless, rigid-body three-dimensional (3D)
regis-tration was accurately achieved by controlling the ultrasound probe
with a six-degrees-of-freedom motorized micropositioner and that
the presence of the ultrasound probe had a negligible impact on the
quality of the PET volumes. Remarkably, PET–CT–UUI can
pro-duce multi-parametric information that is currently unobtainable
with any other non-invasive imaging method. Here, we demonstrate
in pre-clinical oncology and cardiology applications the capability
of this imaging modality to yield unprecedented information from
fused, simultaneously acquired volumes of PET–CT–UUI images.
results
Figure 1 shows the processing steps and experimental set-up
devel-oped for PET–CT–UUI. First, the UUI transducer was positioned
using a motorized micropositioner (Fig. 1a) over the organ of the
mouse or rat to be imaged using real-time B-mode imaging. Then,
the animal bed was moved, together with the UUI transducer,
inside the PET–CT gantry and an initial CT scan was acquired.
Acquisition of a UUI volume was achieved by displacement of the
ultrasound probe using a six-degrees-of-freedom motorized
micro-positioner remotely controlled in programmed steps, for which the
coordinates were expressed as a function of the PET–CT system
coordinates. This set-up enabled fiducial-marker-free affine
co-registration with an estimated accuracy equal to 0.095
± 0.028 mm
and based on a single calibration procedure that can be re-used for
any number of experiments. Full-body, four-dimensional,
60-min-long dynamic list-mode PET scans (Fig. 1b) were acquired after
intravenous administration of 2′ -deoxy-2′ -(
18F)fluoro-d-glucose
(FDG). The effect of the presence of the ultrasound probe in the
gantry during PET acquisitions was quantified and deemed
negli-gible, which enabled the simultaneous scanning of organs of
inter-est in one or several UUI modes: B-Mode, Doppler (Fig. 1b) or
shear-wave elastography. Experiments were conducted on tumours
in mice and on the hearts of rats, and specific methodologies were
developed for each case. Following 3D image reconstructions, the
CT, PET and UUI volumes were re-sampled to the same voxel size
and registered to yield a fused PET–UUI volume of the organ of
interest (Fig. 1c and Supplementary Video 1). Mapped parameters
derived from the image volumes; for example, peak, mean or
maxi-mal standard uptake values (SUVs) for FDG PET scans, and
tis-sue density maps, perfused vessel density and tistis-sue elasticity from
UUI, were then analysed by local correlation analysis using
bivari-ate histograms.
Here, we present selected examples that illustrate the unique sets
of parameters whose topography can be derived from PET–CT–
UUI: (1) bimodal maps of energy metabolism and microcirculation
during tumour development, (2) tumour vascularization patterns
relative to the metabolic pathway followed by cancer cells (aerobic,
anaerobic or mixed) and (3) the superimposition of cine-loops of
glucose metabolism, intramyocardial vessels, wall motion and
elas-ticity in the myocardium.
Topographical relationship between glucose metabolism and
vascularization. Simultaneous fused PET–CT–UUI volumes of
tumour metabolism and vascularization were obtained in mice
(n = 8) implanted with tumoural cell lines and tumour allografts
(Fig. 1c). Both the vasculature of the tumour and the FDG uptake
were fully co-registered, yielding observations of the topographic
relationship between vascularization and metabolism (Fig. 1c).
Note, for instance, the large vessels entering the tumour area and
their ramification in smaller vessel branches penetrating deeply
inside the tumour regions with high FDG uptake. With the present
setting, the diameter of the smallest vessels resolved using ultrafast
Doppler analysis was approximately 100 µ m.
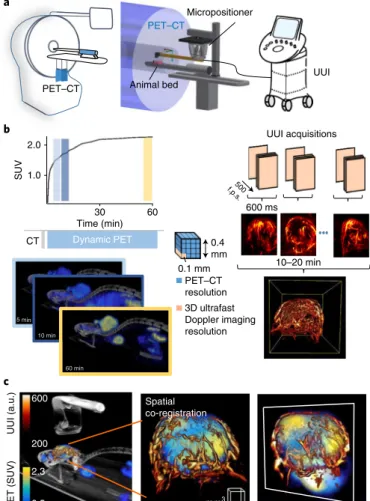
Dynamic PET PET–CT resolution 3D ultrafast Doppler imaging resolution UUI acquisitions 5 min 10 min 60 min 0.4 mm 600 ms 500 f.p.s . 10–20 min 0.1 mm CT b Spatial co-registration UUI (a.u.) PET (SUV) c mm3 a Micropositioner UUI PET–CT PET–CT Animal bed 200 600 2.3 0.5 2.0 30 Time (min) 60 SUV 1.0
Fig. 1 | PeT–CT–uui set-up and acquisitions. a, The PET–CT–UUI system
is a combination of an ultrafast ultrasound scanner and a PET–CT device. The coordinates of the ultrasound volume are determined by a motorized micropositioner, whereas the coordinates of the PET–CT volume are defined by the position of the animal bed. b, Left: SUV for FDG PET scans
(top, black line). After an initial CT scan, subsequent PET–CT acquisitions were performed in list mode, which allows for dynamic PET–CT 3D reconstructions of a mouse (bottom). The coloured bars (top) indicate the time points at which the images (bottom) were acquired. The PET–CT voxel size was 400 µ m × 400 µ m × 400 µ m. Right: UUI in ultrafast Doppler imaging mode in a mouse tumour, which involves sequentially performing and processing parallel 600-ms-long UUI acquisitions at 500 frames per second (f.p.s.) to form a 3D volume of the tumour vasculature. The size of the volume depends on the probe and sequence used and the travel distance of the micropositioner, and was typically 20 mm × 12.9 mm × 20 mm for up to 200 positions. The reconstructed UUI voxel size was 100 µ m × 100 µ m × 100 µ m. c, PET–CT–UUI images of a mouse tumour xenograft. After resampling both volumes to the UUI voxel size using spline interpolation, rendering of the fused data was performed using dedicated software, with three different colour scales: greyscale for CT, heat scale for UUI (Doppler arbitrary units, a.u.), and yellow–blue scale for PET (SUV). Left: the ultrasound probe located above the targeted tumour in the CT volume and the fused PET–UUI volume depicting the vasculature and FDG uptake. Middle: maximal intensity projection view of the spatially co-registered tumour. Right: view of image plane inside the volume.
The topographic relationship between tumour vascularization
and metabolism was explored longitudinally by repeated PET–CT–
UUI examinations of the same animals. A series of PET–CT–UUI
vol-umes obtained during the growth of a tumour allograft transplanted
from immortalized mouse chromaffin cells is shown in Fig. 2 and
Supplementary Video 2. This model carries a knockout of the Sdhb
gene, encoding the catalytic subunit of the mitochondrial enzyme
succinate dehydrogenase. In humans, SDHB-deficient tumours are
characterized by a strong avidity for glucose
22and enhanced
angio-genesis
23,24. While the growth of the tumour implanted in the
dor-sal fat pad of nude mice
25was accompanied by the development of
tumour vessels and increased FDG uptake, fusion of PET with UUI
(Fig. 2a) demonstrated that metabolism and vascularization did not
follow parallel evolutions. On the contrary, quantitative parameters
derived from the PET–UUI image volumes indicated that, during
tumour growth, the ratio of perfused vessel volume over tumour
volume decreased continuously from 51% (n
= 4) on day 14 to 28%
(n = 7) on day 32 after implantation. Relative to the metabolic
vol-ume (that is, the area in which the SUV exceeds 30% of the peak
value), the vascular volume underwent a threefold decrease (Fig. 2b)
between 14 and 32 days after implantation (P
= 0.02, Wilcoxon
signed rank test). Other parameters, such as the vessel length,
tor-tuosity and number of nodes, may also be measured on the images
and further correlated with tumour metabolism.
Bivariate analysis for tumour phenotyping. PET–CT–UUI was
used for simultaneous non-invasive measurements of distinct
tumour hallmarks
2in the same spatial coordinate system. Each
individual voxel of the combined PET–CT–UUI dataset is defined
by its spatial coordinates and by two quantitative parameters; for
instance, (1) SUV of FDG, representing the deregulation of energy
metabolism and (2) Doppler intensity, corresponding to functional,
perfused blood vessels. In a reverse-genetic approach, mutants of
the CCL39 tumour cell line (denoted wild type (wt)) were
geneti-cally engineered to abolish either glycolysis (gly
–cells) or
mitochon-drial respiration (res
–cells)
26–28and allowed to grow subcutaneously
in mice to a tumour volume of 400 mm
3. Mitochondrial
respira-tion describes metabolic processes occurring in the mitochondria
and requiring oxygen to convert the energy stored in nutrients to
adenosine triphosphate. Thus, the three tumours represented three
different energetic metabolic statuses: an exclusively anaerobic
metabolism (res
–), an exclusively aerobic metabolism (gly
–) and
both aerobic and anaerobic metabolism (WT), all else being equal in
their genetic background
26–28. Figure 3 and Supplementary Video 3
show fused PET–UUI volumes (Fig. 3a–c) and their associated
bivariate histograms (Fig. 3d–f
) of the voxel value distributions
along a metabolic axis (FDG: SUVs) and a vascular axis (power
Doppler signal intensity) of wt (n = 5), gly
–(n
= 3) and res
–(n
= 4)
tumours. PET–CT–UUI unambiguously separated tumour types
according to their metabolic and vascular profiles: compared with
the wt profile, purely glycolytic res
–tumours exhibited a high FDG
uptake with a low vessel density, while, in contrast, gly
–tumours
exhibited a low FDG uptake and a high vessel density.
Time-varying PET–UUI for cardiac applications. The capacity of
UUI to acquire images at high rates is particularly useful for
imag-ing organs in rapid motion, such as the rat heart, which typically
beats 300–400 times per minute. Figure 4 and the corresponding
Supplementary Video 4 show the PET–UUI acquisition of a beating
rat heart using a commercially available 12 MHz transducer probe,
used clinically for musculo-skeletal applications, connected to the
PET–CT–UUI motorized arm by way of a custom 3D-printed
adap-tor. The UUI B-mode acquisitions provided a cine-loop of the
posi-tion of the beating heart on which the PET maps of the FDG uptake
in the myocardium were precisely superimposed (Fig. 4a). This
hybrid image allowed for the accurate delineation of the cardiac
anatomy using UUI. Additionally, the UUI Doppler mode was used
to map large intramyocardial vessels (Fig. 4b), which is an indirect
marker of perfusion
29, and the shear-wave elastography mode was
used to quantify the myocardial stiffness during the entire cardiac
cycle (Fig. 4c), of which the diastolic value could become a potential
quantitative marker for viability
30,31.
Discussion
Ever since the end of the seventeenth century, when Sir Robert
Hooke and Antoni van Leeuwenhoek observed living cells under a
microscope, progress in imaging instrumentation has fostered our
understanding of the living world and escorted—and sometimes
driven—medical diagnosis and treatment follow-up. In contrast,
there is a strong trend in today’s biological research and medicine
to address the complexity and multidimensionality of living
sys-tems using high-throughput methods such as the omics
technolo-gies or multispectral fluorescence, while in vivo imaging struggles
to produce meaningful multi-parametric information. The
com-plexity and cost of non-invasive biomedical imaging instruments
and the limited number of quantitative imaging biomarkers that
can be derived from any one technique greatly limit the capacity of
Day 12 Day 14 Day 32 Day 25 Day 21 Day 18 mm3 Day 28 a UUI (a.u.) PET (SUV) 200 600 1.0 2.3 b 1.0 0.5 0 10 20 30 Volume (c m 3) Time (days) ** * *** ** **
Fig. 2 | Longitudinal PeT–uui imaging monitors the evolution of metabolism and vascularization during tumour growth in a mouse. a, Fused volumes of FDG uptake and perfused vessels of an Sdhb-deficient
allografted tumour at indicated times post-implantation in the fat pad of a nude mouse. The images of perfused vessels were obtained using the ultrafast Doppler technique without the use of contrast agents and are depicted using the respective colour scales shown for PET (SUV) and UUI (Doppler arbitrary units, a.u.). b, Volumes of the segmented
PET-avid region corresponding to the total tumour volume (black line) and segmented perfused vessel region (red line) plotted against time after tumour implantation. The graph shows individual, mean and s.d. values of independent measures in 4 to 7 animals, except on day 12, for which there was only one animal. Significant differences between the vascular and tumour volumes are indicated: *P < 0.05; **P < 0.01; ***P < 0.001.
imaging to produce multiplexed simultaneous analyses of living
individuals. A favoured approach is the development of hybrid
imag-ing instruments, such as PET–CT or PET–MRI, which in turn come
with increased complexity and cost. Therefore, it is tempting to call
on the relatively inexpensive and portable ultrasound technology
to bring more information to other imaging modalities. Moreover,
similar to PET–MRI, but not to PET–CT, image acquisition with
PET–UUI is simultaneous, allowing the near-perfect co-registration
that is necessary to establish a topographical relationship between
multiple imaging parameters, and the rate of acquisition of UUI is
fully compatible with the imaging of moving organs; for example,
the beating hearts of small rodents. From a medical perspective, the
main disadvantage of ultrasonography is the lack of full-body
imag-ing, but, in our view, this is largely compensated for by the exclusive
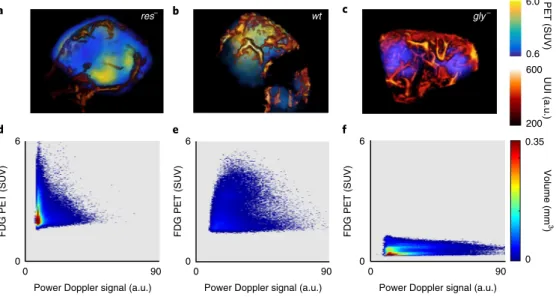
res– wt gly– a b c d e f UUI (a.u.) 200 0.35 0 600 PET (SUV ) 0.6 6.0 6 6 6 0 0 0 0 0 0 90 90 90
Power Doppler signal (a.u.) Power Doppler signal (a.u.) Power Doppler signal (a.u.)
FDG PET (SUV) FDG PET (SUV) FDG PET (SUV)
Volume (m
m
3
)
Fig. 3 | Phenotyping tumours in mice on the basis of bivariate, FDG–ultrafast-power-Doppler histograms. a–c, Fused images of FDG uptake and perfused
vessels in tumours grown subcutaneously in nude mice with three variants of the Ras-transformed CCL39 cell line. Left to right: a respiration-deficient mutant (res–; a), the WT CCL39 (wt; b) and a glycolysis-deficient mutant (gly–; c). d–f, Bivariate histograms corresponding to panels a–c depict the
relationship between the pixel-wise SUV and power Doppler signal proportional to glucose metabolism and blood volume, respectively. The heat map indicates the tumour volume characterized by each of the PET–UUI value pairs. Figure shows typical cases from triplicates for each mutant.
Heart cycle (%) 0 20 40 60 80 100 0 1 2 3 4 5 5 21 a b
End-diastole End-systole Mid-diastole
c
Ultrafast Doppler (a.u.)
LV RV 0.5 1.3 Stiffness (shear-wave speed; m s –1) PET (SUV)
Fig. 4 | PeT–CT–uui of the beating rat heart in a short-axis view. a, Selected time windows of a beating rat heart showing an overlay of the heart wall
and the metabolic activity of the myocardium in a short-axis view at end-diastole (left), end-systole (middle) and mid-diastole (right). Note the good agreement between the position of the metabolic signal in FDG PET and the myocardial wall depicted by the UUI B-mode images. Each image corresponds to the mean signal during one-eighth of a heart cycle. Shown are typical images of one animal from ten replicates. b, Ultrafast Doppler images of perfused
intramyocardial vessels—a potentially useful parameter in assessing myocardial perfusion. c, Myocardial shear-wave velocity—a quantitative biomarker
for myocardial stiffness—measured using shear-wave imaging in the region of interest indicated by the yellow rectangle in a as a function of time. The
increase in shear-wave velocity during systole is correlated with the increase in the stiffness of the myocardium. Data in b and c were obtained in one rat
in the region of interest shown in a. In c, the error bars correspond to the s.d. within the region of interest indicated by the yellow box in a. LV, left ventricle;
images obtained in the UUI modes that offer spatial and
tempo-ral resolutions unmatched by any other in vivo imaging technique
in equivalent fields of view. Moreover, recent ultrasound research
has tremendously enriched the capability of this modality to
pro-vide multiple independent physical parameters, such as blood flow
in small vessels
7,8, blood perfusion
32, mechanical properties such
as shear modulus and shear viscosity
16, muscle contractility
31, fibre
tractography
33and neurovascular brain activity
7. UUI is a genuine
multi-parametric technology ideally complemented by PET
molec-ular imaging. The limitations of UUI include limited tissue contrast
in anatomical imaging (B-mode), user-dependence and a lack of
four-dimensional imaging. The latter two limitations were partially
lifted in this study by the use of a motorized micropositioner and
are expected to be further addressed in the future by improvements
in matrix-array technology
21.
Here, we demonstrate the feasibility of co-registered and
simul-taneous PET-CT–UUI imaging in vivo. This hybrid imaging was
implemented without major hardware modifications of
commer-cial imaging instruments. PET and UUI images were automatically
fused without human input and with a precision in co-registration
much better than the spatial resolution of any PET system. The
presence of the ultrasound probe inside the PET gantry had a
mod-est impact on gamma ray attenuation with little visible effect on the
PET images. High-resolution UUI images were obtained in vivo in
rodents with a full range of UUI modes: B-mode for tissue anatomy,
ultrafast Doppler mode for microcirculation and shear-wave
imag-ing for tissue elasticity. All UUI images were fully co-registered with
images of FDG uptake in tissue. A simultaneous PET–CT–UUI
design has many practical and fundamental advantages, in contrast
with other hybrid imaging technologies for which the sequential
design is often easier to implement than the simultaneous one. For
example, in the cases of PET–CT and PET–MRI, both modalities
are non-contact and performed inside a gantry, which enables the
use of the same animal bed that can be inserted into one or the
other device. Moreover, in the case of PET–CT, the added modality
is often used to provide anatomical information, which is essentially
insensitive to the physiological state of the animal. In PET–CT–
UUI, neither of these advantages is present in a sequential system.
A UUI scan requires contact between the animal and a coupling
device, which leads to tissue non-rigid deformation that is difficult
to account for using sequential co-registration. Moreover, many
UUI modes are physiological rather than anatomical; for example,
ultrafast Doppler imaging maps the blood volume circulating in
perfused vessels, which is sensitive to the anaesthesia level and body
temperature. In a simultaneous design, this sensitivity is a benefit,
as it reflects the vasculature that transported the PET contrast agent
at a given time, while in a sequential design it would degrade
co-registration, leading to unacceptable uncertainty, for example, in the
bivariate histograms of Fig. 3. Similar arguments can also be made
regarding cardiac physiology, in which multiple parameters can
change between two sequential acquisitions, such as ejection
frac-tion, wall perfusion or heart rate. A simultaneous design is hence,
in many ways, more straightforward (simple affine co-registration
can be used), more accurate (physiology is consistent in both scans)
and saves experimental time (acquisitions are performed
concur-rently). A remarkable application of simultaneous PET–UUI would
be the measurement of transient or aperiodic signals that occur
outside a regular time frame. Examples of such applications include
mapping brain activity with both modalities, as has been done
using PET–MRI
5, or the co-measurement of time-dependent
car-diac perfusion using UUI and dynamic FDG uptake using PET. As
an example, the whole-brain spatiotemporal dynamics of epileptic
seizures can be uniquely assessed using the UUI modality due to its
very high sensitivity
7. Other examples include transient
ischaemic-reperfusion events in the intramyocardial vasculature, which is
accessible with UUI
34.
Here, the potential interest of combining exquisitely sensitive
molecular information with high-resolution anatomical and
physi-ological information was demonstrated in proof-of-concept studies
in oncology and cardiology. We show simultaneous 3D images of a
tumour’s metabolism together with its vascularization, as well as the
evolution of the relationship between metabolism and vasculature
during tumour growth across longitudinal PET–CT–UUI
acquisi-tions in the same animals. We also demonstrate that co-registered
measurements of both vasculature and metabolism stratify different
types of tumours on the basis of these two major hallmarks of
can-cer. Cancer cells can adapt their metabolism to the concentrations
of oxygen and glucose inside the tumour and can also direct the
formation of new blood vessels by triggering angiogenesis, which in
turn makes oxygen and glucose available
35,36. This implies the
exis-tence of tight links between the deregulation of energy metabolism
and the abnormal vasculature typical of tumour tissues, and creates
local heterogeneity inside tumours
35. In addition, a major
mecha-nism of evasion from anti-angiogenic treatment is the switch from
aerobic to anaerobic metabolism
37. It is therefore of great theoretical
and practical interest to determine—in vivo and non-invasively—
the metabolic and vascular profiles of tumours
1,2. It can be
envi-sioned that topographical analysis of these two hallmarks will yield
a combination of tumour biomarkers with potential impact for in
vivo cancer phenotyping, and help in the optimization of selective
co-targeting of mechanism-guided therapeutic combinations for
more effective and durable cancer therapies
2.
Co-registered images of the anatomy and myocardial stiffness
combined with images of local FDG uptake in the beating rodent
heart are a proof-of-concept of the potential of our PET–CT–UUI
system for cardiac imaging. The capability to follow the motion of
the heart in real time allows for a true delineation of the myocardial
FDG uptake based on the dynamic cardiac anatomy. Shear-wave
elastography and ultrafast Doppler imaging provide an approach to
explore myocardial viability in terms of myocardial stiffness
30,31and
perfused intramyocardial vessels. In the future, other UUI modes
for cardiac applications will be implemented to map perfusion
32,
the activation sequence of the heart
17, local deformations
38and even
cardiac muscle contractility
30,31. In conjunction with FDG uptake,
these parameters could become powerful biomarkers to assess
myo-cardial viability.
Whenever a new hybrid imaging instrument is introduced, it is
tempting to speculate on its innovating potential and its capacity
for breakthroughs. In its actual state, the pre-clinical PET–CT–UUI
prototype presented here can ideally explore the physiology and
pathophysiology of organs in rodents with high temporal and
spa-tial resolution. Imaging of the heart and tumours was shown here as
an example, but it is also possible to image other organs, such as the
liver, kidneys and brain, as we
39and others
35have shown in previous
reports using separate PET and UUI instruments. Regarding tumour
imaging, one of the applications of bivariate mapping of circulation
and metabolism is to explore metabolic symbiosis
37, which was
recently found to be responsible for evasion from anti-angiogenic
therapy
36, and a longitudinal exploration of the effect of sunitinib
on tumour microcirculation and metabolism is currently under way
in our laboratory. PET–CT–UUI is ideal to test the concerted action
on metabolism and vascularization of chemotherapeutic drugs and
drug candidates, or of their combinations, as well as the outcome of
radiotherapy or radiotherapy/chemotherapy combinations in
vari-ous animal models of cancer. Another straightforward application
would be to assist the development and validation of PET
radio-tracers and radiopharmaceuticals by monitoring the role of tumour
vascularization on their tissue uptake, with useful applications for
the compartmental modelling of dynamic PET data. From a
funda-mental perspective, the acquisition modes that we recently
devel-oped
8to resolve vessels down to a diameter of approximately 10
μ m
open perspectives for research in the exchanges between capillaries
and tissue
40. The near-perfect superimposition of image volumes
offers the attractive option to follow rapidly moving organs such as
the heart, and longitudinal studies of the metabolic, functional and
mechanical (that is, tissue elasticity) consequences of myocardial
ischaemia are under way.
In the same way as simultaneous PET–MRI, the first
implementa-tion of simultaneous PET–CT–UUI was developed in a pre-clinical
setup, but it can be adapted to yield a clinical instrument. We show
here that the integration of an ultrasound scanner in an existing
PET–CT was performed at relatively low cost and without any major
changes to the instrument’s hardware. The introduction of UUI
probes in the larger bores of clinical PET gantries is likely to be easier
than in the narrow pre-clinical ones. The interactions between the
511 keV gamma rays of the annihilation photons and the ultrasound
probe are limited, as was confirmed by the results shown herein and
by other studies
41. The wide availability of adapted probes can be
lev-eraged so that the same electronics can be used for both pre-clinical
and clinical studies. UUI modes are rapidly emerging and allowing
for exquisite images of the vasculature and unique measurements,
such as rapidly varying myocardial stiffness, which is appealing for
cardiac studies. In oncology, it is reasonable to envisage using PET
full-body images to define the image volume targets for UUI, but the
limited field of view of UUI is an important limitation, which would
be problematic during exploratory scans and for four-dimensional
imaging of moving organs. Nevertheless, solutions involving
motor-ized arms and matrix arrays can be envisioned with reasonable
addi-tional time and effort. The benefit of such co-registration would be
important as, at present, imaging volumes are acquired during
differ-ent exams, slowing the patidiffer-ent workflow, and in unmatched positions
of the patient’s organs, which, in many cases, such as in breast
imag-ing, condemns co-registration. As UUI is a modality for which
clini-cal applications are still in early phases of development, the specific
clinical applications for PET–CT–UUI remain naturally speculative
at this stage. However, they involve a large array of organs as UUI
can be applied to any organs accessible with conventional ultrasound
imaging. Typically, the deeper the organ is situated the lower the
ultrasound frequency used, and the lower the frequency the worse
the spatial resolution. In the worst case, the upper limit of resolution
is typically on the order of 500
μ m (corresponding to a 3 MHz centre
frequency), which is better than the inherent resolution of PET and
comparable to CT and MRI spatial resolutions. Reasonable scenarios
for tumour characterization will be to apply the biomarkers offered
by UUI, such as tissue stiffness and vascularization, for improved
personalized monitoring and treatment. Importantly, UUI-based
motion correction is likely to improve PET image resolution in
organs with limited motion, and to reduce acquisition times in the
heart by limiting the need for electrocardiogram
(ECG)-gating-based motion correction in standard cardiac PET scans.
Ultrasound technologies are also particularly well-suited for the
development of theranostic approaches, since ultrasound waves can
be used for both imaging and therapy in the form of histotripsy,
lithotripsy, high-intensity focused ultrasound and drug delivery, to
name a few. The synergy between PET and ultrasound could thus
extend towards the therapeutic field. Finally, it has not escaped our
attention that the synergy of the spatiotemporal co-registration
could also be used to overcome some of the current limitations
of PET technology (for example, ultrasound-based motion
cor-rection
41or correction of the biases in measuring arterial input
functions) and for the integration of UUI maps in dynamic PET
compartmental models. A potential benefit of simultaneous
acqui-sition is ultrasound-based motion correction to enhance the PET
reconstruction. Ultrasound is particularly apt for this task as it can
measure motion of a few micrometres, and high frame rates enable
better accuracy and precision
42,43. Motion correction of PET
imag-ing usimag-ing conventional ultrasound has been shown before
41and
UUI is expected to provide equal or better performances due to its
higher frame rates, as shown for other applications such as
localiza-tion microscopy
44, heart wall tracking and cardiac strains
45,46, as well
as ultrasound image formation
47.
In summary, the PET–CT–UUI system provides fully
co-reg-istered anatomical, functional and molecular imaging with high
spatial and temporal resolution in small animals. This technology
enriches the panoply of parameters that can be mapped
simultane-ously for the improved assessment of multivariate physiology and
complex diseases.
Methods
Design of the PET–CT–UUI hybrid imaging instrument. The PET–CT–UUI system was assembled by customizing two commercially available instruments—a clinical UUI device (Aixplorer; Supersonic Imagine) and a pre-clinical PET–CT system (nanoScan PET/CT; Mediso) (Supplementary Fig. 1). Two ultrasound transducers were used: a prototype transducer (15 MHz centre frequency; 128 elements; 100 μ m pitch) (Vermon) and a commercially available transducer (12 MHz centre frequency; 192 elements; 140 μ m pitch) (SuperLinear SLH20-6; Supersonic Imagine). Dedicated and customized ultrasound imaging sequences were implemented on the ultrasound scanner to perform UUI and PET–CT imaging simultaneously.
A six-degrees-of-freedom high-precision commercial motorized positioner with a 0.2 µ m minimum incremental motion (Hexapod H811; Physik Instrumente) was fixed upside down on a hanging bracket made from two aluminium construction rails (XT34; Thorlabs) attached to the PET bed. Ultrasound probes were attached to the motorized positioner by means of a 35-cm-long hollow carbon rectangular cuboid (Polyplan Composites). Elements for the adaptation of the different components were custom-designed and 3D printed (MP05825; MakerBot). This manual set-up allowed for the probe to be installed in an initial position located anywhere within the PET gantry before an acquisition. From this initial position, the motion range of the transducer inside the PET gantry was approximately 36 mm × 40 mm × 40 mm. The effect of the transducer's presence in the PET field-of-view on image quality was measured and the results are included in the Supplementary Materials (Supplementary Fig. 4 and the accompanying text). The main results indicate a modification to the estimate of the true radioactive concentration of 6.4 ± 2.3% (n = 3; Supplementary Fig. 4g) and small modifications to the noise, recovery coefficient and spill-over (Supplementary Fig. 4h–j). Spatial co-registration of the imaging volumes of the PET, CT and UUI modalities. No fiducial markers were used for the spatial co-registration of the three imaging modalities (PET, CT and UUI). Instead, the affine relationships linking the coordinates systems of the three imaging systems were determined by the following calibration procedure.
Co-registration between PET and CT. The nanoScan PET/CT device intrinsically
co-registers PET and CT volumes in a single coordinate system. To measure the accuracy of the PET–CT co-registration, the image quality mouse phantom (part number PH-60-00-42; Mediso), designed according to ref. 48, was filled with
10.6 MBq of (18F)FDG (Gluscan; Advanced Accelerator Applications) mixed with
200 µ l of Iopamidol (Iopamiron 300, 300 mg iodine ml–1; Bracco) and placed on the
PET–CT dedicated bed in the centre of the field of view. A CT scan was acquired in semi-circular mode at 50 kV using 720 projections, full scan, 300 ms per projection and a binning of 1:1. The CT was reconstructed using filtered back projection. List-mode PET data were collected for 10 min and binned using a 5 ns time window, a 400–600 keV energy window and a 1:5 coincidence mode. PET data were reconstructed using the Tera-Tomo reconstruction engine (3D-ordered subset expectation maximization (OSEM))-based manufactured customized algorithm; Mediso) with expectation maximization iterations, scatter and attenuation correction.
We measured the accuracy of PET–CT co-registration in the region corresponding to the smaller rod of the IQ phantom by taking profiles along two perpendicular directions of the transverse cross-section of the rod and fitting Gaussian curves to each profile. The spatial separation between the centroid of the Gaussian curves fitted to the PET and CT profiles was used as a metric to evaluate the accuracy of the PET–CT co-registration. This procedure was repeated for five evenly spaced positions taken along the axial length of the rod. As a result, the accuracy of the PET–CT co-registration was estimated at 0.049 + 0.007 mm.
Co-registration between the coordinates system of the motorized positioner and the UUI images. Precise co-registration between UUI and PET requires accurate
tracking of the ultrasound probe. The position of the ultrasound probe, and thus of the UUI 3D volume, was controlled with a sub-micrometre accuracy by a set of six variables referring to the positions of the six legs of the motorized micropositioner (Supplementary Fig. 2). The driver of the controller converted the position of the six legs into translational (X, Y and Z) and rotational (V, U and W) motions with respect to the centre of rotation representing the origin of the UUI images, O’, positioned by definition at the centre of the ultrasound
probe. The absolute position of O’ with respect to the centre of rotation of the Hexapod O was evaluated for co-registration of UUI and PET as follows. Phantom A consisted of a small water bath with six Gutta Percha points with a tip size of 150 μ m (ATO Zizine) pointing towards the ultrasound probe and immersed in water. These tips were visible in the UUI images and their local maxima were extracted as point sources with sub-resolution accuracy. For each rotational axis, three UUI volumes of the tips were then acquired at three different angles (that is, U = − 7,0,7, V = − 1,0,1 and W = − 3,0,3) while the two other rotation variables were set to zero, corresponding to a total of nine acquisitions. Hence, for any tip, the three positions acquired from the three volumes were on the same circle segment in positions defined exactly by the tilt angle of the transducer. Knowing the tilt angles, a simple trigonometric calculation determined the centre of rotation at the intersection of the three radii elevated from the common circle segment. Repeating this calculation for the U, V and W rotational axes then yielded the correct value of the centre of rotation, O’, adjusted from the initial estimate O’ini. The accuracy
and precision of the estimated centre of rotation were then evaluated by creating UUI volumes of the tips with different combinations of U, V and W values (that is, U = 5,0,− 5, V = − 0.4,0.4 and W = 1.4,0,− 1.4) and comparing the positions of the local maxima of the tips with predicted maxima positions. Repetition (n = 17) of the measurements yielded a mean error in the definition of the centre of rotation of 0.071 ± 0.029 mm.
Co-registration between PET–CT and UUI. The registration of PET–CT with
UUI was performed using a second phantom (phantom B) in a small water bath with three 80 μ m copper wires visible in the CT and UUI volumes (Supplementary Fig. 3a). Phantom B was positioned inside the PET–CT gantry and was successively imaged with CT and UUI. The UUI scan consisted of 80 steps in the X direction with a step size of 0.1 mm. The CT reconstructions (0.1162 mm × 0.1162 mm × 0.1162 mm voxel size) were interpolated to match the UUI signal voxel size (0.1 mm × 0.1 mm × 0.1 mm). The local maxima of the wires were then determined for both the CT and UUI images. These points were used to create a new set of images of density functions of the bivariate normal distribution around the local maxima (20 pixels variance). A total of 240 (3 × 80) local maxima corresponding to the wire centres were retrieved from the UUI volume. The co-registration process determined the rotation matrix R(0,0,0) and a translation vector
T(0,0,0) linking the positions of the centres of mass of the wires:
= +
PCT R(0,0,0) UUI(0,0,0)P T(0,0,0)
where PCT = {PCT1, PCT2, PCT3… PCT240} and PUUI,(0,0,0) = {PUUI1, PUUI2, PUUI3… PUUI240}
are the positions of the local maxima in the CT and UUI volumes, respectively. To determine R(0,0,0) and T(0,0,0), a 3D intensity-based automatic image registration
algorithm was applied to align with the local maxima of the UUI and CT volumes (Supplementary Fig. 3). This co-registration process was performed using the 'imregister' function of the Matlab software (Mathworks), which implements a one-plus-one evolutionary optimization process49 using a mutual information
metric50. In cases of scans including rotations of the ultrasound probe, an extra step
was performed. Specifically, since the centre of rotation was set at the origin of the UUI volume (section 2.1), the following relationship holds between the position of the images without rotation PUUI(0,0,0) and the position PUUI(U,V,W) of the images after
rotation of the ultrasound probe along the axes U, V and W: =
PUUI(U,V,W) R R R PW V U UUI(0,0,0)
Hence, we have
= + = +
PCT R(0,0,0) UUI(0,0,0)P T(0,0,0) R(0,0,0)(R R R ) PW V U TUUI(U,V,W) T(0,0,0)
And the generalized affine transformation is given by =
R(U,V,W) R(0,0,0)(R R R )W V UT
and
= .
T T(0,0,0)
The accuracy of the registration was measured by acquiring CT and UUI images of the wires at ten different positions and comparing the positions of the registered UUI image maxima with the positions of the CT signal maxima. Repetition (n = 20) of the measurements yielded a mean accuracy of the co-registration of 0.095 ± 0.028 mm.
Animal models. Animal experiments were approved by the Comité d’Ethique en Expérimentation Animale de l’Université Paris Descartes and registered by the French Ministry for Higher Education and Research under reference numbers 16-098 and 15-045 for mouse and rat experiments, respectively. All animals were housed in a conventional animal facility under a 12 h light and 12 h dark cycle and controlled temperature (24 °C) and humidity (50%). Animals were fed and watered ad libitum.
Sdhb-deficient tumour model. The generation of the Sdhb–/– cell line has been
described previously24. Briefly, Sdhb-floxed mice were generated at the Mouse
Clinical Institute (Illkrich, France). A targeting vector containing Sdhb exon 2 flanked by LoxP sites followed by a neomycin (neo) selection cassette flanked by Frt sites was introduced into P1 (129 S2/SvPas) embryonic stem cells by electroporation. Two positive embryonic stem clones were injected into C57BL/6J blastocysts and the resulting male chimeras gave germline transmission. These mice were mated to Flipase-expressing mice to delete the Neo cassette. Sdhb+/lox
mice were intercrossed to obtain Sdhblox/lox mice, and mouse chromaffin cells were
isolated from the adrenal medulla of these animals. Nine-week-old female NMRI nu/nu (Janvier Labs, France; n = 8) mice were housed at a constant temperature (23 °C) and relative humidity (60%) under a regular light/dark schedule. Food and water were available ad libitum. The tumour model was established as previously described25. Briefly, tumour fragments, originated from subcutaneous allografts
of immortalized mouse chromaffin cells carrying a homozygous knockout of the
Sdhb gene, were grafted in the dorsal fat pad of eight naïve female nude mice and
allowed to grow until the tumour diameter evaluated by caliper reached 5 mm, then imaged longitudinally over around 3 weeks, after which the animals were humanely euthanized. One mouse reached a tumour diameter > 5 mm on day 12 and was imaged at that time and thereafter (see Fig. 2). The same was the case for four mice on day 14 and thereafter, six mice on day 18 and thereafter and seven mice on days 21 and 25. However, on days 28 and 32, the radioactive decay of fluorine reduced the FDG concentration to a level too low for intravenous injection in the mice and only six mice were imaged on these dates (see Fig. 2).
CCL39 tumour model. The CCL39 cell line was derived from Cricetelus griseus
species obtained from the American Type Culture Collection. The respiration-deficient mutant (res−) and the glycolysis-deficient (gly−) mutant were generated
from WT CCL39 cells as described in refs 26–28. Briefly, CCL39-WT cells presented
with a Warburg type of metabolism (aerobic glycolysis) while the gly– cells were
deficient for glycolysis by knockout of the glucose-6-phosphate isomerase (E.C. 5.3.1.9) gene and the res− cells were respiration-deficient cells obtained by clonal
selection. All CCL39 cells were tested for mycoplasma contamination and found to be negative. Animals were randomly assigned to one of the three groups and ten million cells of WT, gly− or res− were implanted in the fat pad of eight-week-old
female nude mice (n = 4 per group; 12 in total) and allowed to grow to a volume of 500 mm3 before imaging was performed.
Rat model. Ten healthy female Wistar rats weighting approximately 100 g were
obtained from Janvier Labs.
Tumour imaging in mice. No blinding was applied to the experiments. Mice were fasted overnight before the imaging session. During all imaging procedures, mice were anaesthetized with 2.0 ± 1.0% isoflurane (IsoVet 100%; Centravet) in 100% O2. Before the acquisitions, mice were weighed, glycaemia was measured
in blood drawn from the ventral tail artery (mean of all exams: 170 mg dl–1) using
an Accu-Chek Aviva Nano A (Accu-Chek) and the tumour size was measured. A customized catheter with a 26 Ga needle (Fischer Scientific) connected to 5 cm polyethylene tubing (Tygon Microbore Tubing, 0.010 inch × 0.030 inch OD; Fisher Scientific) was inserted in the tail vein. The body temperature and respiration were monitored. The rectal temperature of the animals was monitored and maintained by controlled heating of the examination bed during the entire procedure.
The animals were positioned in the anaesthesia/imaging bed of the PET–CT scan. Degassed impedance matching gel (MédiGel Clear; Drexco Medical) was applied locally on the skin of the animal and a customized 3D-printed water bath was positioned over the region or organ of interest, affixed to the animal bed and maintained in position for all three scans (PET, CT and UUI). Hence, while the water bath was in contact with the degassed gel applied to the animal, the probe itself was never in contact with the window or the animal and probe motion did not incur any additional motion or deformation of the tissue. The bottom of the water bath was made of a 6-μ m-thick film of polyethylene terephthalate (ES301061; Goodfellow SARL) to minimize the interface effects between the water and the gel. Imaging was performed after the immersion of the ultrasound probe using the motorized micropositioner (Supplementary Fig. 1). This approach ensured free movement of the ultrasound probe while limiting the risk of creating air bubbles in the path of the ultrasound emissions. The animal bed was moved inside the PET gantry and the motorized positioner was programmed to acquire real-time ultrasound B-mode images to determine the region to image with UUI.
The UUI and PET acquisitions were performed simultaneously. The PET acquisition was set to start 30 s after injection of 10 MBq of (18F)FDG in 0.2 ml
saline into the tail vein of the mice. List-mode PET data were collected between 0 and 60.5 min post-injection and binned using a 5 ns time window, a 400–600 keV energy window and a 1:5 coincidence mode (that is, each detector’s lines of coincidence with the five opposite detectors). UUI volumes were acquired in 12.8 × 20 mm2 slices separated by 0.1 mm. The number of joint acquisition planes
(range: 70 to 200) was based on the size of the tumour. For each plane, 300 frames were obtained at a rate of 500 frames per second. Each frame was obtained by coherently compounding51 the images associated with 11 tilted plane waves
acquisitions were triggered during the respiratory pause of the animal. After the 60-min-long PET acquisition, the animal bed was moved out of the PET gantry and released from the bed. Anaesthesia was discontinued and the animal was allowed to recover on a heating pad.
PET data were reconstructed using the 3D-OSEM-based Tera-Tomo reconstruction engine with expectation maximization iterations and scatter and attenuation correction. Then, 18-frame dynamic images were reconstructed with the following time sequence: exclusion of the first 30 s, 4 frames of 30 s, 3 frames of 60 s, 5 frames of 120 s, 3 frames of 5 min and 3 frames of 10 min. Standard static images were formed using the last 10 min of the acquisition (that is, a summed image 50–60 min post FDG injection) using the same reconstruction parameters.
For the UUI reconstructions, each stack of 300 frames was processed to generate an ultrafast power Doppler52,53 volume representing the perfused
vascular anatomy, for which the amplitude is approximately proportional to the blood volume. Specifically, a spatiotemporal filter based on the singular value decomposition was applied to separate the tissue from the blood signal54 and
the power (that is, the square of the signal amplitude) was then integrated over the 300 frames, which corresponded to 600 ms (that is, approximately two heart cycles). The process was repeated for each slice and provided a 3D volume of the vasculature of the tumour with an anisotropic resolution of approximately 100 µ m × 100 µ m × 400 µ m.
The PET volume was segmented according to the method of ref. 55. Briefly, a
threshold corresponding to 30% of the SUV peak value was applied on the FDG signal of the tumour area to obtain a volume of interest representing the viable tumour tissue. After the UUI and PET volumes had been co-registered, this volume of interest was transformed into a binary mask and applied to the UUI volume yielding the UUI signal of the viable tumour area. Next, segmentation of the vessels larger than the ultrasound resolution was based on the power Doppler signal. The level of noise was estimated in regions containing ultrasound gel (and thus no vessels) and used to define a threshold equal to twice the noise value. Cardiac imaging in rats. Combined PET and UUI were performed during several cardiac heart cycles and gated according to the ECG of the animal. Rats were anaesthetized with 2.5% of isoflurane (IsoVet 100%; Centrevet) in 100% O2. Rats
were weighed, the fur on their chests was removed using depilatory cream and a 23 G catheter (Terumo) was installed in the tail vein. Before imaging, glycaemia was measured using an Accu-Chek Aviva Nano A (Accu-Chek) apparatus.
A custom 3D-printed rat holder was built and adapted to the rat anaesthesia/ holding bed of the PET–CT device (Supplementary Fig. 1c). Accounting for the space constraints due to the ultrasound probe used for cardiac imaging, in this geometry, the anaesthetized rat was positioned in a 60º Fowler’s position. To facilitate the acquisition of standard echocardiographic views, an octopus tissue stabilizer system (Medtronic) was repurposed as a probe holder, first in flexible mode to allow for view search, then in rigid mode once the desired view of the heart had been selected. After positioning, the probe was controlled remotely using the motorized micropositioner.
Rats were positioned on the customized bed and ECG monitoring electrodes were installed (Red Dot; 3M). The SLH20-6 probe was positioned on the rat chest to obtain a standard, parasternal short-axis view at the mid-level. A first CT was acquired (semi-circular mode; 37 kV; 720 projections full scan; 300 ms per projection; binning 1:4). A second CT scan was acquired with the same parameters and the ultrasound probe was positioned out of the PET–CT field of view. A 30 min gated cardiac acquisition was started 30 s after injection of 40 MBq (18F)FDG
(300 µ l in saline). During the first 30 min of the PET acquisition, ECG-triggered UUI B-mode imaging using 20 coherently compounded tilted plane waves (equally spaced between − 10 and + 10º; pulse repetition frequency of 16,000 Hz) was performed. Each high-quality B-mode image was thus obtained within 1.35 ms and able to track the fast motion of cardiac tissues and detect blood flow in the myocardial vessels. The cardiac shear-wave imaging31 mode was also used to
quantify the stiffness of the anterior wall. A 300 µ s pushing beam was focused in a region corresponding approximately to the mid-myocardium to generate a shear wave, after which 20 coherently compounded images combining 3 tilted plane waves with angles equally spaced between − 10 and 10º were acquired at 500 frames per second. Shear-wave imaging was performed at ten different time points of the heart cycle using ECG gating. A second PET dataset was collected in list mode between 50 and 60 min post-injection. Body temperature was maintained at 36–37 °C and the ECG was monitored and recorded during the entire procedure. After the PET acquisition, the animal bed was moved out of the PET gantry and the animal was released from the bed. Anaesthesia was discontinued and the animal was allowed to recover on a heating pad.
Both PET datasets were binned using a 5 ns time window, a 400–600 keV energy window and a 1:5 coincidence mode, and reconstructed using the 3D-OSEM-based Tera-Tomo reconstruction engine with expectation maximization iterations and scatter and attenuation correction. Eight-frame gated cardiac images were produced and temporally interpolated to the UUI frame rate and co-registered.
For the imaging of tumours, the probe was placed inside a water bath positioned over the tumour, and respiratory movements could not affect the accuracy of PET–CT–UUI co-registration. In contrast, for the imaging of the heart,
the probe was placed in the ultrasound gel layer covering the chest; therefore, the risk that respiratory movements could degrade the accuracy of PET–CT–UUI registration remained. To account for this, the position of the UUI image obtained through the calibration procedure was compared with the CT image of the transducer plate of the probe after it had been positioned in acquisition mode. Whenever the CT–UUI co-registration accuracy was affected, corrections of the co-registration matrix were applied based on the CT image.
To enhance UUI B-mode imaging, incoherent compounding based on the summation of B-mode intensity maps was also applied to a sliding window of ten frames. Ultrafast Doppler imaging of intramyocardial vessels was performed using a previously described methodology29 adapted to benefit from the use of
a spatiotemporal filter54. A spatiotemporal filter based on the truncated singular
value decomposition of the stack of 30 demodulated in-phase-quadrature ultrasound images (that is, 40.5 ms) was applied to separate the tissue from the blood signal12 with a threshold equal to 20. Images of blood vessels were then
obtained by computing the square of the signal amplitude within that 30-frame window. Shear-wave velocity was estimated using a previously described methodology31. Tissue motion was estimated using in-phase and quadrature
frame-to-frame cross-correlation. The tissue velocity associated with the shear-wave propagation was isolated by subtracting the average motion of the myocardium. The shear-wave velocity was estimated using a time-of-flight algorithm described in a previous study31. Inter-frame displacements were averaged in the thickness
of the myocardial wall and the time-of-flight was computed by detecting the maximum temporal correlation between pairs of pixels.
Since the PET volume was associated with a composite heart cycle duration, the duration of the heart cycle was determined in UUI and used to temporally interpolate both datasets to the same heart cycle duration.
Imaging parameters used in UUI. An important trade-off in UUI is the choice of the number of compounded tilted plane waves N, which is inversely proportional to the frame rate and linked to contrast and resolution. N is typically kept small (that is, ~10) to maintain high frame rates. When N is small, improvements in resolution with N are small in comparison to gains in contrast, which thus becomes the main limiting factor along with the frame rate when optimizing a sequence.
For Doppler imaging of small vessels in an organ undergoing a restricted range of motion, exceeding frame rates of 500 frames per second has a limited effect on the image quality. The frame rate (FR) depends on the known speed of sound, c, the imaging depth, d, the size of the probe, a, and the number of compounded plane waves, N, as follows: FR= √c +
N d a
2 (2 2). At a depth of view of 20 mm, this
technically enables N = 64. However, in practice, we observed that N = 11 provided comparable image quality while limiting the data flow to manageable values as demonstrated by ref. 52. Moreover, with such a limited number of tilted plane
waves, the gain in the ultrasonic image using plane-wave compounding has been shown to typically perform up to 30 times better in terms of sensitivity and three times better in terms of signal-to-noise ratio (SNR) than conventional ultrasound imaging53. In other words, due to the small imaging depth, a high image quality
was comfortably achieved in a static organ. Hence, in tumours, the main limiting factors were the physiological parameters and, to limit the difficulties inherent to large motion ranges, acquisitions were performed during the respiratory pause, which enables 300 frames and 600-ms-long integration windows for Doppler processing. Assuming a respiratory rate of 1 Hz in anaesthetized mice, an entire image volume consisting of 200 slices required a (strict) minimum of 200 s. In practice, to account for the motion of the micropositioner and data processing, acquisitions typically lasted 15 to 20 min.
In the heart where a large motion range is inevitable, sequences were heuristically optimized depending on the mode used (B-mode, Doppler or shear-wave imaging). These optimizations were typically associated with higher frame rates and a smaller number of compounded plane waves, but also depended on the cardiac image quality, possibly altered by the shadowing and clutter caused by the rib cage.
Statistical analysis. Due to the exploratory nature of this study, the sample size used was not chosen to detect a pre-specified effect size. In rare cases, unexpected vibrations of the building degraded the quality of the power Doppler image. In these cases, the data were excluded from the analysis (note that the consequences of building vibrations have now been eliminated by improving the experimental setup). No blinding was applied. Randomization was used for mice xenografts of the CCL39 cell lines. The data used met the assumptions of the Wilcoxon signed rank test, which are independence (different animals), dependent samples (evolution of parameters in individual animals) and a continuous dependent variable (linked to growth). In the longitudinal mouse tumour study, a paired Student's t-test was used to compare the means of the tumour and vessel volumes determined separately for each animal at individual time points.
Life Sciences Reporting Summary. Further information on experimental design is available in the Life Sciences Reporting Summary.
Code availability. The co-registration process described in the section 'Co-registration between PET–CT and UUI' was performed using the 'imregister'