HAL Id: hal-02883737
https://hal-amu.archives-ouvertes.fr/hal-02883737
Submitted on 29 Jun 2020
HAL is a multi-disciplinary open access
archive for the deposit and dissemination of
sci-entific research documents, whether they are
pub-lished or not. The documents may come from
teaching and research institutions in France or
abroad, or from public or private research centers.
L’archive ouverte pluridisciplinaire HAL, est
destinée au dépôt et à la diffusion de documents
scientifiques de niveau recherche, publiés ou non,
émanant des établissements d’enseignement et de
recherche français ou étrangers, des laboratoires
publics ou privés.
Detection of glyceraldehyde and glycerol in VUV
processed interstellar ice analogues containing
formaldehyde: a general formation route for sugars and
polyols
Y Layssac, A. Gutiérrez-Quintanilla, T. Chiavassa, Fabrice Duvernay
To cite this version:
Y Layssac, A. Gutiérrez-Quintanilla, T. Chiavassa, Fabrice Duvernay. Detection of glyceraldehyde
and glycerol in VUV processed interstellar ice analogues containing formaldehyde: a general
for-mation route for sugars and polyols. Monthly Notices of the Royal Astronomical Society, Oxford
University Press (OUP): Policy P - Oxford Open Option A, 2020, 496 (4), pp.2592-5307.
�10.1093/mn-ras/staa1875�. �hal-02883737�
Detection
of glyceraldehyde and glycerol in VUV processed
interstellar
ice analogues containing formaldehyde: a general
formation
route for sugars and polyols
Y. Layssac,
1
?
A. Gutiérrez-Quintanilla,
1
T. Chiavassa
1
and F. Duvernay
1
†
1Aix-Marseille Université, Laboratoire PIIM, Team ASTRO, Service 252, Saint Jérôme,
Ave. Escadrille Normandie Niemen, 13013 Marseille,Franc
ABSTRACT
Complex organic molecules (COMs) have been identified toward high -and low- mass pro-tostars as well as molecular clouds. Among them sugar-like and polyol two carbon-bearing molecules such as glycolaldehyde and ethylene glycol are of special interest. Recent laboratory experiments have shown that they can efficiently be formed via atom addition reactions be-tween accreting H-atoms and CO molecules or via energetic processes (UV, electrons) on ice analogues containing methanol or formaldehyde. In this study we report new laboratory ex-periments on the low temperature solid state formation of complex organic molecules -the first sugar glyceraldehyde and its saturated derivative glycerol- through VUV photolysis performed at three different temperatures (15, 50 and 90 K) of astrochemically relevant ices composed of water and formaldehyde. We get evidence that the species production depends on the ice temperature during photolysis. The results presented here indicate that a general scheme of aldose and polyol formation is plausible and that heavier COMs than GA and EG could exist in interstellar environments. We propose a general pathway involving radical-formaldehyde reactions as common initiation step for aldose and polyol formation. Future telescope obser-vations may give additional clues on their presence in star forming regions as obserobser-vations are currently limited because of the detection thresholds.
Key words: Astrochemistry – methods: laboratory: solid state – techniques: spectroscopic –
ISM: evolution
et al. 2015). Among these COMs, a special interest is given to glycolaldehyde (hereafter GA) and ethylene glycol (hereafter EG) the simplest polyol, which are among the largest detected COMs in the ISM.
GA and EG were observed in the IRAS 16293-2422 (Jørgensen et al. 2012) and NGC 1333-IRAS2A protostars (Coutens et al. 2015) for example. They were also detected in our Solar System, in the 67P comet (Goesmann et al. 2015;Meringer et al. 2018). It is thought that GA and EG are perfect precursors for the formation of glyceraldehyde (GCA) - the first sugar - and its saturated polyol derivative, glycerol (GCO) (Zhu et al. 2020;Kaiser et al. 2015;
Fedoseev et al. 2017). Although they have not yet been observed in the ISM, clues of their presence have been found in meteorites. Indeed, a rich spectrum of polyols, including glycerol have been detected in carbonaceous chondrites (Cooper et al. 2001;Cooper & Rios 2016). Considering that cometary material may have an interstellar origin, this makes glycerol and glyceraldehyde species of astrochemical interest.
Additionally to observational studies, laboratory experiments on interstellar ice analogues submitted to UV light, H-atom flux and ionizing radiations have been performed in order to understand
1 INTRODUCTION
To date, more than 200 molecules ranging from molecular hydrogen up to fullerenes have been detected in circumstellar and interstellar environments. About sixty of them are the so called complex organic molecules (hereafter COMs) usually defined by t he astronomical community as carbon-bearing organics comprised of six or more atoms. They have been unambiguously identified in a large variety of objects and environments: in dark clouds and pre-stellar cores (Marcelino et al. 2007; Öberg et al. 2010; Bacmann et al. 2012;
Cernicharo et al. 2012; Vastel et al. 2014; Jiménez-Serra et al. 2016), in photon-dominated regions (Guzmán et al. 2014), in hot cores and giant molecular clouds (Hollis et al. 2000; Martín-Pintado et al. 2001; Requena-Torres et al. 2008; Belloche et al. 2013), in low and high mass protostar environments (Blake et al. 1987; Caselli & Ceccarelli 2012; Neill et al. 2014; Tercero et al. 2015; Coutens et al. 2015; Taquet et al. 2015; Jørgensen et al. 2016; Rivilla et al. 2016), as well as in molecular outflows (Arce et al. 2008; Codella
? E-mail: yohann.layssac@univ-amu.fr † E-mail: fabrice.duvernay@univ-amu.fr
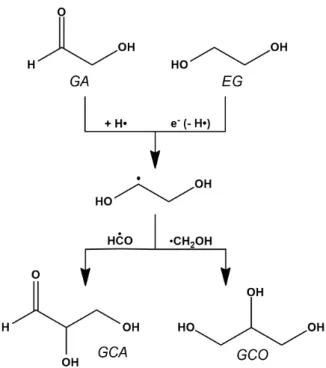
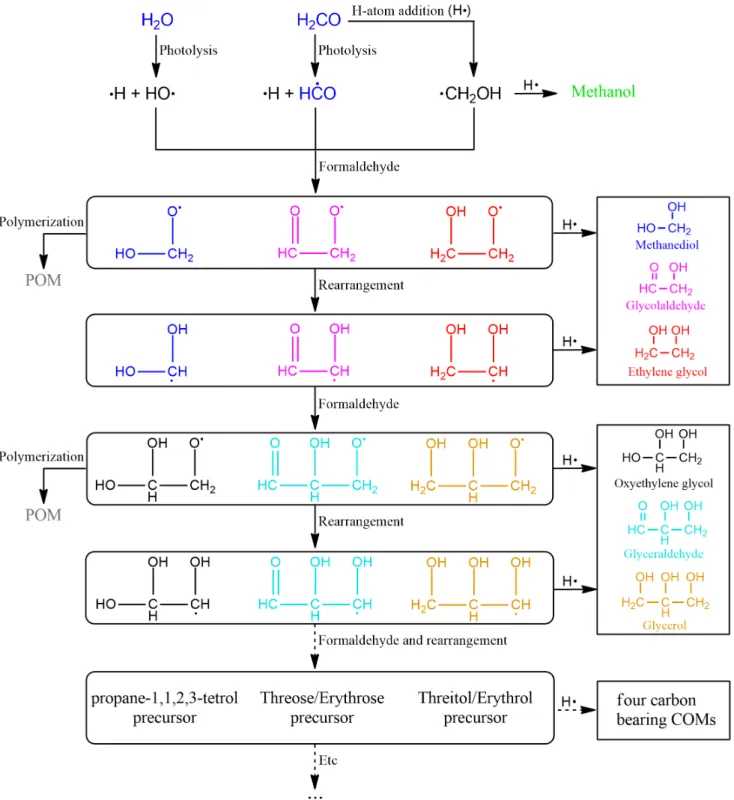
Figure 1.GCA and GCO formation pathways adapted from (Fedoseev et al.
2017) (formation of GCA and GCO from GA hydrogenation) and (Kaiser
et al. 2015) and (Zhu et al. 2020) (formation of GCO from EG and energetic
electrons).
COM formation such as glycolaldehyde, sugars and polyols un-der astrophysical conditions (Zhu et al. 2020;Kaiser et al. 2015;
Fedoseev et al. 2017).
Recent laboratory experiments demonstrate that complex molecules such as GA, EG and GCO are efficiently formed via H-atom addition on interstellar ice analogues containing CO and CO:GA (Fedoseev et al. 2017;Chuang et al. 2016). The proposed formation pathway passes through radical-radical recombinations which produce successfully, from GA, both the GCA and GCO molecules (Fig.1, left side, adapted fromFedoseev et al.(2017)). In this mechanism, GA is necessary to produce the two carbon bear-ing radical by H addition at 13 K. Then, the three carbon bearbear-ing molecules (hereafter C3COMs) -GCO and GCA- can be obtained by recombination with HCO and CH2OH respectively.
Polyols such as EG and GCO can also be formed from pure methanol ices exposed to ionizing radiation (Kaiser et al. 2015;Zhu et al. 2020). COMs including polyols were analysed by PI-ReToF (Kaiser et al. 2015) and by two-dimensional gas chromatography coupled to time-of-flight mass spectrometry (GC X GC-TOFMS,
Zhu et al.(2020)). The authors of these studies proposed a forma-tion mechanism based on H-atom abstracforma-tion and radical-radical recombination (Fig.1, right side, adapted fromKaiser et al.(2015) andZhu et al.(2020)). In this mechanism, EG (previously formed from the recombination of two CH2OH radicals) is necessary to produce the two carbon bearing radical by H-abstraction which is able to give GCO by direct barrierless recombination with another CH2OH radicalKaiser et al.(2015);Zhu et al.(2020).
In this paper, new experimental results about GCA and GCO formation in astrochemically relevant conditions are presented. We focus on formaldehyde as precursor for GCA and GCO formation as it is a simple and abundant molecule in interstellar ices (Chiar et al. 2000;Gibb et al. 2004;Boogert et al. 2008) and because it has an excellent efficiency in producing GA and EG (Bennett & Kaiser
2007;Fedoseev et al. 2015;Butscher et al. 2015,2016;Chuang et al. 2016) which are supposed to be good precursors for GCA and GCO formation. In addition, it is the key molecule in the formose reaction which is known to produce a great diversity of sugar (Zweckmair et al. 2014). Even if in the case of interstellar conditions, this reaction is unlikely, it seems that formaldehyde is able to produce sugars in these conditions in a selective way (Meinert et al. 2016). We want to investigate in more details the chemistry that formaldehyde can offer in the interstellar medium, trying to draw a general formose-like reaction scheme for sugar and related compound formation in such environments. For the time being, astronomical observations of sugar-like species and polyols are limited to the detection of two carbons bearing molecules, we are therefore trying to push further the study of formaldehyde chemistry in order to foresee what level of complexity can be achieved in the ISM.
InButscher et al.(2016), we already showed that EG and GA are efficiently formed from the 13 K VUV photolysis of H2O/H2CO ices whereas in pure formaldehyde ices polyoxomethylene (POM, the formaldehyde polymer) is efficiently produced. In this contribu-tion, we get new results with 15 K VUV photolysis conditions and we also perform irradiations at higher temperatures (50 and 90 K) to obtain clues on reaction mechanisms. Significant changes regard-ing the newly formed species as well as their relative abundances are observed. After an experimental part (section 2), we describe our infrared and mass spectrometry results and we compare them to each other in a discussion section where formation mechanisms are also discussed. Astrophysical implications are considered before conclusion.
2 EXPERIMENTAL
Formaldehyde 12C and 13C were purchased as a polymer
(paraformaldehyde) from Sigma Aldrich (99% purity) and heated under vacuum up to 90◦C to produce the gas-phase monomer. Gly-colaldehyde (GA) was purchased as a dimer from Sigma Aldrich (99.95% purity) and was heated under vacuum up to 80◦C to obtain the gas-phase monomer. Water, ethylene glycol (EG) and methanol (Aldrich, all three ≥ 99.9% purity) were doubly distilled under vac-uum before injection. Glyceraldehyde (GCA) and glycerol (GCO) were purchased from Sigma Aldrich (90 and 99% purity respec-tively). Gaseous samples are prepared in a mixing line (primary vacuum) at room temperature. They are then deposited onto a 15 K cooled 1 cm2 copper surface at a rate of 0.4 mmol s−1 corre-sponding to a pressure within the vacuum chamber of 2 × 10⁻⁶ mbar. MeOH, GA, EG, GCA and GCO solid films were prepared by directly dosing them onto the sample holder in order to get spectroscopic references. The polyoxymethylene (POM) solid film used in this study as spectroscopic reference is obtained from the VUV photolysis at 13 K of pure H2CO ice (Butscher et al. 2016;
Gerakines et al. 1996).
The copper sample holder is placed in a chamber, under high vacuum conditions (from 10−8mbar at room temperature to 10−9 mbar at 15 K). The system temperature is controlled by means of an ARS Cryo 4 K cold head combined with a resistive heater and a Lakeshore 336 temperature controller. Temperature changes are performed with a 2 K min−1ramp.
The VUV photolysis step is performed at 15, 50 or 90 K to change diffusion and reaction conditions within the ices. The three different temperatures of irradiation (15, 50 and 90 K) are sep-arated in three distinct experiments (hereafter exp. 1, exp. 2 and exp. 3 respectively). Also, all these experiments were repeated
us-ing 13C formaldehyde. The VUV photons are generated from a microwave-discharged hydrogen-flow lamp T-type (MDHL T-type) with a running H2pressure around 0.25 mbar. T-type MDLH and low H2 pressure increase the proportion of Lyman-α emission at 121.6 nm and can significantly decrease the contribution of molec-ular hydrogen emission around 160 nm (Chen et al. 2013).
The emitted flux from the plasma is transmitted through a MgF2 window and was measured to be 4.1 ± 0.9 × 10¹³photons cm−2s−1using the known H
2CO photodissociation cross section. This flux is about 1010times higher than the UV secondary radiation flux observed in dense molecular clouds and represents about 106 years of radiation per hour of laboratory experiment in such an environment.
The chemical composition of our ice analogues is analysed by infrared spectroscopy, using a Bruker Vertex 70 Fourier transform infrared (FTIR) spectrometer with a MCT detector in the reflection-absorption mode. There is an angle of 18◦between the normal of the sample holder and the infrared beam. Resolution of the spectra is set at 1 cm−1and each spectrum is averaged over 40 scans. 100 scans are recorded for the background with the same resolution.
Column densities (N) in molec cm−2 are measured using
(N) = ∫ν2 ν1 2.3Abs(ν) dν 2 cos(18)A , where ∫ ν2 ν1
Abs(ν) dν is the integrated
ple holder so that pumping losses are minimized. Infrared spectra are recorded every 10 K during the TPD processes so that we can monitor samples by IR spectroscopy.
3 RESULTS
3.1 Infrared qualitative study
3.1.1 Overview
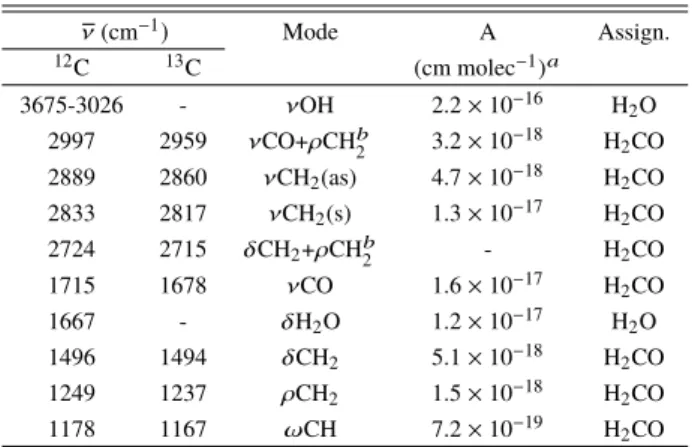
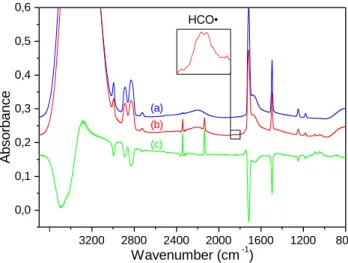
The mid-IR spectrum of the deposited H2O/H2CO = 3/1 ice at 15 K is shown in Fig.2b. The infrared spectrum is dominated by strong OH stretching mode of water and C=O stretching mode of formaldehyde located at around 3400 and 1715 cm−1, respectively. All infrared band positions as well as their corresponding vibra-tional assignments for H2O/H122 CO and H2O/H132 CO ices are listed in Table1. The samples are then irradiated at three different temper-atures: 15 (exp. 1), 50 (exp. 2) and 90 K (exp. 3). Exp. 1 is directly irradiated after deposition during 170 min. For the two other exper-iments, ices are first heated to 50 or 90 K at a 2 K min−1rate before being irradiated during 80 and 40 min respectively. Irradiation times have been chosen so that 30 ± 1% of the deposited formaldehyde is consumed. Since the products are mainly the same in the three experiments, only the 15 K irradiated one is presented here whereas exp. 2 and exp. 3 spectra can be found in appendix (Fig.A1and
A2). The infrared spectrum of exp. 1 is depicted in Fig.2a where it is compared with the spectrum recorded before irradiation (Fig.
2b). Table2compiles the assignments of the newly formed species in both12C and13C experiments. The most striking features ob-served after irradiation located at 2342 and 2136 cm−1are easily assigned to CO2and CO respectively (Gerakines et al. 1996) (Table
2, Fig.2). The formyl radical is also detected through its absorption band at 1846 cm−1 in 12C and at 1804 cm−1 in 13C experiment (Milligan & Jacox 1969;Gerakines et al. 1996;Watanabe et al. 2007). In addition to the decomposition of precursors, small bands are also detected in the C=O stretching region around 1700 cm−1 but are obscured by the precursor H2CO making this region difficult for spectroscopic sugar identification. However, several absorption bands are observed in the range 1200-900 cm−1corresponding to C-O stretching region where sugars and polyols are expected (Fig.
2). This region of interest deserve special attention since bands are very broad and complex suggesting several molecular carriers. Therefore, a deconvolution of the infrared absorption features in the range 1200-900 cm−1has been performed and will be presented in the following section.
3.1.2 Sugar and related compound region
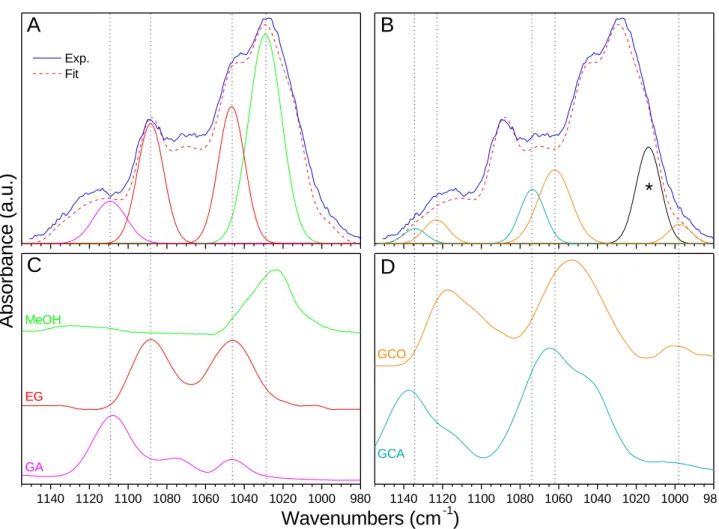
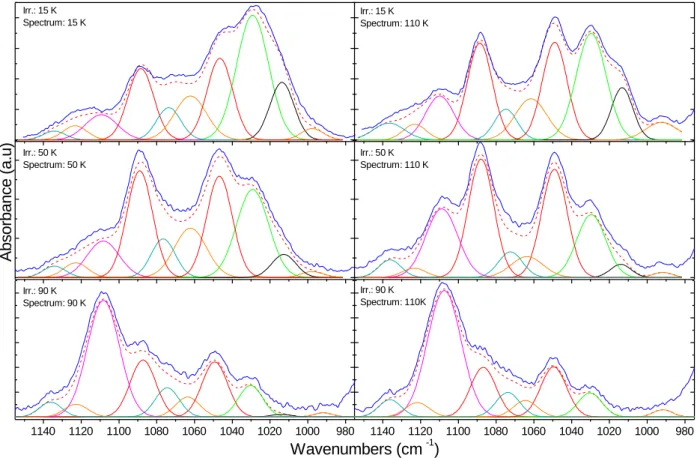
Fig.3shows a mathematical deconvolution of the COM region us-ing ten Gaussians. The number and positions have been set usus-ing infrared contributions from reference spectra of species of inter-est. Four of these Gaussians belong to methanol, glycolaldehyde and ethylene glycol, three COMs which have been formed in pre-vious experiments (Butscher et al. 2016). Five belong to the three carbon bearing products, glyceraldehyde and glycerol suspected to be formed. An additional Gaussian was necessary to reproduce the experimental spectrum. In other words, we have considered the main infrared bands from the suspected products. The choice of these products (MeOH, GA, EG, GCA and GCO) is also sup-ported by mass spectrometry analyses and isotopic experiments (see "Mass spectrometry qualitative study" section). The main absorp-tion features are: MeOH (green curve, 1029 cm−1), GA (purple, absorbance (cm−1) of an infrared band whose boundaries are ν
1 and ν2 and A is the intrinsic band strength (cm molec−1). The amount of formaldehyde is obtained from the band at 1499 cm−1 (A = 5.1 × 10⁻¹⁸ cm molec−1, Bouilloud et al. (2015)). The amount of HCO is obtained from the band at 1848 cm−1 (A = 1.5 × 10⁻¹⁷ cm molec−1, Bennett & Kaiser (2007)). The amount of methanol is obtained from the band at 1029 cm−1 (A = 1.5 × 10⁻¹⁷ cm molec−1,
Kerkhof et al. (1999)). The amount of ethylene glycol is obtained from the two bands at 1088 and 1047 cm−1 (A = 3.9 × 10⁻¹⁸ cm molec−1 each, Hudson et al. (2005)). The amount of glycolalde-hyde is obtained from the band at 752 cm−1 (A = 2.0 × 10⁻¹⁸ cm molec−1, Hudson et al. (2005)). This specific band can be used from a pure GA spectrum after fitting the C=O and C-O GA bands of the experimental spectrum. It allows more precise measurement on GA quantification. Finally, the amount of POM is obtained from the band at 1109 cm−1 (A = 9.7 × 10⁻¹⁸ cm carbon−1, Schutte et al. (1993)). It is considered that experimental errors from band strength values are within 20% (Bouilloud et al. 2015).
After irradiation at 15 (exp. 1), 50 (exp. 2) or 90 K (exp. 3), the samples are first h eated t o 1 10 K ( 2 K m in−1) t o s tudy the effect of warming on the irradiated samples. We choose this spe-cific t emperature s ince i t i s b elow t he d esorption t emperature of COMs and formaldehyde which allows us to compare the COM abundances in different experiments without being affected by des-orption processes. Samples are then heated to 160 K (around the water desorption temperature) at a rate of 2 K min−1 and are let at this temperature for 16 h in order to let water molecules to desorb in a gentle way. This step is mandatory to avoid intense COM co-desorption with water during the Thermal Programmed Desorption (TPD). Nevertheless, during this process some organics are still lost along with water desorption but in less quantity than performing a continue TPD without stopping at 160 K. The TPD is then con-tinued from 160 to 300 K at the same rate set before. However, the different co-desorption processes (COMs with water and COMs with themselves) make impossible to use mass spectrometry in a quantitative way. The desorbing molecules are analysed using a Hi-den analytical HAL 201 quadrupole mass spectrometer (QMS) with a 70 eV electron impact source. The source is placed near the
sam-Table 1. Infrared absorption band positions (cm−1) and assignments of H2CO in water at 15 K. ν (cm−1) Mode A Assign. 12C 13C (cm molec−1)a 3675-3026 - νOH 2.2 × 10⁻¹⁶ H2O 2997 2959 νCO+ρCHb 2 3.2 × 10⁻¹⁸ H2CO 2889 2860 νCH2(as) 4.7 × 10⁻¹⁸ H2CO 2833 2817 νCH2(s) 1.3 × 10⁻¹⁷ H2CO 2724 2715 δCH2+ρCHb 2 - H2CO 1715 1678 νCO 1.6 × 10⁻¹⁷ H2CO 1667 - δH2O 1.2 × 10⁻¹⁷ H2O 1496 1494 δCH2 5.1 × 10⁻¹⁸ H2CO 1249 1237 ρCH2 1.5 × 10⁻¹⁸ H2CO 1178 1167 ωCH 7.2 × 10⁻¹⁹ H2CO
Notes. ν: stretching; δ: bending; ρ: rocking; ω: wagging; s: symetric; as: antisymetric.(a)Bouilloud et al.(2015).(b)Harvey & Ogilvie(1962). Band strength errors are generally considered to be about 20% (Bouilloud et al.
2015). 3 6 0 0 3 2 0 0 2 8 0 0 2 4 0 0 2 0 0 0 2 0 0 8 0 0 0 , 0 0 , 2 0 , 4 0 , 6 0 , 8 1 , 0 ( c ) ( b ) C O M s H C O • C O A b s o rb a n c e W a v e n u m b e r ( c m - 1) C O 2 ( a )
Figure 2.Infrared spectra of an H2O/H2CO = 3/1 ice at 15 K before
irradi-ation (b), after 170 min of VUV photolysis (a) and difference specrum ((c) = (a) - (b)). Green spectrum has been multiplied by a factor of two.
1109 cm−1), EG (red, 1047 and 1088 cm−1), GCA (cyan, 1134 and 1074 cm−1), GCO (orange, 1124, 1062 and 998 cm−1). Reference spectra are depicted in Fig.3panels C and D where they can easily be compared with their corresponding Gaussian curves. All these Gaussian curves after fitting process are in good agreement with their corresponding absorption bands on the reference spectra as they are only shifted by few wavenumbers (less than 10 cm−1). For clarity reasons, COMs are split in two categories in Fig.3. C1and C2COMs (MeOH, GA and EG) are displayed in panel A (Gaussian curves) and C (reference spectra) while C3COMs (GCA and GCO) are depicted in panel B (Gaussian curves) and D (reference spectra). We chose to use only one Gaussian curve for GA (the more intense at 1109 cm−1) as its two other bands (1075 and 1046 cm−1) tend to disappear when the GA molecule environment changes as Fig.A3
in appendix section shows it. The Gaussian curve at 1014 cm−1in 12C experiments (985 cm−1in13C experiment) labelled with a star is not yet attributed.
We also "fitted" the experimental infrared spectrum recorded
Table 2.Infrared absorption band positions (cm−1) and assignments of
formed species.
ν (cm−1) Mode A Assign. ref. 12C 13C (cm molec−1) 2342 2275 νC=O 7.1 × 10⁻¹⁷ CO2 a 2136 2088 νC≡O 1.7 × 10⁻¹⁷ CO b 1848 1810 νC=O 1.5 × 10⁻¹⁷ HCO c 1745 1721 νC=O 2.6 × 10⁻¹⁷ GAk d 1134 1117i νC-O ? GCA f 1124i 1104i νC-O ? GCO f 1109 1092i νC-O 8.1 × 10⁻¹⁸ GA d 1109 1089 νC-O *9.7 × 10⁻¹⁸ POM g 1088 1065 νC-O 3.9 × 10⁻¹⁸ EG d 1074i 1049i νC-O ? GCA f 1062i 1038i νC-O ? GCO f 1047 1024i νC-O 3.9 × 10⁻¹⁸ EG d 1029 1005 νC-O 1.5 × 10⁻¹⁷ CH3OH e 1014i 985i νC-O ? ? f 998 974 νC-O ? GCO f 936j 916j νC-O *3.0 × 10⁻¹⁷ POM g 915j 887j νC-O *3.0 × 10⁻¹⁷ POM g 888j 878j ρCH2 ? EG h 867j ? ρCH2 ? EG h
Notes. ν: stretching. ρ: rocking.(∗)These values are in cm carbon−1, see
Schutte et al.(1993).(a)Gerakines et al.(1996).(b)Hudson & Moore(1999).
(c)Bennett & Kaiser (2007).(d)Hudson et al. (2005). (e)Kerkhof et al.
(1999).( f )This work.(g)Schutte et al.(1993), band strengths are displayed in cm carbon−1.(h)Buckley & Giguère(1967).(i)These bands are not directly observable on the spectrum of the H2O/H2CO irradiated sample so they are determined using a Gaussian fitting. All band positions for13C were determined using a deconvolution with Gaussian curves shown in appendix (Fig.A9).( j )These bands are only detected after water desorption at 160 K. (k )Minor contribution of C=O stretching mode of GCA can also contribute to this feature. Band strength errors are generally considered to be about 20% (Bouilloud et al. 2015).
after irradiation using another technique we previously successfully used (Butscher et al. 2015). Basically, we reconstruct in the C-O stretching region (COM region) the experimental spectrum with a linear combination of our infrared reference spectra of observed
products MeOH, EG, GA, GCA, GCO and POM (Fig.4). Fig.4
shows all reference spectra of MeOH, EG, GA, GCA, GCO and POM together with the experimental spectrum of a 15 K VUV photolysed ice and the reconstructed infrared spectrum. It is impor-tant to note that no mathematical fit has been used here. We first manually adjust intensities of MeOH, GA and EG (and POM for high irradiation temperatures) as we know they are formed in such experiments (Butscher et al. 2016). Constraints on GA and POM quantities can be made using other available bands. We used the band at 1751 cm−1to adjust the GA spectrum intensity (see "exper-imental" section for details). POM quantification is also possible by IR spectroscopy with its characteristic bands at 915 and 936 cm−1, observable after desorption of water (see Fig.A4in appendix sec-tion). We then add GCO and GCA in small quantities to reproduce as well as possible the experimental spectrum. Caution has to be taken because the six reference spectra depicted here were recorded using pure species, which is not the case in the experiments (complex mixture). Also, absolute species quantities are different between reference and experimental spectra. Spectrum appearance depends
1 1 4 0 1 1 2 0 1 1 0 0 1 0 8 0 1 0 6 0 1 0 4 0 1 0 2 0 1 0 0 0 9 8 0 1 1 4 0 1 1 2 0 1 1 0 0 1 0 8 0 1 0 6 0 1 0 4 0 1 0 2 0 1 0 0 0 9 8 0 E x p . F i t M e O H E G G A G C O G C A
A
b
s
o
rb
a
n
c
e
(a
.u
.)
W
a v e n u m b e r s ( c m
- 1)
A
C
B
D
*
Figure 3.Infrared spectrum of a 15 K VUV irradiated H2O/H2CO = 3/1 ice recorded at 15 K (solid blue curve) compared to a deconvoluted infrared spectrum
(dashed red curve) composed of 10 Gaussian curves. Panel A: Gaussian curves corresponding to C1and C2COMs: GA, EG and MeOH. Panel B: Gaussian curves corresponding to C3COMs: GCA and GCO. The Gaussian curve labelled with a star is not attributed. Panel C: Infrared reference spectra of MeOH, EG and GA recorded at 15 K. Panel D: Infrared reference spectra of GCO and GCA recorded at 90 K.
1 1 1 1 2 0 1 1 0 0 1 0 8 0 1 0 6 0 1 0 4 0 1 0 2 0 1 0 0 0 9 8 0
Figure 4.(a) Infrared spectrum of a 170 min VUV irradiated H2O/H2CO =
3/1 ice at 15 K and (b) reconstructed infrared spectrum built as a linear com-bination of the reference spectra compared to reference spectra of methanol (c), glycolaldehyde (d), ethylene glycol (e), glyceraldehyde (f), glycerol (g) and polyoxymethylene (h).
widely on molecular quantity and environment; band positions and intensities can be affected accordingly (Fig.A3). However, the ac-ceptable match between both experimental and summed spectra suggests that the right products -MeOH, GA, EG, GCA, GCO and POM (when formed)- have been used to reproduce the experimental spectrum.
3.2 Mass spectrometry qualitative study
Mass spectrometry was performed to confirm the results obtained using infrared spectroscopy. We adopted the same strategy as with infrared spectroscopy for product identification by recording our own reference mass spectra. Fig.5shows the TPD traces from the
2 K min−1 heating of pure samples of GCO and GCA recorded
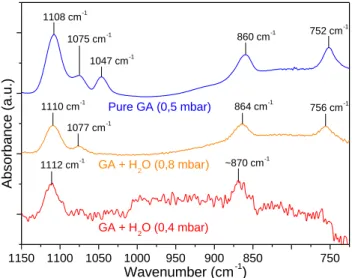
with our experimental setup. Mass spectra were also recorded at the desorption maximum peak of each species and are displayed in the right panel of Fig.5. Only m/z = 61 and m/z = 72 fragments are displayed as they are characteristic of these two species. It clearly appears that pure GCA and pure GCO desorb around 220 and 250 K respectively. These two desorption temperatures are in good agree-ment with the literature as GCA was reported to desorb around 230 K and GCO around 240 K (McManus et al. 2014;Maity et al. 2015;
Paardekooper et al. 2016). As expected, for pure molecules, GCA and GCO desorption occurs latter than GA (180 K) and EG (225
2 0 0 2 1 0 2 2 0 2 3 0 2 4 0 2 5 0 2 6 0 2 7 0 x 5 . 1 0- 2 m / z = 7 2 m / z = 6 1 m / z = 7 2 m / z = 6 1 In te n s it y (a .u .) G C A G C O 7 0 e V r e f e r e n c e s T e m p e r a t u r e ( K ) 0 2 0 4 0 6 0 8 0 1 0 0 G C A 4 0 4 5 5 0 5 5 6 0 6 5 7 0 7 5 0 2 0 4 0 6 0 8 0 1 0 0 R e la ti v e in te n s it y (% ) m / z G C O
Figure 5.TPD traces (2 K min−1) of pure GCA and GCO solid reference films. Reference mass spectra (70 eV) of GCA (220 K) and GCO (253 K) are displayed on the right pannel.
K) desorption as the former are heavier molecules (Butscher et al. 2015). Since the desorption temperatures and the structures of all these molecules are close and that many interactions are possible between them, co-desorption is expected to occur during the TPD experiments of complex samples.
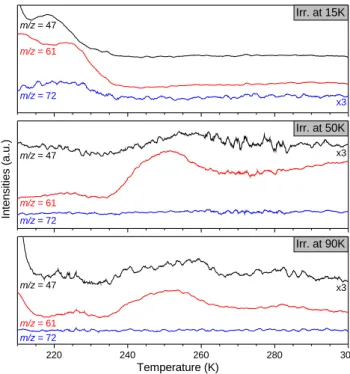
After the photolysis, the water matrix is gently desorbed at 160 K for 16 hours and then a TPD is performed from 160 to 300 K at a rate of 2 K min−1. Even if the water matrix is gently desorbed at 160 K, a non-negligible quantity of COMs is lost during this process (including GCA and GCO). In addition, co-desorption between GA, EG, GCA and GCO is observed between 160 and 210 K. As signal is abundant and difficult to analyze in this range, we decided to focus on higher temperatures (210-300 K) where GCA, GCO and POM are clearly desorbing. Additionally, there is no MeOH, EG and GA desorption in this range of temperature as it occurs before 210 K. TPD curves from 210 to 300 K for the three experiments are showed in Fig.6. The m/z = 61, m/z = 72 and m/z = 47 fragments are characteristic of GCO, GCA and POM and are displayed for 15, 50 and 90 K irradiated experiments. The m/z = 47 fragment is necessary to differentiate GCO and POM as these two species share the m/z = 61 fragment whereas only POM gives a fragment at m/z = 47 (Duvernay et al. 2014;Butscher et al. 2019). POM was reported to desorb in a wide range of temperatures (200 to 250 K) (Duvernay et al. 2014;Butscher et al. 2019) because of chain length distribution which confirms that high mass POM molecules are not formed in exp. 1 as m/z = 47 and m/z = 61 fragment desorptions only occur at 220 and 225 K respectively. The m/z = 47 fragment could come from short-chain POM of maximum two or three carbons considering the low and small range of desorption temperature. The
m/z= 61 and m/z = 72 fragments around 225 K belong to GCA as
Fig.5shows it. From this, we can conclude that GCA is formed in all three experiments as the m/z = 61 fragment is always detected around 225 K even if the m/z = 72 fragment is not. One has to keep in mind that GCA should be formed in a very low quantity. In addition, in13C experiments, m/z = 75 fragment is detected for exp. 2 and exp. 3 which confirms that GCA can be formed in such experiments (Fig.A8in Appendix).
In the case of POM, we clearly see that m/z = 47 and m/z = 61 fragments are detected in exp. 2 and exp. 3 between 235 and 270 K which is characteristic of high mass POM desorption. Moreover, the m/z = 47 fragment is nearly not detected around 220 K in these experiments which makes consistent its assignment to short-chain POM in this range of temperature. The chain mass distribution seems to highly depend on the irradiation temperature;
2 2 0 2 4 0 2 6 0 2 8 0 3 0 0 x 3 x 3 m / z = 7 2 m / z = 6 1 m / z = 4 7 m / z = 7 2 m / z = 6 1 m / z = 4 7 x 3 m / z = 7 2 m / z = 6 1 m / z = 4 7 In te n s it ie s (a .u .) I r r . a t 9 0 K I r r . a t 5 0 K T e m p e r a t u r e ( K ) I r r . a t 1 5 K
Figure 6.TPD traces (2 K min−1) of the 15, 50 and 90 K VUV irradiated
H2O/H2CO = 3/1 ices. Fragments of m/z = 47 (POM), 61 (POM/GCO/GCA) and 72 (GCA) are displayed for each experiment.
at low irradiation temperature (15 K in this work) only short-chain polymer are detected whereas, at higher temperature of irradiation (50 or 90 K in this work), higher mass POM molecules (longer chain polymer) are detected.
In the case of GCO, mass spectrometry does not give any hint of its formation for exp. 1 but the m/z = 63 fragment (GCO) in the corresponding13C experiment (see Fig.A7) is detected while the m/z = 48 fragment (POM) is not. The non-detection of GCO in the12C exp. 1 could be explained by its desorption together with other COMs and water between 160 and 210 K. However, in the two other experiments, GCO12C can be found from the m/z = 61 fragment, which is centered at 250 K and is consistent with our reference (Fig.5). The promoted POM formation when samples are irradiated at 50 and 90 K may trap GCO molecules which prevents them to co-desorb with water and other COMs between 160 and 210 K. However, it can co-desorb along with POM between 235 and 270 K since their desorption temperatures are close.
The formation of other stable products such as carbonic acid and formic acid cannot be excluded but they are not discussed here because of their low amount and that they desorb before 210 K. These molecules were already the focus of attention in a previous paper (Butscher et al. 2016).
3.3 Quantitative study
3.3.1 Product quantification
Abundances of CO2, CO and HCO have been calculated using band strengths of their characteristic absorption bands at 2342, 2136 and 1846 cm−1respectively (Table2). Abundances of COMs confirmed by both infrared spectroscopy and mass spectrometry (MeOH, GA, EG, GCA, GCO and POM) have been determined using two differ-ent methods. The first quantification is done by using deconvoluted
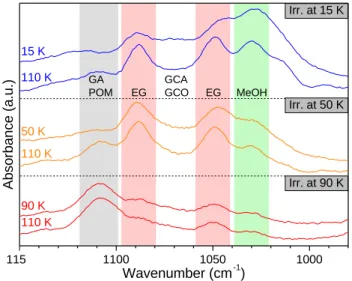
1 1 5 1 1 0 0 1 0 5 0 1 0 0 0 G C A G C O E G M e O H E G 1 1 0 K 1 1 0 K 9 0 K 5 0 K 1 1 0 K A b s o rb a n c e (a .u .) W a v e n u m b e r ( c m - 1) I r r . a t 1 5 K I r r . a t 5 0 K I r r . a t 9 0 K 1 5 K G A P O M
Figure 7.Infrared spectra in C-O stretching region for the three experiments
irradiated at 15 (blue), 50 (orange) and 90 K (red). Spectra are recorded at the temperature of irradiation for each experiment as well as at 110 K. Species are mentioned at their maximum of absorption. There is no modification on the scale in this figure.
infrared spectra shown in Fig.3or in Fig.A5in appendix. A sec-ond one is done from reference spectra of pure species used to build manual fits (Fig.4and Fig.A6in appendix) of experimen-tal spectra. Both methods present errors and uncertainties because the experimental spectra are composed of signal which are neither perfect Gaussian curves nor pure species signals. However, this two-manner determination gives an idea on the order of magnitude for errors made. The results obtained by these two methods are averaged and the error is determined by the difference between the upper de-termination result and the average value. Also, it may exist an error coming from the direct measurement of peak areas. We estimated that it cannot exceed 10%, so this 10% error is added on each result. Since infrared band strengths of GCA and GCO are not available in the literature (that is to say: no column density available), we only reported their integrated absorbance. Table3lists the abundances (when available) of the formed species: CO, HCO, MeOH, GA, EG, GCA, GCO and POM for the three experiments (irradiation at 15, 50 and 90 K). Effects of irradiation temperature are discussed in the following section.
3.3.2 Irradiation temperature effects
Fig.7shows the COM region for all three experiments directly after irradiation (15, 50 and 90 K) and after warming of the sample to 110 K for each experiment. It is clear that the irradiation temperature plays an important role in branching ratios and diffusion processes. An important extinction of methanol is observed with the increase of temperature (Fig.7, Table3). EG is nearly disappearing as well when irradiation temperature is 90 K (Fig.7, Table3). However, formation of GA seems to be favored when temperature of irradia-tion increases. The most interesting result is the formairradia-tion of POM (characteristic bands : 1109 cm−1 (most intense) or 936 cm−1 af-ter desorption of waaf-ter) at high temperature of photolysis which is partly responsible of the intense band around 1110 cm−1for the 90 K irradiated ice. However, POM is not detected by infrared spec-troscopy at low temperature of photolysis which could be explained by the low diffusion of formaldehyde into a water ice at such low temperatures (Mispelaer et al. 2013).
3.3.2.1 CO. As expected, CO represents one of the main
car-bon transformation pathways from photolysed formaldehyde as it reaches up to 25% of the consumed H2CO (Table 3). When ir-radiation temperature is increased, CO formation decreases which can be explained by its low sublimation temperature of about 50 K (Bennett & Kaiser 2007).
3.3.2.2 CO2. Carbon dioxide follows the exact same trend as
CO; its abundance of 3.6% in exp. 1 decreases as the irradiation temperature increases (Table3). This can easily be explained by the fact that CO2is formed in the ice by the reaction CO + OH (Garrod
& Pauly 2011). CO being depleted at 50 and 90 K by desorption, CO2formation is hampered. CO2can also be formed by the reaction O + CO (see "chemical network" section).
3.3.2.3 MeOH. The amount of methanol is 10.3% in exp. 1 and
has the same behaviour as carbon monoxide but MeOH desorption temperature is much higher (115 to 150 K depending on the en-vironment and quantity) (Bennett & Kaiser 2007;Butscher et al. 2016). As a result, the lower quantity of MeOH when the irradia-tion temperature is increased cannot be explained by its sublimairradia-tion. However, H-atoms desorb more easily when the temperature rises as their ability to diffuse is greatly enhanced with the temperature. It should disfavor hydrogenation processes and thus, formation of methanol. In addition, MeOH quantity lightly decreases when the temperature is increased from the initial irradiation temperature to 110 K. This could be explained by its consumption as a hydrogen donor to perform H-abstraction processes when H-atoms begin to lack in the sample.
3.3.2.4 HCO. Regarding formyl radical, its detected quantity is
divided by a factor of two at 50 K (1.2%) compared to 15 K (2%), indicating an increased mobility of HCO radical at 50 K compared to lower temperatures. At 90 K, HCO is no longer detected but we still observe products involving it as a reactant such as GA. It means that at such a high temperature, its lifetime is shorter than the acquisition of a spectrum.
3.3.2.5 GA. Glycolaldehyde is clearly more formed when the
irradiation temperature is increased as it represents from 4.5% of consumed formaldehyde at 15 K up to 11.5% at 90 K. A great part of GA seems to come from warming processes following the photolysis except for exp. 3 where the two measured GA quantities are equal, within the error margins (Table3, Fig.7).
3.3.2.6 EG. Ethylene glycol, the second species to be formed in
exp. 1, has a behavior more surprising. It is optimally produced when irradiation temperature is set to 50 K and almost no longer formed in 90 K photolysed experiments (Table3, Fig.7). This may come from the low quantity of available hydrogen at high temperatures as EG needs CH2OH radicals to be formed and as this radical is produced from formaldehyde hydrogenation (reaction1).
3.3.2.7 POM. The most striking result is that polyoxomethylene
is formed with elevation of the irradiation temperature. It seems that the higher the temperature of irradiation, the greater the quantity of POM, reaching 4.9% in exp. 3. This result could be explained by the increased mobility of formaldehyde with temperature (Mispelaer et al. 2013) and by the decline of hydrogenation processes lowering termination process probability. Quantity of formed POM is directly taken as a function of the number of C atoms (the used band strength value is in cm carbon−1) needed to produce it (Schutte et al. 1993).
Table 3. Abundances of formed species during VUV photolysis at 15, 50 or 90 K for H2O/H2CO = 3/1 ices
Exp. 1 Exp. 2 Exp. 3
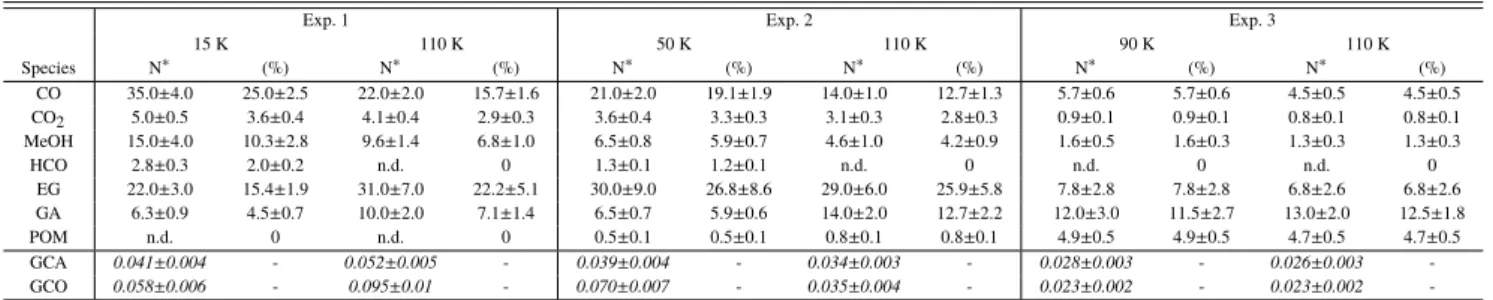
15 K 110 K 50 K 110 K 90 K 110 K Species N∗ (%) N∗ (%) N∗ (%) N∗ (%) N∗ (%) N∗ (%) CO 35.0±4.0 25.0±2.5 22.0±2.0 15.7±1.6 21.0±2.0 19.1±1.9 14.0±1.0 12.7±1.3 5.7±0.6 5.7±0.6 4.5±0.5 4.5±0.5 CO2 5.0±0.5 3.6±0.4 4.1±0.4 2.9±0.3 3.6±0.4 3.3±0.3 3.1±0.3 2.8±0.3 0.9±0.1 0.9±0.1 0.8±0.1 0.8±0.1 MeOH 15.0±4.0 10.3±2.8 9.6±1.4 6.8±1.0 6.5±0.8 5.9±0.7 4.6±1.0 4.2±0.9 1.6±0.5 1.6±0.3 1.3±0.3 1.3±0.3 HCO 2.8±0.3 2.0±0.2 n.d. 0 1.3±0.1 1.2±0.1 n.d. 0 n.d. 0 n.d. 0 EG 22.0±3.0 15.4±1.9 31.0±7.0 22.2±5.1 30.0±9.0 26.8±8.6 29.0±6.0 25.9±5.8 7.8±2.8 7.8±2.8 6.8±2.6 6.8±2.6 GA 6.3±0.9 4.5±0.7 10.0±2.0 7.1±1.4 6.5±0.7 5.9±0.6 14.0±2.0 12.7±2.2 12.0±3.0 11.5±2.7 13.0±2.0 12.5±1.8 POM n.d. 0 n.d. 0 0.5±0.1 0.5±0.1 0.8±0.1 0.8±0.1 4.9±0.5 4.9±0.5 4.7±0.5 4.7±0.5 GCA 0.041±0.004 - 0.052±0.005 - 0.039±0.004 - 0.034±0.003 - 0.028±0.003 - 0.026±0.003 -GCO 0.058±0.006 - 0.095±0.01 - 0.070±0.007 - 0.035±0.004 - 0.023±0.002 - 0.023±0.002
-Notes. The times of photolysis are 170, 80 and 40 min (4.2 × 10¹⁷, 2.0 × 10¹⁷and 9.8 × 10¹⁶photons.cm−2respectively) for exp. 1, exp. 2 and exp. 3 respectively. The total amounts of consumed H2CO (Nc(H2CO)) are 1.4 × 10¹⁷, 1.1 × 10¹⁷and 1.0 × 10¹⁷molec cm−2respectively and represent 30 ± 1% of the initial formaldehyde quantity for each experiment. The quantities of consumed formaldehyde during heating processes from irradiation temperature to 110 K are: 1.2 × 10¹⁷, 9.3 × 10¹⁶and 4.6 × 10¹⁶molecule cm−2for exp. 1, exp. 2 and exp. 3 respectively. Some formaldehyde is lost by desorption as its sublimation temperature is about 110 K (Noble et al. 2012). The yields have been calculated as follows: (%) = N(X)/Nc(H2CO). POM yield is expressed as a function of consumed carbon atom (Schutte et al. 1993). Uncertainties have been determined by averaging two different quantification methods (manual fit and Gaussian fit) and taking into account a 10% error for peak area measurements.(∗)N is expressed in 1015molecule cm−2except for POM where it is in 1015carbon cm−2(Schutte et al. 1993) and for GCA and GCO whose quantification is impossible. Their column density not being available, their integrated absorbance is displayed instead.
3.3.2.8 C3COMs. In the case of GCA and GCO, unfortunately,
solid phase band strengths are not yet known making their quan-tification impossible. However their integrated absorbance show that for exp. 1, an important part of GCO and GCA is formed during the heating process which is not the case for two other ex-periments. Globally, their quantity decreases with the irradiation temperature, maybe because POM over-consumes formaldehyde molecules which therefore are not available to form other complex species.
3.3.2.9 Comparison of EG and GA. EG/GA ratios are 3.4,
4.5 and 0.7 when irradiation temperatures are 15, 50 and 90 K respectively. The first ratio is different from the result obtained in a previous experiment done at 13 K (Butscher et al. 2016) where the ratio EG/GA was near 1. InButscher et al.(2016), ices were more diluted (H2O/H2CO = 5/1 compared to 3/1 here) and the irradiation time needed to reach 30% of formaldehyde photolysis was much higher (23 h compared to 170 min here). This can explain the observed difference for the EG/GA ratio between both experiments. At 50 K, the EG/GA ratio is maximum indicating that more CH2OH is formed compared to HCO. As a great quantity of H-atoms is formed by H2O photolysis, it can make the formation reaction of CH2OH by reaction (1) faster than the formation reaction of HCO by reaction (2) at 50 K compared to 15 K:
H2CO + H → CH2OH (1)
H2CO + hν → HCO + H (2)
However, at 90 K, H-atoms mobility is even more increased but we observe an extinction of EG which confirms the tendency for H-atoms to recombine together rather than to participate in hy-drogenation reactions. In the case of GA, at 90 K it is still greatly produced so that the EG/GA ratio falls to 0.7. As we just show that at this temperature, hydrogenation processes are inhibited so that almost no EG and methanol are formed (that is to say, no CH2OH produced), it clearly indicates that GA can be formed without any CH2OH radical. Another candidate for its formation is formalde-hyde and the potential reaction mechanism is discussed later in the "chemical network" section.
3.3.2.10 Comparison of EG and MeOH. Considering EG and
methanol formation behaviors when irradiation temperature rises, it may indicate that formaldehyde hydrogenation in the bulk is op-timized at 50 K but that the second H-addition becomes to be inhibited, otherwise we should also observe a methanol formation increase at 50 K which is clearly not the case. At this temper-ature of irradiation, species mobility seems to favor EG forma-tion through CH2OH compared to over-hydrogenation which would yield methanol. These experiments show also that water molecule is not an efficient donor of H-atoms through H-abstraction processes. If it was the case, methanol quantity would follow EG trend.
Globally, these new results show that irradiation temperature plays an important role in the final ice composition. Branching ratios seem to be greatly affected by irradiation temperature so that some species are more or less produced depending on the ice temperature during photolysis. H-atom behavior is also affected as hydrogenation formed products are inhibited when temperature is too high.
4 DISCUSSION: CHEMICAL NETWORK 4.1 Photodissociation processes
The first reactions taking place in all experiments are formaldehyde and water dissociations induced by VUV photons. In the case of water, we expect reaction3to occur (Ung & Back 1964):
H2O + hν → OH + H (3)
In addition to reaction3, reaction4is a well known photodis-sociation channel in gas phase (Stief et al. 1975;Slanger & Black 1982):
H2O + hν → O + H2 (4)
This channel is only 1% of the total dissociation process for photon energy lower than 8.5 eV (Stief et al. 1975), but grows up to 10% at 10.2 eV (Slanger & Black 1982) in the gas phase. Thus, oxygen atom production in our experiments cannot be excluded. These oxygen atoms may be converted to CO2through reaction5 as described inWatanabe et al.(2007):
O + CO → CO2 (5) The main route to form CO2in icy mantles was determined to be reaction6(Garrod & Pauly 2011):
OH + CO → CO2+ H (6)
Regarding formaldehyde, its photochemistry in the gas and solid phases has been extensively investigated and two primary photodissociation routes have been shown to be involved (Sodeau & Lee 1978;Moore & Weisshaar 1983;Gerakines et al. 1996). The reactions are summarized by the equations2and7:
H2CO + hν → CO + H2 (7)
Such elementary reactions are known to be first order processes in the gas phase which implies that its half-life does not depend on the initial quantity. However, the three experiments depicted here were realized with very similar initial conditions (3 mbar of H2O/H2CO = 3/1) and a non-negligible temperature effect on photo-dissociation rate constant is observed as 40, 80 and 170 min were needed to photolyse 30 ± 1% of formaldehyde at 90, 50 and 15 K respectively. This is explained by the fact that, in solid phase, the rate constant takes into account several physical processes other than pure photo-dissociation cross section, such as recombination and diffusion processes which depend on the system temperature. Thus, at high temperature, photolysed fragments and H-atoms have more translational energy to diffuse, that is to say to move away from each other so that recombination processes are less likely and less time is needed to photo-dissociate the same proportion of sample.
4.2 Hydrogenation processes
One of the most interesting effects of temperature on reactivity is the quantity of available H-atoms participating in hydrogenation processes. Table3clearly shows that the quantity of methanol -the best example in term of hydrogenation product- decreases when the irradiation temperature increases. Methanol was showed to be efficiently formed from the double hydrogenation of formaldehyde following reaction 8(Watanabe & Kouchi 2002;Butscher et al. 2015):
H2CO−H→CH2OH/CH3O−→H CH3OH (8)
processes or during the photolysis but this is difficult to quantify because of its different structure rearrangements with temperature changes. However, H-abstraction processes from water molecules seems to be less efficient than direct hydrogenation with free H-atoms since at 90 K almost no MeOH production is observed while H-abstraction reactions dominate.
4.3 Recombination and addition processes
4.3.1 Formation of C2COMs
As described inButscher et al.(2015);Kaiser et al.(2015);Fedoseev et al.(2017), in interstellar ices, GA and EG may form through barrierless recombinations between HCO and CH2OH radicals as shown with reactions (9) and (10):
HCO + CH2OH → CHOCH2OH (GA) (9)
CH2OH + CH2OH → HOCH2CH2OH (EG) (10)
This reaction scheme, likely in low temperature experiments, appears to be insufficient to explain the formation patterns of EG and GA in our experiments (table3). Indeed, reactions9and10
show that at least one CH2OH radical is mandatory to form GA and EG. However, results show that hydrogenation products such as methanol and CH2OH are inhibited while glycolaldehyde for-mation is boosted when temperature is increased. It follows that an alternative route for GA formation without CH2OH radical has to exist at high temperature. We propose an addition reaction between formaldehyde and its main photolysis product, the HCO radical (Butscher et al. 2016) as shown in equation (11):
H2CO−−−−→HCO CHOCH2O−→H CHOCH2OH (GA) (11)
Regarding EG, there is no direct evidence for another mech-anism of formation than the reaction 10 as it still need at least one CH2OH radical to be formed; if CH2OH is not formed, EG formation is simply inhibited. However, the evidence for the non radical-radical addition mechanism for the formation of GA makes the same mechanism for EG likely to occur (reaction12):
H2CO CH2OH
−−−−−−→HOCH2CH2O−→H HOCH2CH2OH (EG) (12)
These two mechanisms may be inefficient at 15 K but they be-come interesting in high temperature irradiation conditions because there is more thermal energy, which makes possible radical-non rad-ical reactions to occur. Furthermore, initiation of reactions (11) and (12) have relatively low calculated barriers at B3LYP/dev2-TZVP level of theory of 20 and 8 kJ mol−1respectively (Butscher et al.
2019) which make them very likely to occur in warmer environ-ments. The temperature increase enhances the mobility of radical species and knowing that their reaction with formaldehyde is en-ergetically feasible makes reactions (11) and (12) of main interest. The amount of formaldehyde is much more important than the quan-tity of radicals (only 30% is consumed during irradiation) so that reactions (9) and (10) should be insignificant at high temperature of irradiation at least. This statement is also supported by the fact that for exp. 1, a great part of EG and GA is formed during the heating process, where all species gain in mobility and reaction barriers can be easily overcome.
Another interesting result is the formation pattern of EG. It appears that it is optimally produced when irradiation temperature At 15 K, the quantity of methanol is maximum and it decreases
when irradiation temperature is elevated to 50 and 90 K where its extinction is observed. The elevation of temperature inhibits the for-mation of the two products of formaldehyde hydrogenation, namely CH2OH or CH3O radical and methanol while the initial hydrogen budget does not change from an experiment to another. A possi-ble explanation is that at high temperatures, H-atoms can diffuse in the sample that fast they simply recombine to form dihydrogen molecules, which, at these temperatures, desorb easily from the sample.
Alternatively, hydrogen bearing molecules can be used as a reservoir of H-atoms which can be released by H-abstraction process (Chuang et al. 2016). It appears that methanol greatly participates in this type of mechanism as its quantity decreases when samples are heated up from irradiation temperature to 110 K (Table 3). Water molecules may also be a source of H-atoms through H-abstraction
is around 50 K as it represents 27% of products compared to only 15 and 8% after irradiation at 15 and 90 K, respectively. The tempera-ture increase surely prevents hydrogenation processes to occur but it may also increase diffusion processes and reaction kinetics. It must exist a temperature where the combination of these two opposite effects gives a maximum quantity of CH2OH available in the ice and thus, a maximum quantity of EG formed at the end.
It should be pointed out that no methyl formate (MF) has been detected in our experiments although it is one of the most observed COMs in the ISM (El-Abd et al. 2019). MF is supposed to be formed from the recombination of CH3O and HCO radicals (Bennett & Kaiser 2007; Chuang et al. 2017) as shown in reaction
13:
CH3O + HCO → CH3OCHO (13)
Our experiments show that formaldehyde and water are not efficient precursors for the formation of MF as it has never been observed in such experiments (Butscher et al. 2016,2019). Also, the clear formation of EG in exp. 1 and exp. 2 may be indicative of CH2OH radical formation. However the absence of MF signal seems to discredit the formation of CH3O radical. MF would have been a good probe for CH3O production (reaction13) and its non-detection seems to indicate that formaldehyde hydrogenation (re-action8) preferentially yields CH2OH than CH3O (Butscher et al.
2016).
4.3.2 Formation of C3COMs
Considering that reactions (11) and (12) are plausible, it means that reactions between a radical species and a carbonyl (at least aldehyde) function is likely to occur as long as enough energy is brought to overcome their low reaction barriers. We can therefore postulate a similar addition mechanism for the GCA and GCO formation as glycolaldehyde possesses an aldehyde function as well. The two reactions involving GA for the elongation of the carbon chain would be (14) and (15): H OH O • H GA GCA H O • H OH O O H OH O OH (14) H OH O OH H H • HO OH O • H HO OH OH GA GCO (15)
Theoretical calculations seem to disfavor this reaction scheme because for the reaction (14) the calculated reaction barrier at the M06-2X-D3/aug-cc-pVTZ level of theory is more than two times higher than for reaction (11) (34 compared to 14 kJ mol−1, see Butscher et al.(2017)). Considering that the probability for a HCO/CH2OH radical to react with a formaldehyde molecule is higher than with glycolaldehyde (which has to be formed), and con-sidering the two times more important barrier for the reaction (14) to occur, it is surprising to have such clear IR and mass results for the GCA/GCO formation. One has to keep in mind that theoret-ical calculations are done for isolated molecules which is clearly not the case in our experiments. Such calculated values are used to determine which reaction is more likely.
An alternative mechanism leading to GCA and GCO is a polymerization-like reaction not passing through GA but keeping a
radical species at each step.Wang & Bowie(2010) have proposed a very similar mechanism for the formation of sugars from formalde-hyde and CH2OH radical. In our reaction scheme, one radical (HCO or CH2OH) would react on a formaldehyde molecule (like in reac-tions (11) and (12)), which is favored thanks to its high quantity in the ice, forming an O-bearing radical which would rearrange into the corresponding C-bearing radical, following reactions (16) and (17): H H O • H O • H O O • H OH O (16) H H O OH H H • HO O• HO OH • (17) Such an isomerization process via intramolecular hydrogen atom transfer is often forbidden in the gas phase at low temperature. Indeed, activation barrier of such reactions are greater than 100 kJ mol−1making them unlikely at low temperature in the gas phase of the ISM (Wang & Bowie 2010,2012). For example, the calculated barrier for HOCH2CH2O/HOCH2CHOH isomerization (reaction
17) is 117 kJ mol−1resulting in a very low rate at low temperature even if tunneling effects are taken into account (Wang & Bowie 2012). The same behavior is observed for the CH3O/CH2OH iso-merization where an activation barrier of 125 kJ mol−1has been calculated. However, it has been theoretically reported that small molecules as H2O or HCOOH can facilitate the isomerization of CH3O to CH2OH via formation of a doubly hydrogen-bonded tran-sition state making the CH3O/CH2OH isomerization more likely in condensed environments (Buszek et al. 2011;Lee et al. 2015). This is in good agreement with experimental results.Lee et al.(2015) observed a fast (7.6 × 10⁻³ s−1) CH
3O conversion into CH2OH at 4 K in parahydrogen. They suspected that CH3O reacts readily with H2 to form CH2OH. Moreover,Iwasaki & Toriyama(1978) reported ESR spectra arising from CH3O trapped in polycrystalline methanol X-ray irradiated at 4.2 K. They observed that CH3O is no longer stable and is fully converted into CH2OH in a few minutes after annealing at 77 K. Accordingly, we can assume that hydrogen atom transfer leading to C-bearing radical from O-bearing radical as in reaction16and17are likely to occur at low temperature in icy environments.
At this stage, from the O- or C-bearing radical (reactions16
and17), hydrogenation reactions would simply give GA or EG, but depending on the amount of formaldehyde around, the growth of the chain is also possible. From the new C-bearing radical, we can expect again a reaction with a formaldehyde molecule as it is the main containing carbonyl partner. A new O-bearing radical would be obtained, this time with a three carbon chain. This new radical can be easily hydrogenated, yielding GCA or GCO depending on the initiating radical (HCO or CH2OH), giving reactions (18) and (19): • • H H H O GCA H OH O H O O OH H OH O OH (18) HO OH • HO OH O HO OH OH • H H H O (19)
Four- or more-carbon bearing COM formation is not excluded but they are not detected in our experimental conditions.
4.3.3 Formation of POM
Polyoxomethylene was showed to be formed at 13 K in interstellar ice analogues from the VUV photolysis of pure formaldehyde solid films but not when mixed with water (Butscher et al. 2016). In this contribution, we add the possibility to form this molecule in astrochemically relevant ices composed of formaldehyde and water when irradiation temperature is set at 50 or 90 K. The formation of such a molecule takes place in three steps: an initiation step (reaction20), a propagation step (reaction21) and a termination step (reaction22). InButscher et al.(2016), the two possible initiators were CH2OH and HCO as there was only formaldehyde in yielding-POM samples. Here, we can add OH radical as an initiator as there is a great quantity of water in our ices. If R is one of the three potential initiators (HCO, CH2OH and OH), thus reaction20is the first step of the reaction:
R.+ CH2O → RCH2O. (20)
Then, the product of reaction20can react again on (n) other formaldehyde molecules during the propagation step, following re-action21:
RCH2O.+ nCH2O → RCH2O(CH2O)n−1CH2O. (21)
The final POM molecule is obtained when the polymerization mechanism is stopped by the reaction with another radical species. In our case, it should be an H-atom as there are many available to perform direct H-addition or H-abstraction processes. This is showed in reaction22:
RCH2O(CH2O)n−1CH2O.+ H → RCH2O(CH2O)n−1CH2OH (22)
the m/z = 47 fragment for low temperatures is decreasing, showing a less efficient production of short-chain polymers.
5 ASTROPHYSICAL SIGNIFICANCE
The experiments presented in this work demonstrate that complex organic molecules and especially sugars, polyols and related com-pounds are efficiently formed from formaldehyde containing water ice exposed to VUV photons at temperatures ranging from 15 to 90 K (Fig.8). The molecular abundance of formaldehyde within the icy mantles varies from 1% to 6% relative to water in several high and low mass protostars (Dartois 2005;Boogert et al. 2008) or hot cori-nos (Maret et al. 2004), making formaldehyde a key intermediate in interstellar ices (Schutte et al. 1993;Bossa et al. 2009; Vino-gradoff et al. 2011,2012;Le Roy et al. 2012;Danger et al. 2014;
Duvernay et al. 2014). The icy mantles are processed by hydrogena-tion reachydrogena-tions, high-energy galactic cosmic rays and/or exposed di-rectly to the interstellar UV field. This triggers photo-dissociation of molecules such as water or formaldehyde into reactive radicals. Two distinct carbon-bearing radicals have been shown to be pro-duced by such processes in ice analogue environments which are the formyl and the hydroxymethyl radicals (Bennett & Kaiser 2007;
Hama & Watanabe 2013;Butscher et al. 2015). These radicals seem to be really important in the formation of the five COMs reported here: glycolaldehyde, ethylene glycol, glyceraldehyde, glycerol and polyxomethylene, and their formation is likely in icy mantles of star forming regions. We demonstrated in a previous paper that GA and EG can be formed in the very early stages of a star forming system as they can be formed at 13 K under VUV irradiation (Butscher et al. 2016).
This two key molecules are widely detected in the interstellar medium (Hollis et al. 2000, 2001, 2002; Crovisier et al. 2004;
Beltrán et al. 2009;Jørgensen et al. 2012;Maury et al. 2014;Coutens et al. 2015) or more recently in comet 67P thanks to the Rosetta mission (Goesmann et al. 2015;Meringer et al. 2018). However, the ratio between these two COMs seems to differ from a region to another. EG/GA is about 5 in NGC 1333 IRAS2A class 0 protostar (Coutens et al. 2015) while is it close to 1 in IRAS 16293-2422 class 0 protostar (Jørgensen et al. 2012) and ranging from 3 to 6 in comets (Crovisier et al. 2004;Biver et al. 2014). The same scheme occurred with our experiments as we obtained ratios ranging from 0.7 to 4.5 depending on the irradiation temperature. These results seem to indicate that the branching ratios for the GA and EG formations are closely related to the temperature. The EG/GA ratio as observed in the gas phase of the ISM could provide additional clues about the physical conditions prior to their formation. Interestingly, the other widely observed COMs methyl formate (MF) and acetic acid (AA) were not observed in our experiments while they represent a large fraction -larger than GA for MF- in star forming regions (El-Abd et al. 2019). It could be explained by the fact that neither formaldehyde nor water are able to generate the key radicals (CH3O and CH3) mandatory for their formation. In the interstellar medium, other molecules such as methanol compose the ices and could be good precursors for the MF and AA formation (Bennett & Kaiser 2007;El-Abd et al. 2019). The conclusion we can draw from this observation is that formaldehyde seems to be a specific precursor of sugars and related compounds.
Fedoseev et al.(2017) achieved to obtain GCO and GCA from only hydrogenation and barrierless reactions at low temperature (13 K). They used CO/GA ices in order to favour hydrogenation of GA and to artificially increase the quantity of obtained C3COMs. The POM chain length may depend on the quantity of
H-atoms available as well as of the mobility of the growing chain and formaldehyde molecules. Indeed, the H-atom quantity determines how fast the termination reaction is and the mobility of the different species plays a role on the propagation step kinetic. When irradi-ation temperature is high, there is a combinirradi-ation of two positive growing effects; there are less H-atoms available to terminate the POM chains and molecules are more mobile as well so that propa-gation step is faster. In contrast, at low temperature, there is a great quantity of H-atom available and this is the only species diffusing in the ice. As a result, the kinetic rate of the propagation step is slower than the termination reaction one. We observe only short-chain POM when irradiating at 15 K such as GA or EG which can be viewed as "polymerization products" if the initiation step occurs with HCO (reaction 16) or CH2OH (reaction 17) without propa-gation step but directly the termination one. Also, the same kind of mechanism can occur with OH as initiator which would yield methanediol (HOCH2OH), a good candidate for the m/z = 47 frag-ment (HOCH2O) seen in Fig. 6. This fragment can also be obtained with small three carbon-bearing POM chains initiated by HCO or CH2OH radicals as it can be seen in Butscher et al. (2019). The fact that short- or long-chain POM molecules are formed whether the temperature is low or high is well represented in Fig. 6. The m/z = 47 fragment is only detected at low temperature (180-210 K) for exp. 1 and begins to be detected at much higher temperatures (240-270 K) for exp. 2 and exp. 3. In the meantime, the relative intensity of
Figure 8.Proposed general formation scheme for polyols and sugars starting from formaldehyde. Molecules with vicinal diols are also displayed as OH radicals
could also initiate carbon growth chain reactions. The species in black are not detected in our experiments. The only detected radical is HCO.
It may indicate that GCO and GCA can be formed in molecular clouds.Kaiser et al.(2015) andZhu et al.(2020) showed that GCO can be formed through energetic processing (energetic electrons) from methanol ices at low temperature. It adds a pathway to the complex scheme of sugar and related compound formation. In this work, a third set of conditions was applied. We used VUV photon irradiation to process astrochemically relevant ices composed of diluted formaldehyde into water. The irradiation temperature was
set at 15, 50 or 90 K to simulate the first stages of protostellar evolution (prestellar core to protostar and disk formation) where temperatures can vary from ten to a hundred kelvin (Dunham et al. 2013). This kind of temperatures increases the mobility of species in the ice and open new reaction pathways for low barrier reactions such as radical-non radical reactions. As expected, the resulting ice compositions from our experiments were highly dependent on irra-diation temperature. A larger diversity of molecules was found to