HAL Id: hal-00297033
https://hal.archives-ouvertes.fr/hal-00297033
Submitted on 21 Sep 2007
HAL is a multi-disciplinary open access
archive for the deposit and dissemination of
sci-entific research documents, whether they are
pub-lished or not. The documents may come from
teaching and research institutions in France or
abroad, or from public or private research centers.
L’archive ouverte pluridisciplinaire HAL, est
destinée au dépôt et à la diffusion de documents
scientifiques de niveau recherche, publiés ou non,
émanant des établissements d’enseignement et de
recherche français ou étrangers, des laboratoires
publics ou privés.
Heavy rain prediction using deterministic and
probabilistic models ? the flash flood cases of 11?13
October 2005 in Catalonia (NE Spain)
A. Barrera, V. Altava-Ortiz, M. C. Llasat, M. Barnolas
To cite this version:
A. Barrera, V. Altava-Ortiz, M. C. Llasat, M. Barnolas. Heavy rain prediction using deterministic and
probabilistic models ? the flash flood cases of 11?13 October 2005 in Catalonia (NE Spain). Advances
in Geosciences, European Geosciences Union, 2007, 12, pp.121-126. �hal-00297033�
www.adv-geosci.net/12/121/2007/ © Author(s) 2007. This work is licensed under a Creative Commons License.
Geosciences
Heavy rain prediction using deterministic and probabilistic models –
the flash flood cases of 11–13 October 2005 in Catalonia (NE Spain)
A. Barrera, V. Altava-Ortiz, M. C. Llasat, and M. Barnolas
Meteorological Hazards Analysis Team (GAMA), Department of Astronomy & Meteorology, Faculty of Physics, University of Barcelona, Av. Diagonal 647, 08028 Barcelona, Spain
Received: 28 February 2007 – Revised: 17 June 2007 – Accepted: 17 September 2007 – Published: 21 September 2007
Abstract. Between the 11 and 13 October 2005 several flash floods were produced along the coast of Catalonia (NE Spain) due to a significant heavy rainfall event. Maximum rainfall achieved values up to 250 mm in 24 h. The total amount recorded during the event in some places was close to 350 mm. Barcelona city was also in the affected area where high rainfall intensities were registered, but just a few small floods occurred, thanks to the efficient urban drainage sys-tem of the city. Two forecasting methods have been ap-plied in order to evaluate their capability of prediction re-garding extreme events: the deterministic MM5 model and a probabilistic model based on the analogous method. The MM5 simulation allows analysing accurately the main me-teorological features with a high spatial resolution (2 km), like the formation of some convergence lines over the region that partially explains the maximum precipitation location during the event. On the other hand, the analogous tech-nique shows a good agreement among highest probability values and real affected areas, although a larger pluviomet-ric rainfall database would be needed to improve the results. The comparison between the observed precipitation and from both QPF (quantitative precipitation forecast) methods shows that the analogous technique tends to underestimate the rain-fall values and the MM5 simulation tends to overestimate them.
1 Introduction
Catalonia is located in the Northeast corner of the Iberian Peninsula. The orography of the country is very complex, and it has a strong influence on pluviometry. Therefore, re-markable contrasts are observed in a few kilometres. Three mountain ranges are the most important geographical factors
Correspondence to: A. Barrera
(tbarrera@am.ub.es)
influencing meteorological processes: The Littoral range, the Pre-littoral barrier and the Pyrenees in an increasing altitu-dinal order. They have an important role on pluviometric events enhancement (Llasat et al., 1999).
Catalonia has been periodically affected by heavy rainfall events during the last years. These events occur mainly in autumn, which is the rainiest season in the region. Recent ex-amples of such type of events are the cases of 9–10 June 2000 (Llasat et al., 2003), 21–24 October 2000 (Barnolas, 2004), 8–10 October 2002 (Llasat et al., 2004), 16–18 October 2003 (Altava-Ortiz et al., 2006) and 6 September 2004. As a re-sult of the heavy rainfall frequency in Catalonia, flash floods are usually recorded in the coastal little basins with a strong slope towards to sea. For example the city of Barcelona has been affected by 54 flash floods since 1351 (∼1 flash flood per 10 years) (Barrera et al., 2006).
Statistical and deterministic methods are applied in the current paper, to analyse how they work when an ex-treme rainfall event is registered. A first dual treatment (deterministic-statistical) for extreme cases was performed in Altava-Ortiz et al. (2006). Here, more detailed probabilis-tic outputs in addition to new MM5 simulations have been developed and applied to one of the last heavy rainfall events registered in Catalonia: the 11–13 October 2005 event.
2 Meteorological situation and event overview
On 11 October 2005 a strong anticyclone was located over Eastern Russia producing a high pressure blocking. At the same time, a trough was formed in front of the Portugal coast. Due to the blocking, forced by the high pressure cen-tre, this trough moved towards the South-East during the fol-lowing days, reaching the centre of Iberian Peninsula in the form of a very well-defined cut-off low on 13 October at 12:00 UTC. This configuration implied an important advec-tion of warm and moist air masses against the littoral and
122 A. Barrera et al.: Heavy rain prediction using deterministic and probabilistic models
Fig. 1. Recorded precipitation from 00:00 to 24:00 UTC over Catalonia on 11 October 2005 (a), 12 October 2005 (b), 13 October 2005 (c)
and total accumulated precipitation from 11 October 2005 at 00:00 UTC to 16 October 2005 at 00:00 UTC (d). Data obtained from 313 stations.
pre-littoral ranges of Catalonia at low levels. At surface an important low was installed over the centre of the Iberian peninsula during the event and produced a southern wind flux against Catalonia. As a result, heavy precipitations and flash floods were recorded during the event resulting in 4 casu-alties and several material damages. This event had simi-lar characteristics to the September 1971 event (Llasat et al., 2007), but it has been less damaging and catastrophic.
Figure 1 shows the rainfall evolution of the entire episode, from 11 to 13 October and also the total amount recorded. The event began on 11 October with heavy rainfalls over the central southern Catalan coast. The Creixell ephemeral river was overflowed (Fig. 2a), producing an important flash flood in that locality, due to an amount of precipitation of 134 mm in few hours (Fig. 1a). The next day (12 October, Fig. 1b) the instability moved northwards and heavy rain-fall was recorded over Barcelona city, its metropolitan area and central northern Catalan coast. The third day (13 Octo-ber, Fig. 1c) the heaviest rainfalls occurred in the Northern coastal region with maximum daily precipitation amounts up to 250 mm and 5-min intensities close to 100 mm/h (Fig. 3). As a result, a large number of ephemeral rivers were over-flowed and flash floods were produced (catastrophic damages in Calonge ephemeral river, Fig. 2a). The Dar´o and Ridaura rivers were also within the affected catchments (Fig. 2a). During the 14–15 October the rainfall continued, but with
a more moderate intensity without any flash flood recorded. As a summary, more than 340 mm in the entire episode were recorded in some places of the north Catalan coast (Fig. 1d). Figure 2a shows the municipalities affected by flash floods, while Fig. 2b presents the affected basins. The af-fected basins have areas between 90 and 340 km2(Fig. 2b), short response time and are periodically affected by flash floods. For example the Maresme basin (Fig. 2b) has been affected by 131 flash floods during the 20th century (∼1.3 flash floods per year) (Barnolas and Llasat, 2007). Concern-ing material losses, approximately 4000 houses, more than 3000 shops, and 1500 cars were damaged in the municipali-ties of Platja d’Aro, Santa Cristina d’Aro, Calonge and Sant Feliu de Gu´ıxols. There were other damages in infrastruc-tures and public ownerships. All these damages were evalu-ated in more than 21 million euros (economic losses in public infrastructures rose above 6 million euros in Santa Cristina d’Aro). Between 8000 and 10 000 claims were received by the Spanish National Consortium of Insurances (Consorcio
de Compensaci´on de Seguros). However, the counting is
dif-ficult because some claims were made through private insur-ance companies.
Fig. 2. (a) Municipalities affected by flash floods. In red are shown
the municipalities with catastrophic flooding. (b) Affected basins: location and area.
3 Data and methodology
Different sources of data have been used for developing the present study. To develop the observed daily rainfall charts 313 rainfall stations has been compiled within Catalonia and surroundings areas (Fig. 4). The data used in the analogous technique and for the MM5 model simulations are detailed as follows.
3.1 Analogous method
The analogous method applied here is a statistical down-scaling method using the geopotential height at 1000 hPa, 850 hPa and 500 hPa as primary predictor fields, and the geopotential height and humidity at 1000 hPa as secondary predictor fields. The method estimates the probability of exceeding a certain rainfall value in 24 h, according to an ensemble of rainfall patterns that occurred in the past, by
Fig. 3. Hyetogram for La Bisbal d’Empord`a showing the high
5-min rainfall intensities reached during the 13 October 2005.
Fig. 4. Distribution of the 313 rainfall stations used in the present
work. Red dots are the stations used in the analogous methods and blue ones are the other stations used for developing observed rain-fall charts.
means of establishing statistical relations among past and forecast meteorological situations. The pressure data val-ues are provided by the NCEP-NCAR Reanalysis Project (NNRP). The rainfall database has good coverage over East Catalonia (Fig. 4) with more than 120 stations for an area of 16 000 km2and for the period 1996–2005. This is the period used for the development of the analogous model. For fur-ther details of the applied analogous model see Altava-Ortiz et al. (2006).
Probabilistic outputs are calculated taking into account the best 20 meteorological analogous situations. The in-terpolation (using the kriging procedure) is carried out at 0.04◦
×0.04◦ of grid resolution. Probability of exceedance
124 A. Barrera et al.: Heavy rain prediction using deterministic and probabilistic models
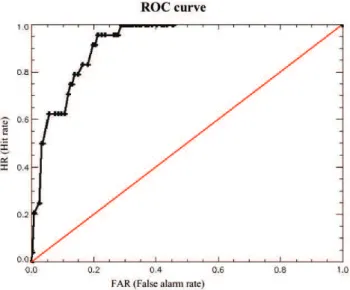
Fig. 5. ROC curve for the highest threshold (precipitation >20 mm
in 24 h) in the statistical analogous method. HR is the hit rates and FAR represents the false alarm rate.
to Average Expected rainfall (AER) and Maximum Expected rainfall (MER) values for each day in the analysed episode have been calculated.
The results obtained in the recently finished INTERREG III-B AMPHORE project1 showed that this method is a good statistical prediction tool. Model reliability has been performed using Receiver Operating Characteristic Curves (ROC curves). A ROC curve for each considered threshold as well as for each station forming the surface rainfall net-work has been calculated. The most interesting result for the current paper is the ROC curve corresponding to the high-est rainfall threshold (Fig. 5). This ROC curve was obtained from averaging the 126 ROC curves associated to each rain-gauge of the observation network for the entire 1996 year, a very rainy year in Catalonia. The greater the area under the curve, the better is the model. A value around 0.95 has been obtained for the 20 mm exceedance rainfall.
3.2 The MM5 model
The MM5 mesoscale model (Grell et al., 1994; Dudhia et al., 2004) is one of the most widely used models by the scien-tific community. This numerical model has been run for a 72 h simulation starting at 00:00 UTC from 11 to 14 Octo-ber 2005. Four two-way nested domains with 54, 18, 6 and 2 km horizontal grid resolution and 23 vertical levels have been used. The outer domain (domain 1) is centred in the NE Spain at geographical coordinate (0.0◦E, 40.0◦N).
Ini-tial and boundary conditions are obtained from the 1◦
reso-lution FNL NCEP analyses (Global Final Analyses from the
1Information concerning AMPHORE project is availabe within
http://amphore.medocc.org/.
US National Centers for Environmental Prediction) available every six hour from 00:00 UTC, which are improved using surface and upper-air observations (ADP, Automated Data Processing observations from the NCEP). This improvement is applied by an objective analysis tool included in the pro-gram scheme of the MM5 model. Full physics is used and a Kain-Fritsch (Kain and Fritsch, 1993) scheme is applied to parameterise convection for the first, second and third do-mains while no convective parameterisation is activated over the fourth domain. Similar parameterisation has been used with good results in other similar extreme meteorological events in the West Mediterranean area (Arreola et al., 2003; Romero et al., 2005).
4 Results and discussion
Figure 6 shows the probability of exceeding 0.5 and 20 mm in 24 h as well as MER on 11 and 13 October, as derived from the analogous method. In general, good agreement among highest probability values and real affected areas can be ob-served. Moreover, in some days, MER distribution shows good agreement with the observed rainfall patterns, although values are usually underestimated. The 11 October is an ex-ception, when the analogous method overestimates them. At this point it should be taken into account that this event was characterised by very heavy rainfall, such events are quite infrequent and thus it is more difficult for the analogous method to reproduce them. In addition in order to further improve the method a much denser pluviometric network is needed.
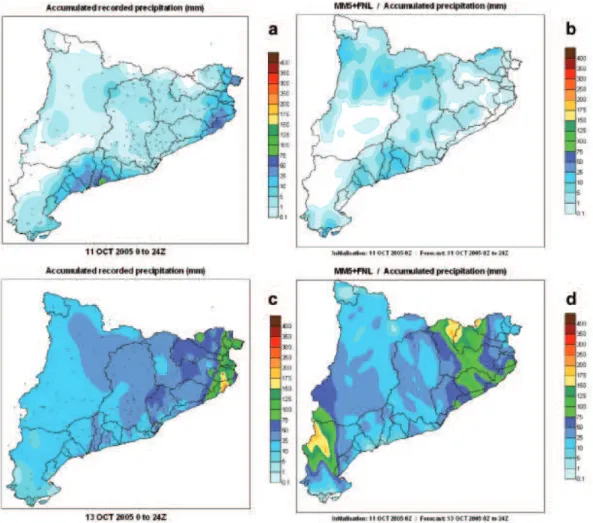
The MM5 simulation allows analysing accurately the main meteorological features with high spatial resolution. The evolution of the 10-m wind field for the 2-km domain shows the formation of different convergence lines at different places of the region. This partially explains the location of rainfall maxima during the event (not shown). These con-vergence lines enhanced the triggering effects of the ranges close to the sea, facilitated the advection of moist air over those zones and implied high values of potential temperature at medium levels (850 hPa). The eastern parts of the Pyre-nees and the Pre-Littoral range plays an important role on the enhancement of precipitation, as in the simulations and observations, all main maxima are recorded in those zones (Fig. 7). In addition, the high spatial resolution used for the MM5 simulations permitted to reproduce the maxima of ac-cumulated rainfall quantities, but their locations are not well-placed (Fig. 7).
With the MM5 outputs, in addition to the analogous method ones, and taking into account the event observations some conclusions appear clearly:
i) Both methods, probabilistic and deterministic, get quite reasonable rainfall forecasts or probability distribution if they are compared with the observations, although
Fig. 6. Probabilistic outputs for the lowest (a and d) and highest (b and e) rainfall thresholds as well as the MER (on 11 October 2005 from
00:00 to 24:00 UTC (upper figures) and on 13 October 2005 from 00:00 to 24:00 UTC (lower figures).
some important disagreements (an important overesti-mation) appear in SW Catalonia.
ii) Whereas the analogous technique tends to underesti-mate the values on rainfall, the MM5 simulation tends to misplace the maxima.
Comparing with the results obtained in the previous work of Altava-Ortiz et al. (2006) other conclusions appear clearly. The analogous model continues underestimating the rainfall field, but the location of maxima is correct.
The analogous method is a first approach, less suitable than deterministic models for the prediction of heavy rain-fall events as statistical models are based on previous events, and extreme events are not so common. However, prob-abilistic outputs from the statistical model combined with the MM5 model outputs provide different products which could be complementary and useful for end-users. The MM5 model output provides a good simulation of the evolution of important meteorological variables and the analogous tech-nique offers good outputs concerning rainfall probabilities and MER but mainly better localisation of the rainfall max-ima compared to MM5 model output.
On the other hand, to improve the observed disagreements, future work is needed in both methods. The MM5 model re-sults could be improved by improving the initial conditions. This could be achieved by using higher resolution initial con-ditions and by improving the first guess fields using lightning and satellite data as it will be done in the European project FLASH. The analogous technique needs a longer
tempo-ral daily rainfall database with a good coverage in the re-gion, and the proof of other effective predictor meteorologi-cal fields.
Acknowledgements. The authors thank the Sixth Framework
Programme European Commission FLASH project (FTS-2005-global-036852) and the European INTERREG III-B AMPHORE project (2003-03-4.3-I-079) for making possible the development of the present work. The authors also thank Meteocat (Catalan Meteorological Service) for its rainfall data and the ACA (Catalan Agency of Water) for the rainfall data from the SAIH network. Edited by: P. Alpert, H. Saaroni, and E. Heifetz
Reviewed by: two anonymous referees
References
Altava-Ortiz, V., Barrera, A., Llasat, M. C., Prat, M. A., Gibergans-B´aguena, J., and Barnolas, M.: Application of the MM5 and the analogous method to heavy rainfall events. The case of 16–18th October 2003 in Catalonia (NE Spain), Adv. Geosci., 7, 313– 319, 2006,
http://www.adv-geosci.net/7/313/2006/.
Arreola, J. L., Homar, V., Romero, R., Ramis, C., and Alonso, S.: Multiscale numerical study of the 10-12 November 2001 strong cyclogenesis event in the western Mediterranean, Proceedings of the 4th EGS Plinius Conference on Mediterranean Storms, Alcu-dia (Spain), 2–4 October 2002, CD-Rom, Sec. 1, 30, 2003. Barnolas Vilad´es, M.: Desarrollo de un sistema ACCESS/SIG
en el ´ambito de las ciencias de la atm´osfera: Estudio de las inundaciones en Catalunya, 1901–2000. Trabajo para la
ob-126 A. Barrera et al.: Heavy rain prediction using deterministic and probabilistic models
Fig. 7. Comparison between observed (a and c) and 2-km resolution MM5 forecasts (b and d) for accumulated daily rainfall for 11 October
2005 from 00:00 to 24:00 UTC (upper figures) and for 13 October 2005 from 00:00 to 24:00 UTC.
tenci´on del Diploma de Estudios Avanzados (DEA), Programa de doctorado de Astronom´ıa y Meteorolog´ıa (Bienio 2002–2004). DAM/250201-05/0409, Internal publication, 2004.
Barnolas, M. and Llasat, M. C.: A flood geodatabase and its clima-tological applications: the case of Catalonia for the last century, Nat. Hazards Earth Syst. Sci., 7, 271–281, 2007,
http://www.nat-hazards-earth-syst-sci.net/7/271/2007/.
Barrera, A., Llasat, M. C., and Barriendos, M.: Estimation of the extreme flash flood evolution in Barcelona County from 1351 to 2005, Nat. Hazards Earth Syst. Sci., 6, 505–518, 2006,
http://www.nat-hazards-earth-syst-sci.net/6/505/2006/.
Dudhia, J., Gill, D., Manning, K., Wang, W., and Bruyere, C.: PSU/NCAR Mesoscale modeling system. Tutorial Class Notes and User’s Guide: MM5 Modeling System Version 3, www. mmm.ucar.edu/mm5/documents/tutorial-v3-notes.html, 2004. Grell, G. A., Dudhia, J., and Stauffer, D. R.: A description of
the fifth-generation Penn State/NCAR mesoscale model (MM5), NCAR Technical Note, NCAR/TN-398+STR, 1994.
Kain, J. S. and Fritsch, J. M.: Convective parameterization for mesoscale models: The Kain-Fritsch scheme, in: The represen-tation of cumulus convection in numerical models, edited by: Emanuel, K. A. and Raymond, D. J., Meteorological Monograph of the American Meteororological Society, 46, 165–170, 1993.
Llasat, M. C., Mart´ın, F., and Barrera, A.: From the concept of “kaltluftropfen” (cold air pool) to the cut-off low. The case of September 1971 in Spain as an example of their role in heavy rainfalls, Meteorol. Atmos. Phys., 96, 43–60, 2007.
Llasat, M. C., Rigo T., and Barriendos, M.: The “Montserrat-2000” flash flood event: a comparison with the floods that have occurred in the northeastern Iberian Peninsula since the 14th century, Int. J. Climatol., 23, 453–469, 2003.
Llasat, M. C., Rigo, T., and Montes, J. M.: Orographic role in the temporal and spatial distribution of precipitation in flood events, Proceedings of the 1st EGS Plinius Conference on Mediterranean Storms, Maratea (Italy), 14–16 October 1999, 41–55, 1999. Llasat, M. C.: La vuln´erabilit´e en Catalogne et la perception sociale,
La Houille Blanche, 6, 71–75, 2004.
Romero, R., Mart´ın, A., Homar, V., Alonso, S., and Ramis, C.: Pre-dictability of prototype flash flood events in the Western Mediter-ranean under uncertainties of the precursor upper-level distur-bance: the HYDROPTIMET case studies, Nat. Hazards Earth Syst. Sci., 5, 505–525, 2005,
http://www.nat-hazards-earth-syst-sci.net/5/505/2005/.