HAL Id: hal-00317688
https://hal.archives-ouvertes.fr/hal-00317688
Submitted on 3 Jun 2005
HAL is a multi-disciplinary open access
archive for the deposit and dissemination of
sci-entific research documents, whether they are
pub-lished or not. The documents may come from
teaching and research institutions in France or
abroad, or from public or private research centers.
L’archive ouverte pluridisciplinaire HAL, est
destinée au dépôt et à la diffusion de documents
scientifiques de niveau recherche, publiés ou non,
émanant des établissements d’enseignement et de
recherche français ou étrangers, des laboratoires
publics ou privés.
VHF volume-imaging radar observation of
aspect-sensitive scatterers tilted in mountain waves
above a convective boundary layer
R. M. Worthington
To cite this version:
R. M. Worthington. VHF volume-imaging radar observation of aspect-sensitive scatterers tilted in
mountain waves above a convective boundary layer. Annales Geophysicae, European Geosciences
Union, 2005, 23 (4), pp.1139-1145. �hal-00317688�
SRef-ID: 1432-0576/ag/2005-23-1139 © European Geosciences Union 2005
Annales
Geophysicae
VHF volume-imaging radar observation of aspect-sensitive
scatterers tilted in mountain waves above a convective boundary
layer
R. M. Worthington1,2,3
1Institute of Mathematical and Physical Sciences, University of Wales, Aberystwyth, SY23 3BZ, UK 2Radio Science Center for Space and Atmosphere (RASC), Kyoto University, Uji, Kyoto 611-0011, Japan
3School of Earth, Atmospheric and Environmental Sciences, Univ. of Manchester, P.O. Box 88, Manchester, M60 1QD, UK
Received: 13 August 2004 – Revised: 15 March 2005 – Accepted: 22 March 2005 – Published: 3 June 2005
Abstract. Thin stable atmospheric layers cause VHF radars
to receive increased echo power from near zenith. Layers can be tilted from horizontal, for instance by gravity waves, and the direction of VHF “glinting” is measurable by spatial do-main interferometry or many-beam Doppler beam swinging (DBS). This paper uses the Middle and Upper atmosphere (MU) radar, Shigaraki, Japan as a volume-imaging radar with 64-beam DBS, to show tilting of layers and air flow in moun-tain waves. Tilt of aspect-sensitive echo power from hor-izontal is nearly parallel to air flow, as assumed in earlier measurements of mountain-wave alignment. Vertical-wind measurements are self-consistent from different beam zenith angles, despite the combined effects of aspect sensitivity and horizontal-wind gradients.
Keywords. Meteorology and atmospheric dynamics
(Con-vective processes; Waves and tides). Radio science (Instru-ments and techniques)
1 Introduction
Echo power of VHF atmospheric radar is often increased in beams pointing near zenith (“aspect sensitivity”), because of thin stable layers or anisotropic turbulence. The diffuse glint-ing pattern of VHF echo power can also be tilted from zenith, when atmospheric layers are tilted from horizontal (Gage et al. 1981; Tsuda et al. 1997; Worthington 1999a), for instance by mountain waves.
Since VHF aspect-sensitivity is caused by atmospheric stability layered on vertical scale ∼3 m, which is typically less than ∼0.2% of mountain-wave vertical wavelengths, thin glinting layers could act as tracer of air flow through a wave pattern, without modifying the waves. Isotropic echo power
Correspondence to: R. M. Worthington
has been assumed a tracer, showing streamlines of air flow tilted from horizontal in mountain waves (Starr and Brown-ing 1972). However, it is unclear if thin stable layers simi-larly follow the streamlines of mountain-wave airflow, which is an assumption for measurements of mountain-wave align-ment and launching height (Worthington 1999a,b, 2002). Vertical shear of horizontal wind also can cause skewing of the echo power pattern (Worthington and Thomas 1996; Ya-mamoto et al. 2003; Hirono et al. 2004).
This paper uses a simple DBS (Doppler beam swinging) method of volume-imaging, to measure the tilting of VHF glinting patterns in three dimensions, and check if thin stable layers remain parallel to air flow in mountain waves (Wor-thington 1999a,b, 2002). Figure 1 shows the MU radar in a 64-beam DBS mode; 63 beams are plotted since there is a duplicate vertical. The beam transmitted by the entire radar array switches direction every 400 µ s to volume-image the atmosphere, with range resolution 150 m and transmitted beamwidth 3.6◦. Measurement time is 64 beams ×400 µ s
inter-pulse-period ×1 incoherent integration ×2 coherent in-tegrations ×128 FFT points=6.55 s. The MU radar mode is identical to 15–16 July 2002 in Worthington (2004). Volume-imaging refers only to three-dimensional measurement of at-mosphere, not e.g. multiple-frequency or multiple-receiver radar interferometric methods. For routine long-term mea-surements of mountain-wave alignment, 5-beam data may be more practical than many-beam data, due to lesser require-ments for transmitter power, computer processing and file storage. However, 5-beam measurements use significant as-sumptions, which are checked for the first time in this paper using many-beam data.
2 Observations
Figure 2 shows height-time plots, 07:43 JST 12 December – 00:04 JST, 13 December 2002, for ∼1–5 km AGL (above
1140 R. M. Worthington: VHF volume-imaging radar observation of aspect-sensitive scatterers
Fig. 1. Three-dimensional view of the MU radar (34.85◦N, 136.10◦E) in a volume-imaging mode with 64 beams at 0◦, 2◦, 4◦, 6◦, 8◦, 10◦, 14◦, 20◦, 30◦from zenith. Dots are beam directions, dashed lines are 150-m range gates, grey lines are at constant range from the radar, with circular grey lines at constant zenith angle, and shaded surface is land height. Azimuth separation of the grey lines across zenith is 15◦.
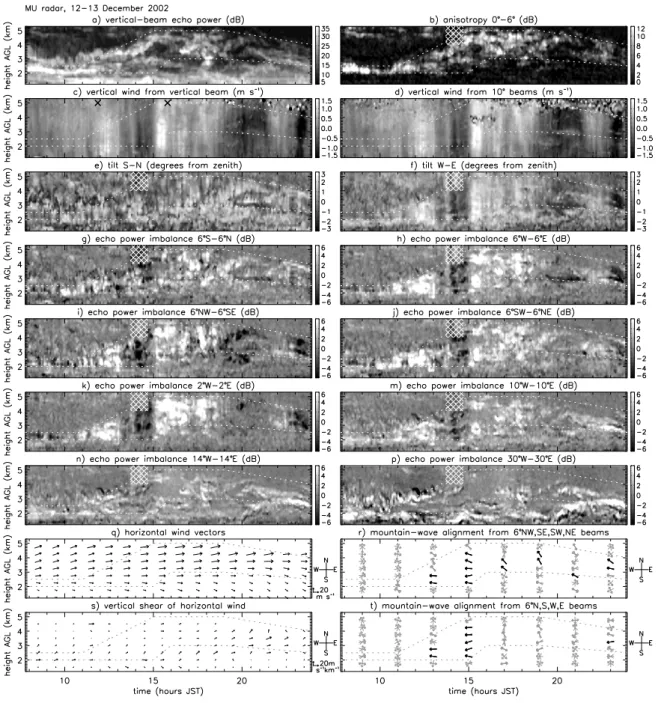
ground level) where there is significant echo power, Fig. 2a, and aspect sensitivity, Fig. 2b. Japan Standard Time (JST) is UTC +9 h. Vertical wind (W ) is measured using vertical beam, Fig. 2c, and symmetric pairs of beams 10◦off zenith, Fig. 2d e.g. W10=12(vn+vs)/cos 10◦ or 12(ve+vw)/cos 10◦
or 14(vn+vs+ve+vw)/cos 10◦where vn, vs, ve, vware
line-of-sight velocities in beams 10◦ off zenith toward north, south, east and west.
Non-zero W measured by MU radar has been attributed to heirarchical structures of cyclones (Shibagaki et al. 1997) and jet stream circulations (Takayabu et al. 2000). However,
W as in Figs. 2c and d – tens of cm s−1and slowly vary-ing over many hours – is consistent with mountain waves (Sato 1990) or convection waves in summer (Sato 1992) above the mountains surrounding the MU radar, and moun-tain waves can be very similar to convection waves (Wor-thington 2002). Figure 2 is measured in winter, Fig. 3d show-ing surface temperature ∼0–5◦C and no diurnal, convective variation of surface wind speed or variance as in e.g. Fig. 3c of Worthington (2004). Nevertheless, radiosondes show a convective boundary layer to ∼1.3 km AGL in Figs. 3a and b, inferred from near-adiabatic lapse rate and high humidity be-low temperature inversions and be-lower humidity1. Also, mov-ing echo-power patterns in Fig. 4b are similar in appearance to those in cloud or convection, Figs. 5 and 6 of Worthing-ton (2004). Figures 2c and d show little phase variation of
W with height, as if vertical wavelength is many kilometres
1In Fig. 4a of Worthington (2004), radiosonde heights are above
sea level instead of ground level, and should be shifted down
∼0.4 km for comparison with radar heights.
or infinite since mountain waves are trapped. Brunt-V¨ais¨al¨a frequency is non-zero above ∼1 km in Fig. 3 and horizontal wind speed increases rapidly with height, implying Scorer parameter decreasing with height, consistent with mountain waves trapped above the convective boundary layer.
Mountain waves tilt air flow and also aspect-sensitive lay-ers from horizontal, shown by imbalances of echo power us-ing 5-beam radar (Worthus-ington, 1999a). Tilt of the aspect-sensitivity pattern can be measured using spatial domain in-terferometry (Hobbs et al. 2000) or many-beam DBS (Palmer et al. 1998). Figures 2e and f show tilt from zenith, from a weighted mean of echo power above isotropic level (e.g. beams shown as red dots in Fig. 4a, with mean tilt as blue
×, for 100 of 8981 volume images), using beams 0◦–6◦ from zenith, although 0◦–8◦or 0◦–10◦gives similar results. Isotropic echo-power level is estimated as the median of each horizontal map (with 0.5 dB subtracted for Figs. 2e and f, so echo-power tilt tends more smoothly to zero for nearly isotropic conditions, where tilt is noisy since random beams have echo power above isotropic level). Echo power maps are linearly interpolated to constant height for each beam without small-angle approximations for Figs. 2e and f, 4, 5g, h and k–n. Tilt is defined as positive to west and south (caused by aspect-sensitive layers tilted downward to west and south) to have the same, not opposite sign as W in Figs. 2c and d, 5a–f.
Correlation of W (Figs. 2c and d) to aspect-sensitive tilt (Fig. 2f) has been interpreted as tilted aspect-sensitive scat-terers causing a vertical radar beam to point effectively off-vertical, measuring a component of horizontal wind, whereas real W is near zero or opposite sign (Larsen and R¨ottger 1991; Palmer et al. 1998; Kawano et al. 2001). However
W agrees in Figs. 2c and d, except for noise caused by weaker signal/noise ratio in Fig. 2d. With increasing off-zenith angle of symmetric beams, aspect sensitivity is often less significant for wind measurements, and horizontal gradi-ents of wind field more significant; these effects could coun-teract so W measured at any zenith angle is consistent yet wrong. However, a simpler explanation is that measured W in Figs. 2c and d is mostly real, with e.g. mountain waves causing both the non-zero W and tilt (R¨ottger 2000; Wor-thington et al. 2001)
Figures 2g–p show echo-power imbalances (EPI) from 8 of 23 symmetric beam pairs in Fig. 1. Aspect-sensitive tilt and EPI may be proportional (Hobbs et al. 2000), EPI val-ues for any given tilt angle in Fig. 2f depending on aspect-sensitivity in Fig. 2b. West-east components of tilt and 6◦ EPI (Figs. 2f and h) are similar and more correlated to
W than south-north components (Figs. 2e and g), consis-tent with aspect-sensitive layers tilted west-east, and causing EPI also in northwest-southeast and southwest-northeast az-imuths (Figs. 2i and j). Similar correlation of W and EPI shown by Worthington (1999a) is for a different location and radar system, suggesting a real radar-atmospheric effect rather than radar problems.
EPI for west-east 10◦ beams in Fig. 2m is mostly smaller and patchier, compared to smaller zenith angles in
Fig. 2. Height-time plots of (a) vertical-beam echo power; (b) anisotropy, vertical minus mean 6◦echo power; (c, d) vertical wind measured by vertical and symmetric 10◦beams, × shows times of radiosondes in Figs. 3a and b; (e, f) tilt of aspect-sensitive echo power from zenith, with positive tilt defined as to (e) south and (f) west; (g–p) echo power imbalances (EPI) between symmetric pairs of radar beams at 2◦, 6◦, 10◦, 14◦, 30◦zenith, the hatched pattern in Figs. 2b, e–p covers radio-frequency interference; (q, s) vectors of (q) horizontal wind and (s) vertical shear of horizontal wind; (r,t) alignment of horizontal wavevector of mountain waves, using EPI from (i, j) and (g, h), black arrows showing |W |>0.2 ms−1and azimuth error <12◦. Identical dotted lines in (a)−(t) show the approximate region of aspect sensitivity in (b), which is the most relevant area in (e–m).
Figs. 2h–k, as expected since aspect sensitivity can be near to isotropic at 10◦zenith. This is consistent with compar-isons of 3.6◦and 10.8◦zenith in Hobbs et al. (2000). EPI for west-east 4◦and 8◦beams (not shown) is intermediate to 2◦, 6◦, 10◦in Figs. 2h, k and m.
At larger zenith angles (Figs. 2n and p) there is a differ-ent pattern, explainable by horizontal variability of isotropic echo power. For Fig. 2n, west and east echo powers are
averages of beams at 14◦ zenith and ±15◦ azimuth from west and east, to allow an approximate comparison with Figs. 2h,k,m,p. EPI between symmetric 14◦ beams in az-imuths W15◦N−E15◦S and W15◦S–E15◦N (not shown) are both similar to their average in Fig. 2n. W15◦N means an azimuth rotated 15◦toward north from west; E15◦S, W15◦S and E15◦N use similar notation. For symmetric 30◦beams (Fig. 2p), EPI has a similar pattern to Fig. 2n with larger
1142 R. M. Worthington: VHF volume-imaging radar observation of aspect-sensitive scatterers
Fig. 3. (a) squared Brunt-V¨ais¨al¨a frequency, (b) relative humidity and temperature from radiosondes launched 1152 and 1548 JST at the MU
radar site; (c) horizontal wind speed and direction measured 1000–2000 JST, ∼1–5 km AGL, by the MU radar; (d) surface weather at the MU radar site; dots are 5-s time averages, with a 10-min running median overplotted of horizontal wind speed and direction.
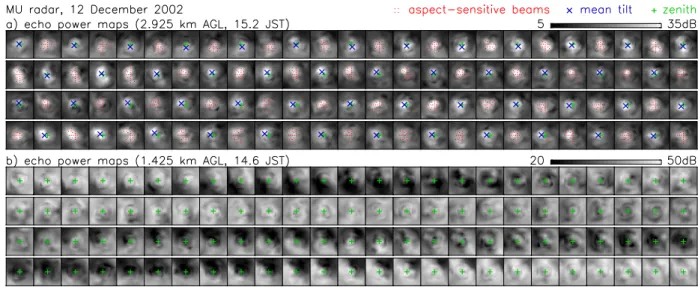
Fig. 4. Horizontal maps of clear-air echo power at heights of (a) aspect-sensitive and (b) convective echoes. Alternate maps in (a) are
overplotted with radar beam directions of increased echo power caused by aspect sensitivity (groups of red dots), and mean echo-power tilt from these beams (blue ×). Time step is 6.55 s, starting top-left, north is at the top of each plot, zenith is marked as green +, and horizontal width is (a) 1460 m, (b) 710 m.
amplitude. Horizontal separation of 30◦beams is more than their height AGL, which is unusual for MST radar, and nearer to the beam geometry used by e.g. weather radars, where beam tilt is often measured upward from the ground instead of from zenith.
Figures 2q and s show horizontal wind and its vertical shear, and Figs. 2r and t show mountain-wave alignment from different symmetric pairs of 6◦ beams (Figs. 2g–j) to check their self-consistency, with arrows plotted darker where |W |>0.2 m/s and azimuth error <12 deg as used in Figs. 5–10 of Worthington (1999b). Mountain-wave align-ment is near west, roughly opposite to the background wind,
or northwest at 17–20 JST. Time resolution of 2 h for Figs. 2r and t is because a few hours is usually necessary for a mountain-wave pattern to shift phase enough, that the result-ing variations of W and EPI allow measurement of the wave alignment (Worthington, 1999a).
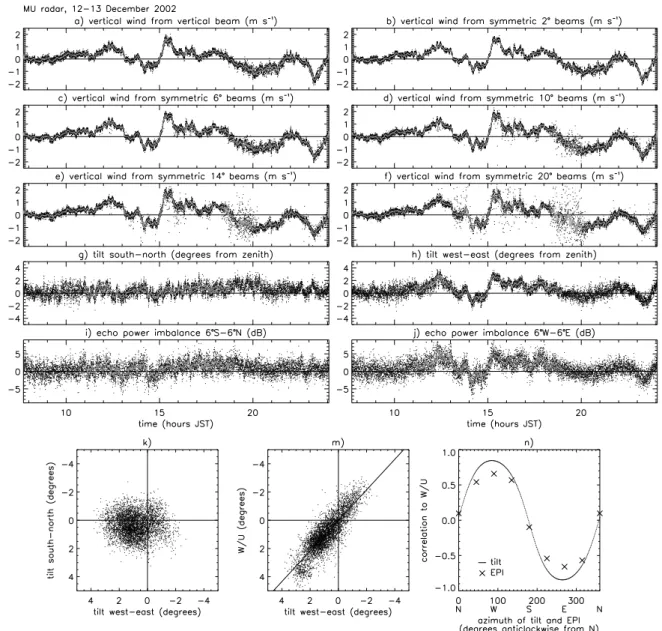
Time series of W , tilt and EPI, Figs. 5a–j, show data in Fig. 2 more quantitatively. Similar W is measured with beams 0◦–20◦off zenith (except for noise, e.g. 19–20 JST in Fig. 5f), despite the varying relative importance of aspect sensitivity and horizontal separation of beams, as a func-tion of beam zenith angle. W in Figs. 5a–f is measurable in both isotropic and aspect-sensitive conditions (Fig. 2b),
Fig. 5. (a–f) Vertical wind measured by 0◦, 2◦, 6◦, 10◦, 14◦and 20◦beams; (g, h) tilt of aspect-sensitive echo power; (i, j) EPI between symmetric beams. (a–j) are averaged 2–4 km AGL where mountain waves are nearly constant with height in Figs. 2c and d. Measuring time of each dot is 6.55 s, and a 5-min running mean is overplotted; (k) scatterplot of tilts (g, h); (m) scatterplot of zonal tilt of air flow and aspect-sensitive echo; (n) correlation of 6◦EPI and aspect-sensitive tilt, as a function of azimuth, to zonal tilt of airflow. (k–n) are for 11–19 JST, when there is aspect-sensitive tilt and EPI.
however tilt is meaningful in aspect-sensitive conditions, ap-proximately within dotted lines in Fig. 2, or for aspect sen-sitivity more than some value, e.g. 5 dB (the exact value is arbitrary). Figures 5g,h,k-n use heights with aspect-sensitive echo power >5 dB above isotropic, since inclu-sion of isotropic data with zero mean tilt alters the slope of Fig. 2m, which is used quantitatively to check if air flow and layers are parallel.
Figure 5k shows south-north and west-east tilts from Figs. 5g and h as a scatterplot. Although tilts are more west-east than south-north, there is substantial south-north scatter explainable since mountain-wave patterns vary along horizontal phase lines, e.g. varying wave-cloud thickness in
satellite images, or “pile of plates” wave clouds. The 6.55 s measurement time of each dot is only ∼1% of Brunt-V¨ais¨al¨a period, or ∼0.1% of mountain-wave timescales of hours in Figs. 2c and d. However, even at 6.55 s time resolution, west-east tilt of aspect sensitivity shows high correlation to the zonal tilt of air flow (ratio of vertical and zonal wind,
W/U), in Fig. 5m. Slope near to 1 in Fig. 5m implies aspect-sensitive scatterers are tilted near parallel to air flow2. Fig-ure 5n shows correlation of zonal air flow tilt to azimuthal
2In Figs. 3b, 4b, 5b of Worthington et al. (2000), there is +0.25
ms−1error of radial velocity for all beams, wrongly implying air flow tilted ∼0.5◦from horizontal; real W near zero is more consis-tent with echo power centred near zenith in Fig. 4a.
1144 R. M. Worthington: VHF volume-imaging radar observation of aspect-sensitive scatterers
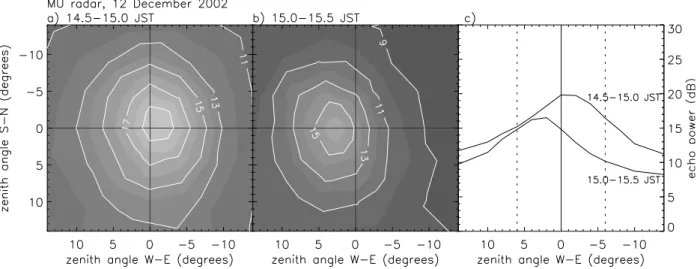
Fig. 6. (a, b) Pair of echo power maps, in dB, their tilt from zenith moving several degrees east to west as mountain waves change phase in
Figs. 2c and d; (c) cross-sections of (a, b), west-east through zenith, vertical dotted lines showing 6◦zenith used in Figs. 2r and t. (a–c) are averaged 2–4 km AGL.
components of tilt and EPI, measured anticlockwise from north for consistency with Figs. 5g–m. Maximum correla-tion of 0.8 is for approximately west-east tilt as in Fig. 5m.
Long-term measurements of mountain-wave alignment similar to Figs. 2r and t from 5-beam radar (Worthing-ton 1999a,b, 2002) imply mountain waves can be launched slightly above the mountains, with horizontal wavevector aligned parallel to boundary-layer airflow, instead of per-pendicular to two-dimensional mountain ridges, and can be similar to convection waves. However, measuring wave alignment uses assumptions, e.g. horizontal wavelength of mountain waves is several times radar beam separation; echo power maps are simply tilted, unmodified, a small angle from zenith in mountain waves; occurrence of aspect sensi-tivity is independent of mountain-wave properties for small-amplitude waves; and echo power varies on average linearly over small ranges of beam zenith angle.
R¨ottger (2003, Fig. 2) shows radar beams 23◦off zenith, pointing into different phases of a mountain wave, measuring different wind vectors and tilts. Figures 2n and p show effects of such horizontal variability at 14◦ and 30◦ zenith; how-ever mountain-wave EPI caused by aspect-sensitivity is near zero at these zenith angles. Figures 2r and t and Worthing-ton (1999a,b) use zenith angle of only 6◦, where
mountain-wave EPI is large amplitude in Figs. 2g–j (due to large echo-power gradient with zenith angle, e.g. Fig. 6) and tal separation of beams is much less than typical horizon-tal wavelengths of mountain waves (Worthington, 1999a, Fig. 11). R¨ottger (2003, Figs. 7 and 8) also suggests scatterer tilt can be unrelated to airflow tilt. For instance, anisotropic turbulence could remain horizontally stratified or tilt parallel to air flow from horizontal. Mountain-wave alignment mea-surements in Worthington (1999a,b, 2002) are independent of the exact small tilt angle of layers from horizontal, only as-suming that layers are tilted in the same azimuth as mountain
waves. Nevertheless, Fig. 5m shows almost parallel tilting of layers and airflow from horizontal. A possibility remains of e.g. stratiform cloud layers or temperature inversions already tilted in one azimuth, then tilted also in a different azimuth by mountain waves.
Worthington (1999a) assumes echo power has the same linear dependence on zenith at any azimuth, for aspect sen-sitivity tilted only a small angle from horizontal. Figure 6 shows a counter-example, with larger tilt >1◦, and echo-power gradients different in symmetric 6◦ beams, Fig. 6c. However this is consistent with limitations already consid-ered in Worthington (1999a), which although serious for short-term measurements of wave alignment, should produce no long-term rotational bias. Also, short-term measurements are accurate every 45◦ by symmetry (Worthington 1999a,
Appendix), and show continuity for azimuth resolution less than 45◦(Worthington 1999b, Figs. 6 and 8).
3 Conclusions
Volume-imaging radar shows VHF aspect-sensitive echoes tilted in air flow through mountain waves. Vertical wind mea-surements from beams 0◦–20◦off zenith are self-consistent.
Aspect-sensitive layers tilted by mountain waves cause echo-power imbalances between symmetric beams up to ∼10◦off
zenith. Thin stable layers are tilted from horizontal approx-imately parallel to the air flow, as assumed in using 5-beam VHF radar to measure mountain-wave alignment.
Acknowledgements. The author was funded by Japan Society for
the Promotion of Science, April 2001–March 2003 at Radio Sci-ence Center for Space and Atmosphere (now Research Institute for Sustainable Humanosphere), Kyoto University, Kyoto, Japan.
Topical Editor U.-P. Hoppe thanks two referees for their help in evaluating this paper.
References
Gage, K. S., Carter, D. A., and Ecklund, W. L.: The effect of gravity waves on specular echoes observed by the Poker Flat MST radar. Geophys. Res. Lett., 8, 599–602, 1981.
Hirono, M., Luce, H., Yamamoto, M., and Fukao, S.: Horizontal maps of echo power in the lower stratosphere using the MU radar. Ann. Geophys., 22, 717–724, 2004.
Hobbs, B. G., Reid, I. M., and Holdsworth, D. A.: Evidence of tilted layers in angle of arrival and Doppler beam steering power measurements. Radio Sci., 35, 983–997, 2000.
Kawano, N., Luce, H., Yamamoto, M., and Fukao, S.: Tilted atmo-spheric layer and gravity wave studies by simultaneous DBS/SDI observations with the MU radar during the passage of a trough. Radio Sci., 36, 67–77, 2001.
Larsen, M. F., and R¨ottger, J.: VHF radar measurements of in-beam incidence angles and associated vertical-in-beam radial ve-locity corrections. J. Atmos. Ocean. Technol., 8, 477–490, 1991. Palmer, R. D., Larsen, M. F., Fukao, S., and Yamamoto, M.: On the relationship between aspect sensitivity and spatial interfero-metric in-beam incidence angles. J. Atmos. Sol.-Terr. Phys., 60, 37–48, 1998.
R¨ottger, J.: ST radar observations of atmospheric waves over moun-tainous areas: a review, Ann. Geophys., 18, 750–765, 2000. R¨ottger, J.: The inclination of reflectivity stratifications.
Proceed-ings of the 10th workshop on technical and scientific aspects of MST radar, Piura, Peru, 13–20 May 2003, 306–309, 2003. Sato, K.: Vertical wind disturbances in the troposphere and lower
stratosphere observed by the MU radar. J. Atmos. Sci., 47, 2803– 2817, 1990.
Sato, K.: Vertical wind disturbances in the afternoon of mid-summer revealed by the MU radar. Geophys. Res. Lett., 19, 1943–1946, 1992.
Shibagaki, Y., Yamanaka, M. D., Hashiguchi, H., Watanabe, A., Uyeda, H., Maekawa, Y., Fukao, S.: Heirarchical structures of vertical velocity variations and precipitating clouds near the Baiu frontal cyclone center observed by the MU and meteorological radars. J. Meteorol. Soc. Japan., 75, 569–596, 1997.
Starr, J. R. and Browning, K. A.: Observations of lee waves by high-power radar. Q. J. R. Meteorol. Soc., 98, 73–85, 1972. Takayabu, I., Yamanaka, M. D., and Fukao, S.: A mechanism for
the reversal of long-term average vertical velocities around east Asia during the cold season. J. Meteorol. Soc. Japan., 78, 13–23, 2000.
Tsuda, T., Gordon, W. E., and Saito, H.: Azimuth angle varia-tions of specular reflection echoes in the lower atmosphere ob-served with the MU radar. J. Atmos. Sol.-Terr. Phys., 59, 777– 784, 1997.
Worthington, R. M.: Calculating the azimuth of mountain waves, using the effect of tilted fine-scale stable layers on VHF radar echoes. Ann. Geophys., 17, 257–272, 1999a.
Worthington, R. M.: Alignment of mountain wave patterns above Wales: A VHF radar study during 1990–1998. J. Geophys. Res., 104, 9199–9212, 1999b.
Worthington, R. M.: Mountain waves launched by convective activ-ity within the boundary layer above mountains. Boundary-Layer Meteorol., 103, 469–491, 2002.
Worthington, R. M.: All-weather volume imaging of the boundary layer and troposphere using the MU radar. Ann. Geophys., 22, 1407–1419, 2004.
Worthington, R. M. and Thomas, L.: The measurement of gravity-wave momentum flux in the lower atmosphere using VHF radar. Radio Sci., 31, 1501–1517, 1996.
Worthington, R. M., Muschinski, A., and Balsley, B. B.: Bias in mean vertical wind measured by VHF radars: Significance of radar location relative to mountains. J. Atmos. Sci., 58, 707–723, 2001.
Worthington, R. M., Palmer, R. D., Fukao, S., Yamamoto, M., and Astin, I.: Rapid variations in echo power maps of VHF radar backscatter from the lower atmosphere. J. Atmos. Sol.-Terr. Phys., 62, 573–581, 2000.
Yamamoto, M. K., Fujiwara, M., Horinouchi, T., Hashiguchi, H., and Fukao, S.: Kelvin-Helmholtz instability around the tropi-cal tropopause observed with the Equatorial Atmosphere Radar. Geophys. Res. Lett., 30, 1476, 2003.