by Ryan TerBush
S.B., Electrical Engineering and Computer Science, M.I.T., 2012 Submitted to the Department of Electrical Engineering
and Computer Science
in Partial Fulfillment of the Requirements for the Degree of Master of Engineering in Electrical Engineering and Computer
Science
at the Massachusetts Institute of Technology iIay 2013
@2013
Massachusetts Institute of Technology. All rights reserved. The author hereby grants to M.I.T. permission to reproduce andto distribute publicly paper and electronic copies of this thesis document in whole and in part in any medium now known or
hereafter created.
Author:
Certified by:
Certified by:
Accepted by:
Department of Electrical Enginfering and Computer Science May 20, 2013
Christopher Terman, Verkoftecturer of EECS Thesis Co-Supervisor
May 20, 2013
Chris Busick, S-nior Engineer, NetApp V-Series Thesis Co-Supervisor May 20, 2013
Prof. Dennis M. Freeman Chairman, Masters of Engineering Thesis Committee May 20, 2013 1
by
Ryan TerBush
Submitted to the Department of Electrical Engineering and Computer Science
May 20, 2013
In Partial Fulfillment of the Requirements for the Degree of Master of Engineering in Electrical Engineering and Computer
Science
Abstract
As data growth continues to accelerate, so must performance and efficiency of large scale storage systems. This project will present the implementation and performance analysis of Multi-Path I/O within Data ONTAP. The goal of this feature is to take advantage of redundant paths that were previously utilized only in failure situations. The paper will address the core mechanisms that comprise the MPIO handling within the system. Furthermore it will present the difficulties of testing such a feature in a shared lab environment. The initial expectation that MPIO would provide a small performance gain, in addition to better failure handling properties, was affirmed in the results. Under heavy I/O loads, MPIO systems showed an average of 5% throughput improvement over the older single-path implementation.
" Array: The third party storage device on which the back-end storage resides " Controller: the device running Data ONTAP that routes I/O, see also, Node * Fibre Channel (FC): the protocol used to communicate to back-end arrays
" Initiator Port: the port on the NetApp controller through which I/O flows to the back-end
" I/O: Input/Output, used to describe reading/writing * IOP: an individual Input/Output operation
" MPIO: Multi-Path I/O, the feature being implemented in this paper " Node: another terms used to refer to a NetApp controller
" SPIO: Single path I/O
" Switch: a device that routes I/O along preconfigured paths
" Target Port: the port on the back-end storage array through which incoming I/O flows
* V-Series: the version of NetApp controller that can utilize third-party arrays as back-end storage
1 Introduction
1.1 Problem . . . . 1.2 Background . . . . 2 Single Path vs. Multi-Path
2.1 Load Balancing . . . . 3 Simulation 3.1 Simulation Pseudocode . 4 MPIO Implemenation 4.1 Counters . . . . 4.2 Rolling Averages . . . . . 4.3 Registration/Reservations 5 Performance Testing 5.1 D esign . . . . 5.2 Testing Pseudocode . . . . 5.2.1 Example of polling command and result 5.3 Load Generation . . . . 6 Results 6.1 Preliminary Results 6.2 Final Results . . . . 7 Discussion 8 Conclusion 9 Future Work 10 Acknowledgments 11 11 11 15 17 18 20 21 21 22 24 26 29 30 31 32 34 34 38 44 47 48 50 7
1 NetApp hardware configuration . . . . 13
2 V-Series hardware configuration . . . . 14
3 SPIO vs. M PIO . . . . 16
4 Rolling Average . . . . 23
5 Effect of Changing Alpha. . . . . 23
6 Early Result Numbers . . . . 35
7 Result Numbers with External Load Disabled . . . . 38
8 Result Numbers on Isolated EMC Symmetrix on 4 Paths . . . . 40
9 Graphs: 4 Path 2 Target Port . . . . 41
10 Result Numbers on Isolated EMC Symmetrix on 2 Paths . . . . 42
11 Graphs: 2 Path 2 Target Port . . . . 42
12 Result Numbers on Isolated EMC Symmetrix on 2 Paths and 1 Target Port. 43 13 Graphs: 2 Path 1 Target Port . . . . 44
14 Graphs: Aggregate Results . . . . 45
1.1
Problem
The purpose of this investigation is to determine the performance benefits, if any, of Multi-path I/O over Single Multi-path I/O routing in Data ONTAP. The benefits of the multi-Multi-path implementation include increased fault-tolerance and availability, as well as improved per-formance in the event of a failure. In general, reliability is a tradeoff for perper-formance, but this is not always the case. It is anticipated that within Data ONTAP, MPIO will also increase performance under normal operation. Performance increases due to MPIO have been observed in other systems
[1].
Testing this hypothesis will be a significant portion of this project. The MPIO implementation uses a suite of newly added counters that pas-sively gather statistics about the past and current state of the system. The testing of MPIO will additionally test these counters at a system level, as the routing decisions it makes are dependent on their values.1.2
Background
As of 2010, society was estimated to produce about an exabyte of data per day
[2].
This is a staggering amount of data, and a significant fraction must be stored on durable media. This data explosion has prompted the similarly explosive growth of the large scale storage industry, in which NetApp plays an integral role. Currently, NetApp is researching new ways to efficiently store data, as well as facilitate the access of stored data with minimal latency. This must be done in a way that preserves the valuable properties of durability and availability, since data loss can have steep legal and financial implications. Storage is considered durable if all data that has been entered persists through outages, including system crashes, power failures, and network failures. Availability refers to a systems abilityto continue to store and serve data in the face of the aforementioned failures. It is often the case that performance is a tradeoff with these two properties, caused primarily by the limitation that durable media (disks, tapes, etc.) are typically slow compared to faster, non-persistent options such as RAM. It is common for higher level performance features, such as deduplication, to rely heavily on low-level reliability [4].
The mechanism under examination in this thesis is one of the many components of the system that must deal with the performance vs. reliability tradeoff. It involves some of the low-level I/O drivers in NetApps proprietary operating system, Data ONTAP. In the big picture, Data ONTAP is responsible for the majority of the high availability aspects of the system, as well as performance and compression. It takes advantage of WAFL, the Write Anywhere File Layout, to increase read/write performance, and to reduce recovery time. While this project will not directly deal with WAFL, aspects of WAFL may become important in explaining I/O behavior under certain loads. Data ONTAP is also responsible for various caching schemes to further accelerate read/write performance.
Knowledge of the typical NetApp architecture is necessary to understand the changes to the routing scheme and how performance is being measured. A typical configuration can be seen in Figure 1. Redundancy is a major theme in most configurations as it almost directly leads to higher availability. Each controller has a failover partner that takes over should it go down. All data is accessible via multiple paths to provide tolerance to single port/connection failures. The extra paths will prove to be the key for the proposed changes to I/O routing, as they currently remain unused except in failure cases. The controllers provide a layer of abstraction over the disks, allowing the users accessing them to view their available space as customized pools of memory rather than individual disks.
The V-Series team pushes the abstraction even further, enabling the use of third party storage arrays on the back end rather than just disk shelves. This is achieved through the partitioning of the arrays as logical disks, which are then treated similarly to their
Host 1 Host 2 Host N
SWftWh~bftI1 Switehfebr 2
Cnr r1 AcieShelves
CNN*Oaer2Aedv* Shelves
Figure 1: An example of a typical NetApp hardware configuration
physical counterparts. V-Series configurations run specialized software on the controllers, which contain the logic to interface with different third party arrays. Third party arrays sometimes exhibit different behavior than disk shelves when used in this manner, primarily because they are additionally running their own software. This is part of the motivation for recording the performance characteristics of these systems.
The V-Series configuration can be seen in Figure 2. The NetApp V-Series controller at the center of the image is designed to communicate with many different types of front end via various communication protocols. The storage units are also denoted in the figure, which shows that volumes are built upon aggregates, and aggregates are built upon the units of
storage connected on the back end. The primary difference between this figure and Figure 1 is what is connected to the back end. For a V-Series system, rather than NetApp disk shelves, third party arrays are connected, either directly to the V-Series controller or through switches. Switches are typically deployed on the back end for a few reasons. One reason is to provide several paths between the controller and storage arrays. This additional redundancy
is added for the purpose of increased availability. Another reason is that adding switches expands the number of ports available for connecting storage arrays. This is useful in a deployed environment if the customer needs more storage than a single array can provide, or if a customer wants the performance benefits of running multiple storage arrays in parallel. It also has uses in a development environment, because with clever zoning, it is possible for multiple front ends to share storage on a limited number of back end systems. The implications of this configuration will be discussed later in the paper.
Fibre [SCSI CIFS NFS L.AN
Channel
EMC2 FU H5U 3PAR
2
Single Path vs. Multi-Path
Both single path and multi-path I/O routing refer to the transfer of I/O from the NetApp controller to the third-party storage arrays on the back-end. The problem becomes inter-esting when the arrays are connected through switches, which can be configured to provide multiple redundant paths between the two. In the context of single or multi-path I/0, a path refers to a physical route from an initiator port on the NetApp controller to a target port on the storage array. The connection does not have to be direct, it could traverse a fibre channel switch. Such a path consists of a physical connection from initiator port to the front end of the switch, a switch zone that allows the front and back end switch ports to communicate, and a physical connection from the back-end port of the switch to the target port of the array.
Previous versions of Data ONTAP used only single path I/O, or SPIO, routing algorithms. This algorithm runs in a module called the routing administrator, or RA. The role of the routing administrator is to maintain the list of paths available for use, and to decide which path to use when an I/O needs to be sent to the back-end storage. When making this decision, the RA must consider what logical unit number, or LUN, the I/O is destined for, so that it can send it on a path that ends at the correct target port of the storage array. LUNs are the equivalent for storage arrays what disks are for disk shelves. They are logical devices that can be pooled together to form aggregates, volumes, etc. The configuration of the storage array allows for only certain LUNs to be presented to a given target port, so the RA must be aware of which LUNs are reachable with each path. The single path nature of the routing algorithm comes from the fact that the RA stores a primary path to each LUN,
and that path will always be used to reach that LUN. It is only when the primary path is unresponsive that it will redefine the primary path as one of the alternatives, if any exist.
limited to, failure at the initiator port of the controller, a link failure on the fibre connecting controller to switch, or switch to storage array, switch zoning errors or reboots, and array target port failures. Certain errors have a bigger impact on the system. For example, a link failure may only bring down one path, but a switch reboot would result in all paths through that switch disappearing for a period of time. The redundancy of hardware in the system generally means that even in the face of such failures, the system will continue to operate, though possibly at slightly reduced capacity. In the context of the routing algorithm, the redundancy means that, given a single failure, there will still be a path available to any LUN for use as the new primary path.
OP for LUN *X"
loP for LUN 'Y
Heavy 1RO LUN Low IlO LUN Array Target Po
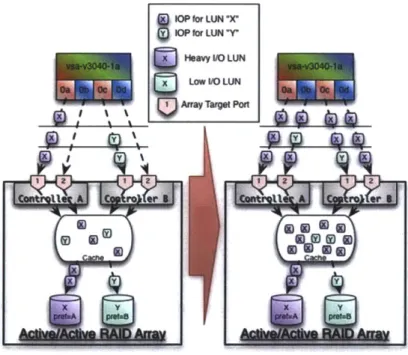
Figure 3: How I/O handling differs between SPIO (left) and MPIO (right)
The difference in I/O flow between MPIO and SPIO is displayed in Figure 3.
SPIO
is shown on the left, and MPIO on the right. The configuration has a NetApp controller with 4 initiator ports, and an array that has two controllers with two target ports each. Each dotted line represents a path from the controller to the array that is available for use inrelaying I/O. It is evident in the SPIO system that not all paths are being utilized. There are only two LUNs, X and Y, and each LUN has a single path designated as its primary path. All I/O destined for LUN X goes down the path from Ga -Z Al, and all I/O for Y goes down Oc -Z 1. In contrast, the MPIO system allows any I/O for X or Y to use any path. This allows all paths to be evenly utilized even if the load to X is much higher than Y, as is displayed in the figure.
2.1 Load Balancing
Although SPIO limits each individual LUN to a specific path, that does not mean there is no load balancing. The majority of test beds, as well as customer deployments, utilize multiple LUNs, commonly on the order of tens to hundreds. While the load to a single LUN cant be split amongst multiple paths, the system can designate a different path for each of the LUNs to attempt to spread the load around. This rebalancing happens in a periodic fashion every few minutes, mainly because switching the path of a LUN is costly. Not only does it require signals to be sent to the corresponding hardware, it also involves halting I/O to the LUN for which the switch is occurring. This doesnt align well with the use case, since the motivation to move a LUN is often that it is receiving a disproportionate amount of the load, which amplifies the effect of halting I/O.
MPIO provides the facility to balance on a path basis, and in real time. It follows that the system is better able to react to sudden changes in load. In addition, MPIO will never have to halt I/O to rebalance, since the bits will flow down any path without the need for a pause to switch. This is a result of a changed path registration system that now accepts multiple registrations per LUN, rather than one. The changes to the registration system are mainly centered on the fact that a LUN can now receive I/O on multiple paths without receiving errors on those not designated the primary path.
3
Simulation
An I/O simulation tool was developed alongside basic MPIO functionality testing to both aid the process of analysis on actual hardware, as well as to help understand the different I/O routing strategies and I/O distribution behavior in general. The software tool evolved as more was understood about the way NetApp controllers handle I/O, and will serve as a sanity check for results retrieved from the instrumented real world tests. The goal for the software simulation is to explore the viability of a given routing strategy before taking the time to implement it in the source code of Data ONTAP. It is also designed to give an indication if a given strategy has more favorable throughput and latency characteristics. During a simulation one can also derive a sense of fairness, inspecting to see if a given LUN is getting starved.
The I/O simulation tool was implemented as a Perl script that interacts with the user at a command prompt. When the program is started, it is passed a configuration file that specifies the layout of the simulated hardware, including how many controllers and third party arrays there are, as well as what ports they have and how they are connected. The software constructs Perl objects for each piece of hardware, and remembers viable paths, which are basically the pairs of ports that allow I/O to flow between them.Using a simulator rather than actual hardware to investigate different topologies is particularly useful, as the overhead of a physical reconfiguration is enormous relative to creating a configuration file. A large portion of the hardware available to development and QA teams is kept in a lab off-site, which only adds to the complexity of a reconfiguration. Physical layouts of actual hardware are further limited by the scarcity of the NetApp controllers and third party arrays, the majority of which are utilized for testing builds of software releases before they are deployed to the field.
hardware with I/O. This can be done instantaneously, over a window of time, or can be run until a specified amount of I/O has built up on a controller. There is also a steady-state option that supplies enough I/O to maintain the current levels on each controller. After each command, the simulated performance characteristics are displayed to the console. The
software uses a notion of ticks rather than actual time, which can be exploited to limit the rate of completion as the throughput of connections become saturated.
The simulation proved useful for a variety of reasons. It was the first positive sign that we might be able to expect measurably better performance out of MPIO on an actual system. It led us to rule out some possibilities of routing algorithms that had observable failure modes for specific configurations. One such example is the routing algorithm that uses the least I/Os pending at a target port metric. This proved to have problems with a fan-in configuration, which is a setup that has a greater number of initiator ports at the controller than target ports on the array. If a deterministic tie-breaking method is used to select which path out of the several possible ones to take to a given target port, the other paths to that target port will not be used at all. This is undesirable behavior and led us to consider more carefully what our tie breaking behavior would be in a situation like this.
One disadvantage to choosing a step-based implementation of the simulation tool is that it hides the computational costs of the routing algorithm chosen. Since decision of which path to send an I/O on sits on the execution path of sending each individual I/O operation
(IOP),
it is important to keep the decision logic as lightweight as possible to limit the impact on throughput and latency. The simulation did show that we need to make the logic robust enough to avoid the failure modes described above. Moving forward, the MPIO routing algorithm would be kept as simple as possible, and the performance benchmarks would include a comparison to a round-robin variant of the algorithm in addition to the version deemed best path.3.1
Simulation Pseudocode
Parse configuration file; while Prompt not exit do
Parse prompt input command; if command == load then
Apply load to paths;
Step time forward as necessary; end
if command == tick then
Step time forward specified number of ticks; end
if command == aig then
Switch the routing algorithm being used; end
if command == clear then
Delete all pending I/O and memory of statistics; end
if command =f fill then
Gradually load paths until fill amount of I/O is pending; end
if command == steady then
Load enough I/O to maintain current levels of I/O; end
Print summary of state after each command end
4
MPIO Implemenation
4.1 Counters
The design and implementation of the MPIO performance testing framework happened con-currently with the design and implementation of the MPIO feature itself. A precursor to the work on MPIO involved the addition of various counters in the routing administrator. The counters were added in anticipation of the MPIO algorithm needing information about the past and current state of the system, specifically about the various paths. Some of the counters that were added included:
" Number of bytes of I/O pending on a path
" Total I/O in bytes sent on a path
" Total number of IOPs pending on a path " Number of IOPs sent on a path
" The cumulative latency of I/Os that have been sent on a path " The cumulative service time of I/Os that have been sent on a path
The counters are implemented in a way that distinguishes reads from writes, should the algorithm ultimately need to differentiate between the two. The total for all I/O can be obtained by summing the counters for read and writes, since they are all absolute counters. In addition to the cumulative counters, rolling averages are kept for latency and service time to allow for the tuning of sensitivity to local I/O activity relative to what has been observed in the past.
Counters provide a better way for MPIO to label error paths than the previous way it was done in the SPIO implementation. Prior to counters, paths were assigned an error
status if they exceeded a predefined threshold, and any LUNs that were assigned that path as a primary path had to switch. The error was effectively a binary value that indicated whether or not a path should be used. With MPIO and counters, the error weight can be a continuous value that indicates the severity of the error on the path. The path can still be flagged if it passes a threshold, but it is no longer necessary to avoid it entirely in this case. MPIO allows multiple paths to be used to a given LUN, which enables the use of the error path, in addition to all others. If the error path can be used without incurring the overhead of switching, as it would in the SPIO system, periodic IOPS can be sent to probe the path and determine if it should still carry the error weight it was designated at the time of the error. The counter retain the data from the error, so the path may not be used extensively right away, but the weights can be set to adjust the speed at which Data ONTAP backs off in the face of an error, and resume I/O at a sign of recovery.
4.2
Rolling Averages
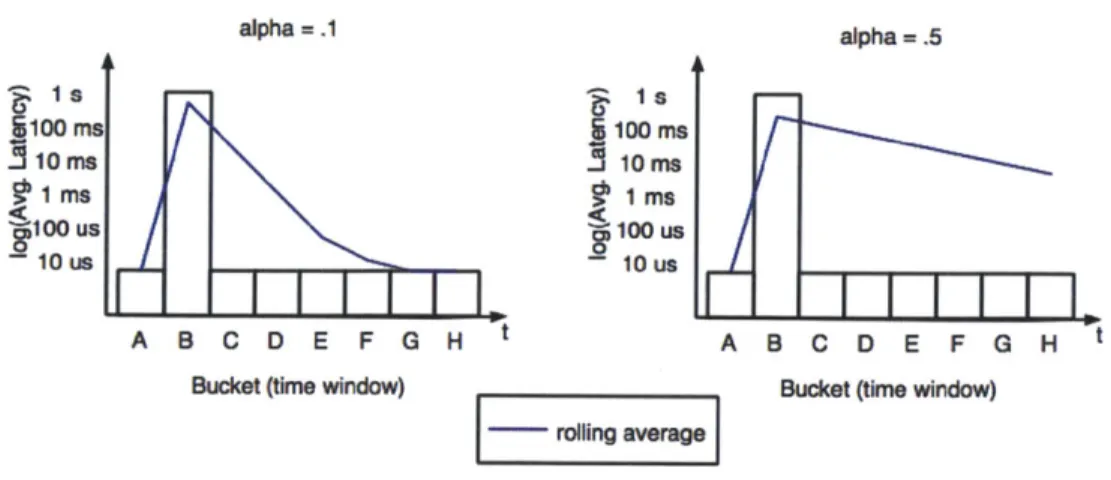
The use of rolling averages for measuring average latency allows for the tuning of sensitivity to high-latency error events. The alpha value influences both the reaction to the spike in latency, as well as how long it takes for a system to settle after the event is over. Such an event may include a path disable, or even a physical detachment from either end of the path. The algorithm is depicted in Figure 4, which shows how the feedback works toward computing a new average. The larger the value of alpha, the more the calculation favors the old average relative to the new data. The equation for the calculation is follows:
a * avgold + (1 - a) * newVal = avgew
To understand the implications of the selection for the value of alpha, it was necessary to inspect the number of cycles it would take to settle back to steady-state latency after an
Latest ment 1 New Average
a.Delay
Figure 4: The flow of information in the rolling average calculation
error event. The settling aspect of the algorithm proved more interesting than the response to a spike, as it controls how long a path remains out of commission after a latency jump. The influence of the alpha value is shown in Figure 5. A small alpha value can converge back to the steady-state latency after a few window periods, while a larger value will take many times longer to converge. Penalizing a path too harshly for a brief latency spike can hurt throughput in the long run, especially considering many brief jumps are fixed almost as quickly as they occur. If the path remains in an error state, intermittent probe IOPs are adequate to discern that the latency is still large enough for the path to be considered in error. alpha =.1 alpha = .5 1 -s ^ Is-1100 MS 100 Me 1 ms 1 Ms S100 us 100 us 10 us I 10 us I I A B C D E F G H t A B C D E F G H t Bucket (time window) Bucket (time window)
4.3
Registration/Reservations
An overhaul of the previous path registration/reservation system was necessary to accom-modate the needs of MPIO to send on multiple paths. Prior to MPIO, Data ONTAP was implemented with a single registration model. A LUN could only be registered on one path, and that was the path that all I/O to the LUN had to take. In the event of a failure on that path, the system would have to go through the process of shifting the registration to a different path, which had a non-negligible overhead and required I/O to halt to the LUN for the duration. This model fit well with the common Active/Passive array behavior at the time, since most third-party storage arrays couldnt handle I/O to a specific LUN on all of its target ports. Data ONTAP was designed to prohibit sending I/O down a path that would cause the underlying array to generate an error, such as a SCSI check condition.
The system had to be modified with the requirement that it still supported the old style of registration, since A/P arrays are still supported and will be for some time. However, to take full advantage of the more capable A/A arrays that are becoming more common, Data ONTAP needed to be able to allow multiple paths to deliver I/O to a LUN. The solution was to permit multiple paths to register with a LUNs reservation. The internal modifications to achieve this result are very system specific, and wont have much meaning in the context of the paper. This modification, while necessary for the functionality of MPIO, doesnt have many implications on the performance of the routing. Routing Algorithm
The last major aspect of MPIO to be implemented was the routing algorithm. This is the most customizable module, and has the biggest implications on load balance, fairness, and performance. The most straightforward way to get the routing administrator to use multiple paths was just to multiplex them, so the first algorithm implemented was a simple round-robin version. The selection involved walking a circular list of paths, and advancing the pointer each time an I/O was sent. Additional handling was required to deal with new
paths being discovered, as well as paths disappearing. In this case, the list is updated and the pointer set back at the head of the list. While this leads to a slight imbalance, adjustments to the path list happen so infrequently relative to the volume of I/O that it has a negligible
effect.
The next step was to make the routing algorithm customizable via boot arguments. This provided a mechanism to make testing much more efficient, as it allowed a change in al-gorithm without a full rebuild and reinstall. In addition, it provides a failsafe should an algorithm prove to have issues for a given configuration, as was the case in some of the sim-ulation runs. A similar approach was taken to allow the old code paths to be selected, but with a slightly different mechanism. Should the entire framework prove to be problematic, there are low level flags that can be set to induce a boot into the old SPIO mode. Like the modifiable algorithm, this proved useful in testing the performance of the different imple-mentations, as reboots are much quicker than software reinstalls. One additional perk to making the routing algorithm dynamic is the potential for a system that uses the measured counter data to proactively change the algorithm based on the load. Currently, changing the
algorithm requires a reboot, but modifications could be made to remove this restriction. Round-robin met the requirement that the algorithm is computationally simple, but simulation results indicated that using feedback could improve load balance and overall throughput. In the next version of the algorithm, named best-path, metrics were generated for each path at the time a path was chosen. The metric that was ultimately chosen used the number of bytes pending on each path, weighted by an error weight that depended on the latency observed on that path. Since these values are available via the counters, computing this metric is still not computationally intensive, though costs more cycles than round-robin. Part of the performance testing will measure the number of cycles spent in the storage domain of Data ONTAP, which encompasses the routing administrator and any calculations it has to make. Round-robin will be used as a baseline, with the best-path variant being
compared on a per-run basis to identify the cost of the routing.
5
Performance Testing
One of the trickiest parts of testing a feature such as MPIO in a system like Data ONTAP is that it is difficult to isolate. For this reason, the majority of testing done for this paper is at the system level. The primary goal is to profile performance between three versions of the system: SPIO, MPIO round robin, and MPIO best path. Testing V-Series performance is a challenge in general because several array models from various different vendors are supported. Each third party array has slightly different behavior, so comparisons of perfor-mance between different array models and vendors are difficult to make. In addition, the development environment at NetApp has several generations of V-Series controller in use, which further obfuscates comparisons between different test beds.
One feature that MPIO requires to take full advantage of its multiple paths is that an ar-ray must display behavior known as Active/Active (A/A). An Active/Active arar-ray can serve reads or writes to/from a given LUN through both of its array controllers. This is in contrast to an Active/Passive (A/P) array, which has one controller effectively own a LUN, and the other passive one will only serve I/O to that LUN in the event of a failure. Active/Active arrays are becoming more common, which is a significant part of the motivation for switching to an MPIO implementation within Data ONTAP. Unfortunately, because A/A arrays are newer, and typically more expensive, than their A/P counterparts, there are only a limited number available to the developers for testing purposes.
Cost-saving measures have influenced the development environment to make extensive use of sharing resources. The end result is a system of Storage-Area Networks, which share switches and arrays and use clever switch zoning to multiplex access to the shared resources. A development SAN will consists of a few switches ISLed together with front-end
connec-tions to a pair of NetApp controllers for each developer. The same switches have back-end connections to a handful of different third-party storage arrays. On the arrays themselves, individual LUNS are provisioned from a large pool of available capacity, and presented to the specific V-Series controllers that need the storage. As one can imagine, this system is good for cutting costs, but makes it difficult to achieve isolation when testing performance.
The ability to share the capacity of a storage array is extremely useful for testing code paths specific to a given array, but it complicates the process of retrieving reliable perfor-mance numbers for I/O throughput to the array. Although the LUNs used by a configuration differ, they still share array target ports and switch back-end ports with other development and QA configurations. Since there are constant QA tests running on all available arrays in the lab, opportunities for isolation are limited. A large portion of the preliminary testing was done in the presence of traffic from these other tests, and a few performance measure-ments were done during a prearranged pause in other QA testing that may have conflicted. There is no framework or interface to identify in real time what I/O is being passed to the array, and from which controllers it is originating. The implications of the effects of shared resources will be discussed further in the context of the results.
Although the shared resource model primarily meets the needs of a development and testing environment, it isnt uncommon for a deployed system to use some degree of sharing as well. There may be multiple pairs of V-Series controllers configured with the same third-party storage array on the back end, potentially serving different data or running different applications. Communication at the level of the routing administrator does not bridge controllers, so all routing decisions must be made with local information. Since each V-Series controller has no way of quantifying how much I/O is being done by other controllers, potentially to the same back-end array, it must use other feedback mechanisms to achieve load balance.
distributing I/O amongst its different paths. This can be done utilizing local information, since the counters incremented in the RA provide an estimate of latency for each path. The RA also keeps track of how many IOPS, as well as how many bytes, are currently pending on each path. The second step is to factor in that the latency observed by one controller reflects the actions of the other controllers that share the same back-end. Consider two paths, with initiator ports on entirely different V-Series controllers, but a shared array target port, that simultaneously drive I/O. If the target port is saturated, it will have to alternate between the I/Os it receives from both paths, causing the observed latencies on those paths to double. This feedback could be used in the RA to stray away from the shared path, and choose another that may not be shared, and thus have a lower observed latency, if available.
Data ONTAP has recently received a large refresh that introduces the concept of clusters of NetApp controllers, rather than High-Availability (HA) pairs [3]. Clustered ONTAP places a heavy focus on availability and reliability at the system level. Rather than having to maintain each controller individually, they can now all be administered from a cluster administrator prompt, available at any of the nodes. A pair of controllers is no longer solely responsible for servicing data; the responsibility can be shifted at the cluster level to any controllers that have joined it. Unfortunately, because the RA operates at such a low level within the controller, there are no clear ways to convey information that the routing administrators of other controllers would be interested in. There is potential to implement some form of cluster level communication to further support the notion of load balance on the paths to an array. Even this would not cover the case where out-of-cluster nodes also share the array, which is also a viable configuration. The option to share such information is potentially viable, but will not be explored further in this paper.
5.1
Design
Many of the aspects of NetApp systems discussed above had direct impacts on how the performance testing of MPIO was done. The first was the influence of clustered ONTAP on the design of the tests. Development builds at the time were in a transition period, where cluster mode was the default, but the old non-clustered mode was available to switch to. The non-clustered mode will be referred to as 7-mode for brevity. Many of the interesting tools that existed for examining the internal state of the RA were only available for 7-mode at the time, so 7-mode was primarily used for gathering data and measuring the desired performance statistics. The tools used in the performance testing for this paper are some of those that are used by QA for verifying the correctness and reliability of production builds prior to deployment, so their accuracy is trusted. In fact, during the early stages of performance testing, abnormal results reported by these tools lead to the discovery of several bugs tn the MPIO implementation before even QA was able to detect them.
One of the consequences of using the 7-mode interface, rather than cluster mode, is that the 7-mode interface has a relatively restrictive buffer regarding I/O to the console. This became apparent as a constraint when the polling of the levels of I/O too rapidly led to the timeout of the connection to the 7-mode interface. The script running the performance tests was adapted to hold back on the polling if the buffer was nearing capacity. The limited polling reduced the granularity of the inspection of I/O levels per path. This was not considered to be detrimental to the results, as the performance data was gathered over the duration of a several-minute run. This limitation of the 7-mode console is not a factor in cluster mode, so as the tools become available it would be worth porting the performance test script.
Another important decision for testing is the configuration to be used. This decision was constrained by the available resources, as contention for the aforementioned Active/Active arrays was common. The test configurations used utilized a single V-Series controller,
con-nected through two different switches to either two or four target ports on the array. Tests were run with different numbers of paths available to try to identify the benefits of MPIO when there were more or fewer selections to be made. The switches are identical speed but different brands: one Brocade and one Cisco. This type of configuration is designed to test both brands, and for reliability purposes. The switch brands are a consequence of QA testing and were not specifically selected for MPIO testing. MPIO testing repurposed much of the existing framework due to fiscal and time constraints.
5.2
Testing Pseudocode
Parse CLI args;
Remote login to V-Series Controller; Begin load generation;
Start metadata gathering tool; while Duration not exceeded do
Request snapshot data; Parse out relevant values; Aggregate observed values; end
End metadata tool;
Parse out relevant metadata values; Compute averages with gathered data;
The general approach was to start the load specified at the command line, and then periodically probe the controller with custom commands to produce the data. The custom image of Data ONTAP with the MPIO changes also included some modified command
line tools that displayed the MPIO-specific internal variables. These modified commands gave much easier access to the internal counters relevant to the routing algorithm, and also served as a sanity check regarding the function of the routing. Early in the testing, these tools revealed nonsensical values for the bytes pending on a path, leading to the discovery of a bug within the counter code. The periodic snapshots were displayed to the screen during each test run, allowing for visual inspection as the code ran in addition to the final summary at the termination of the script.
The frequency of polling was determined experimentally, and was restricted by the buffer size of the 7-mode console. Polling too fast resulted in a forced logout from the 7-mode prompt back to the cluster prompt, which violated assumptions made by the script and commonly caused it to hang. Limiting the frequency to one command every 5 seconds, com-bined with other adjustments, enabled the test script to maintain its connection and complete progressively longer test periods. The other adjustments involved frequent reestablishment of the connection, as well as filtering of the command results to reduce the number of charac-ters reaching the console. In retrospect, it may have been possible to increase the frequency of polling if the results were logged to a file rather than printed to the console, but the manual verification of results early on had enough benefits to warrant the console approach for the duration of the project.
5.2.1 Example of polling command and result
Below is an example of the output from the polling command used to extract data during a test. The output has been clipped for brevity; more paths mean more columns in the output.
vgv3240f83a*> ra mlm load show IBM_2107900_1
Total I Entities | Seconds I Durations (usecs) stat name Times I Last High Avg I Ago I Last High AverageI Next Iter 31 I 76 76 69 | 10 1 591 627 509 1 List Sort 161 20 30 181 10 1 7 8 6 1
Rebalance- 16 1 0 9 0 1 name wwnn wwpn devaddr tp-queue-depth cmds-in-process highest-cmdsinprocess total-bytes-assigned average service time average latency time Target Port Group array-name errors good-time Load Data path load ha load target load vgci9l48s75:1-16.126L5 vgbr300s71:16.126L4 vgci9148s74:1-10.126L3 vgbr300s7O:16.126L2 vgbr300s7O:16.126L6 vgci9148s74:1-10.126L7 vgbr300s71:16.126L8 vgci9148s75:1-16.126L9 vgv3240f83a*> 10 1 9 vgbr300s70: 16. 126 5005076303ff c124 5005076303030124 4010700 ( Oc) 512 32 34 390656 18 18 3 IBM_21079001 0% #LUNS Scr MB/s 2 2.04 4 2.08 2 2.04 RDY/AO 0.00 RDY/AO 0.00 RDY/AO 0.00 INU/AO 2.04 INU/AO 0.00 RDY/AO 0.00 RDY/AO 0.00 RDY/AO 0.00 15m Avg MB/s 2.04 2.08 2.04 0.00 0.00 0.00 2.04 0.00 0.00 0.00 0.00 29 11 1 vgci9148s74:1-10.126 5005076303ff c124 5005076303088124 50E1400 ( Od) 512 32 34 313344 13 #LUNS 2 3 2 RDY/AO RDY/AO INU/AO RDY/AO RDY/AO INU/AO RDY/AO RDY/AO 13 16 IBM_2107900_1 0% 15m Scr MB/s Avg MB/s 2.21 2.21 2.21 2.21 2.21 2.21 0.00 0.00 0.00 0.00 2.21 2.21 0.00 0.00 0.00 0.00 0.00 0.00 0.00 0.00 0.00 0.00
5.3
Load Generation
There were a few tools available for driving an I/O load onto a system, each with pros and cons. The two with the most documentation within NetApp were Hammer and SIO, and ultimately it was decided that S10 had more options that would enable some of the desired benchmarks of MPIO. One major motivating factor was the need to avoid as many levels
of caching as possible, since the limited available capacity on the contended Active/Active arrays meant that the target aggregates, volumes, and ultimately files were restricted in size. Given that the files were not much bigger than some of the higher level caches, the only way to achieve any noteworthy levels of I/O load was to either disable or circumvent the caches. Hammer was a tool that had to be run at the level of an external load client over an NFS mounted file system, which meant that its requests would be cached in the local load clients hardware
[5].
In contrast, SIO had a more featured version that operated native to the NetApp controller, meaning that the I/O could be generated locally and only potentially hit the controllers cache before reaching the disk.Using this native version of SIO, called filersio, had drawbacks as well. Most notable is the fact that, since the load was generated locally, it consumed cycles of the controllers CPU that would not otherwise be used in handling I/O. Since there were already concerns about the consumption of CPU cycles by the routing algorithm, we carefully dissected the results of the first few tests regarding CPU usage. The I/O tools indicated that even with the load being generated locally, a large fraction of the CPU cores remained idle during the tests. This lead to the conclusion that the tests were not CPU limited, but rather limited by the amount of I/O the tool was able to generate, as well as the speed at which the array could process the I/O.
Filersio has two primary modes of operation, asyncio-pause and asyncio-active. The asyncio-pause option takes arguments for X amount of I/O to be generated every Y seconds, and a single thread works to try to meet that request. The asyncio-active option takes arguments for X amount of I/O per second to be generated per thread, by Y number of threads. It was experimentally determined that both modes max out at roughly the same overall level of I/O, with minimal difference in overall behavior between the two. If the levels of I/O requested exceeded the capability of the tool by too much, the actual volume produced fell noticeably lower than the maximum. This lead to a design where, for each
system, the maximum level was determined before performance data was gathered. The filersio tool itself has a reporting mechanism that indicates the requested and delivered I/O rates, which helped to isolate the maximum request rate that could be met.
6
Results
6.1
Preliminary Results
The first round of testing was done on a pair of V-Series controllers of the model V3240, which were a part of the development SAN DEV SAN 1. This SAN is shared by approximately 10 other V-Series and FAS controller pairs. DEV SAN 1 uses a network of 6 Fibre Channel switches, 3 Cisco switches ISLed together, and 3 Brocade switches ISLed together. The controllers being used for testing, called f84a and f84b, had a zone defined within each switch environment that connected them to an IBM DS8000 array on the back-end. The IBM DS8000 provides storage for most of the controllers in DEV SAN 1, and additionally has connections to other SANs used by QA. It is typically under some degree of I/O load all of the time, due to the fact that it is an Active/active array and thus is a valuable testing resource for QA.
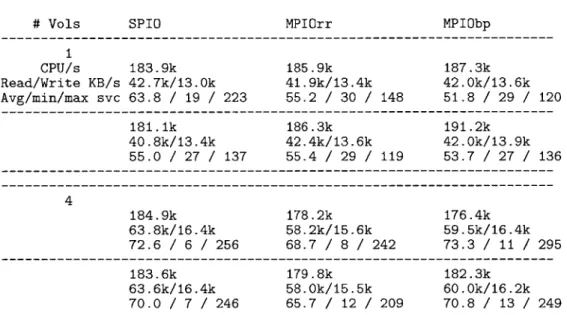
The first round of testing produced mixed results, as shown in Figure 6. The figure can be interpreted as follows. Each cell holds the data from a test run with the number of volumes given by the row, and the routing protocol given by the column. In this case, two runs were done per algorithm with 1 volume, and another two runs each for 4 volumes. The number of volumes affects both the file size, as well as the number of paths available (as it may restrict SPIO). Within each cell there is data for the number of CPU cycles per second spent in the storage domain, the average read and write throughput in KB/s, and the average/minimum/maximum I/O service times observed by the polling tool.
When run with one volume, MPIO best path and round robin averaged slightly higher throughput, and consumed slightly more cycles than SPIO. Their average service time was also measurably lower. This configuration had 4 available paths, and with only 1 volume being used, and 2 LUNs per volume, this meant that SPIO was not able to use two of the four paths, while MPIO could. Each row in the table represents data from a different run, which indicates that there was some variation between the runs as well. At this point in testing, the process of switching modes was less streamlined, meaning the runs occurred relatively far apart in time. Fluctuations in load from external sources may have influenced numbers between runs, and unfortunately cant be quantified given the current infrastructure.
# Vols SPIO MPIOrr MPIObp
1 CPU/s 183.9k 185.9k 187.3k Read/Write KB/s 42.7k/13.0k 41.9k/13.4k 42.0k/13.6k Avg/min/max svc 63.8 / 19 / 223 55.2 / 30 / 148 51.8 / 29 / 120 181.1k 186.3k 191.2k 40.8k/13.4k 42.4k/13.6k 42.0k/13.9k 55.0 / 27 / 137 55.4 / 29 / 119 53.7 / 27 / 136 4 184.9k 178.2k 176.4k 63.8k/16.4k 58.2k/15.6k 59.5k/16.4k 72.6 / 6 / 256 68.7 / 8 / 242 73.3 / 11 / 295 183.6k 179.8k 182.3k 63.6k/16.4k 58.0k/15.5k 60.0k/16.2k 70.0 / 7 / 246 65.7 / 12 / 209 70.8 / 13 / 249
# Note: SPIO with 1 volume used 2 paths because volumes all have 2 LUNs
Figure 6: Early results from testing on DEV SAN 1 with the DS8000
The data generated from testing with 4 volumes is interesting in that it seems to have favored SPIO in terms of throughput. MPIO round robin had the lowest service time of the three protocols, and additionally had the fewest cycles spent in the storage domain. This result was the first indication that the cycles spent in the storage domain were related to the throughput done, since each I/O being processed has a fixed number of cycles it must
spend regardless of the implementation. This data also motivated a few changes to the test infrastructure. Due to the variation between runs, longer runs would be run in the future to avoid reflecting spikes in external load. In addition, more runs per protocol would be run to try to better gain a picture of aggregate behavior.
These preliminary results were also gathered prior to the experimentation with the limits of the filersio tool. The load was generated by using the asyncio-active option, with the maximum load per thread, and the maximum number of threads allowed by the tool. It turns out the overall load can be increased by reducing the number of threads, which seems unusual. The -exact cause of this was not explored in detail, but it may be due to the overhead of managing too many threads within the tool. It may also be the case that the tool, when backlogged, uses cycles to resend I/O after timeouts, which would reduce the overall throughput of the system. The impact of these changes will be discussed in the context of the results of later runs.
/subsectionModifications to Test Script and Configuration
The preliminary results motivated a string of changes to both the test script, the config-uration being used, and the testing procedure in general. It was at this point in the testing that the modifications to Data ONTAP were made to enable switching algorithms through the use of boot arguments, rather than reinstalls. This cut down on the time between runs, which helped address the problem of variable activity taking place on the array. If all of the tests could be collectively done in a smaller window of time, there would be less of a chance that some other large generated load would interfere with the data. This change also allowed for the length of the runs to be increased, while still completing the testing for a given day in a reasonable amount of time.
Another important observation made was that a write load had very little impact on I/O routing and performance. This is a result of the implementation of Data ONTAP and the way it handles writes. Unlike with reads, where Data ONTAP must fetch the data for each
IOP if the data is not in a cache, writes can be buffered and returned immediately. Writes are grouped and flushed either on a periodic timer or when the buffer is full, rather than going to disk on every write. This performance acceleration of writes made I/O routing with writes difficult, since even a large write load would only generate few actual IOPs, but they would be much bigger than the individual writes handled above. Condensing the writes into large blocks makes routing uninteresting, since any path with be equally fast when there are only a handful of I/Os pending in the system.
To push the limits of the routing protocols, the decision was made at this point to only test with 100% random read loads. This led to the highest number of IOPs flowing through the system, which challenges the routing algorithm and stresses the system in general. In addition, the random nature helps miss the cache more often, which helps increase the number of reads that go to the back-end array even if the file size is limited. One final perk of this selection was that filersio seemed to be able to generate a higher read load than either writes or any combination of the two.
The results up to this point also led to the belief that caching was still having an impact on the results, so the file size was increased, along with the underlying aggregate and volume size. The underlying storage pools were made larger by adding more LUNs, rather than making the LUNs bigger, so the previous limitation of SPIO on a one volume system was no longer applicable. Even one volume made use of at least 4 LUNs, so it would be possible after rebalancing for SPIG to use all paths just as MPIO could. Just because it uses all paths doesnt mean the load will be balanced, so the comparisons are still interesting regarding throughput and fairness.
The final adjustment made to enhance the performance testing results was to hack Data ONTAP to allow a higher number of IOPs to be pending to each LUN in the system. Data ONTAP artificially limited the total volume of I/O that could be dispatched to each LUN, so by relaxing that constraint the system was able to allow more I/O through given the
configuration the testing was limited to. The investigation into relaxing this constraint led to the uncovering of several bugs related to this rate limiting, and the repair of those deficiencies may have also impacted the performance capacity for future tests.
6.2
Final Results
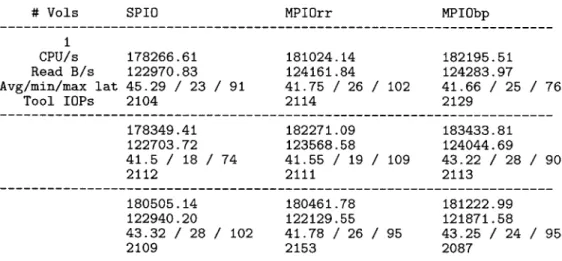
Further testing was conducted with the newly adapted tools and configuration, and the results better reflected what we would have expected from an MPIO and SPIO comparison. The first round of data was collected on the same equipment as the previous round, but at this point the main source of load on the particular array had been identified. Some data was generated during a window in which that external load from QA was temporarily shut off, which gave a better look at how the routing algorithm performed in isolation. Results from one such test can be seen in Figure 7.
# Vols SPIO MPIOrr MPIObp
1 CPU/s 178266.61 181024.14 182195.51 Read B/s 122970.83 124161.84 124283.97 Avg/min/max lat 45.29 / 23 / 91 41.75 / 26 / 102 41.66 / 25 / 76 Tool IOPs 2104 2114 2129 178349.41 182271.09 183433.81 122703.72 123568.58 124044.69 41.5 / 18 / 74 41.55 / 19 / 109 43.22 / 28 / 90 2112 2111 2113 180505.14 180461.78 181222.99 122940.20 122129.55 121871.58 43.32 / 28 / 102 41.78 / 26 / 95 43.25 / 24 / 95 2109 2153 2087
# Note: asyncioactive used with 128 threads, 1 instance
Figure 7: Results from testing with major source of external load disabled
The data from these tests suggests a few more things about the characteristics of the system. The first is that, even with one major source of the external load disabled, there
was considerable variation between runs with the same algorithm. One cause of this might be the aggregate effect of other sources of load, or it may that the random reads happened to interact with Data ONTAP differently each run. It is also clear that SPIO is using fewer CPU cycles in the storage domain, but this was expected from the start. MPIO must spend some additional cycles maintaining path state and making the decision of which path to send on for each pending I/O.
These results motivated another push to further separate the test configuration from the effects of a shared system. The goal was to truly isolate system so the MPIO implemen-tation, including the routing algorithm, could be closely compared to SPIO with minimal noise. Luckily, such a test rig became available around the time the previous results came in, so the move was made to continue testing on the newly available equipment. Another benefit of switching equipment is that it provided an opportunity to test and measure the perfor-mance of MPIO with a different brand of storage array. Although there is no vendor-specific code within the MPIO implementation, it is still valuable to test on different equipment considering they often have different behavior.
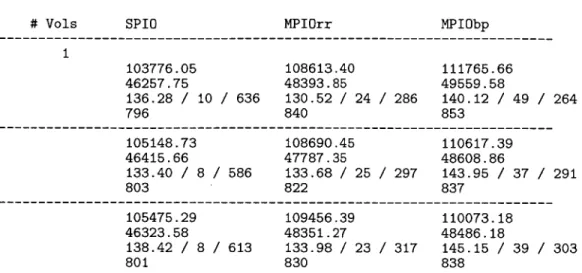
The new test rig included an older pair of NetApp V-Series controllers of the model V3070. This model is considerable slower than those used in the other tests, which were V3240s (two generations newer). This would have implications on the total amount of I/O that could be driven by the controllers. The new test setup had a similar switch structure, one Cisco side and one Brocade side, each with several paths available between the controller and the back-end storage array. The array was an EMC Symmetrix, one of the other Active/Active arrays available within the NetApp lab. This equipment was previously being used to test and fix an important bug in isolation, which meant the back-end equipment was not shared by any other controllers. After some small modifications to the MPIO test script, and some redistributing of LUNs on the storage array, the new setup was ready for testing.
# Vols SPIO MPIOrr MPIObp 1 103776.05 108613.40 111765.66 46257.75 48393.85 49559.58 136.28 / 10 / 636 130.52 / 24 / 286 140.12 / 49 / 264 796 840 853 105148.73 108690.45 110617.39 46415.66 47787.35 48608.86 133.40 / 8 / 586 133.68 / 25 / 297 143.95 / 37 / 291 803 822 837 105475.29 109456.39 110073.18 46323.58 48351.27 48486.18 138.42 / 8 / 613 133.98 / 23 / 317 145.15 / 39 / 303 801 830 838
Figure 8: Results from testing on EMC Symmetrix test configuration with 4 paths
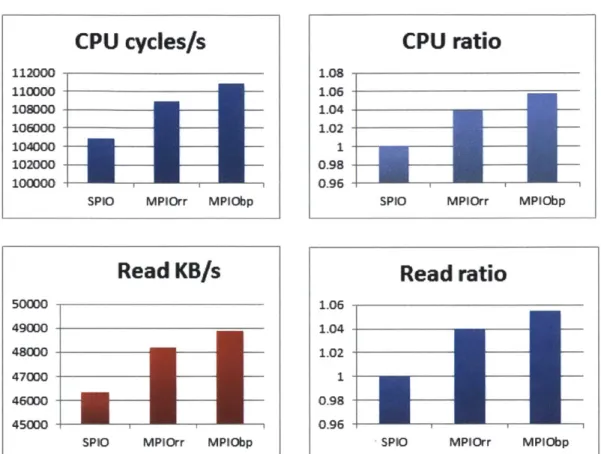
than both SPIO and MPIO round robin, but also consumed a larger number of CPU cy-cles/second in the storage domain. MPIO round robin also outperformed SPIO on through-put. It should be noted that this round of testing used 1 volume because the configuration was designed to include all available LUNs into that one volume. SPIO was able to use all available paths because the number of LUNs exceeded the number of paths. The data is shown in a graphical form in Figure 9. For this 4-path configuration, MPIO best path exceeded the throughput of SPIO by about 5.5%, and the CPU usage by almost 6%. Again, part of the excess CPU usage is attributed to more I/O being processed, so the 6% is not entirely overhead that can be attributed to the routing algorithm.
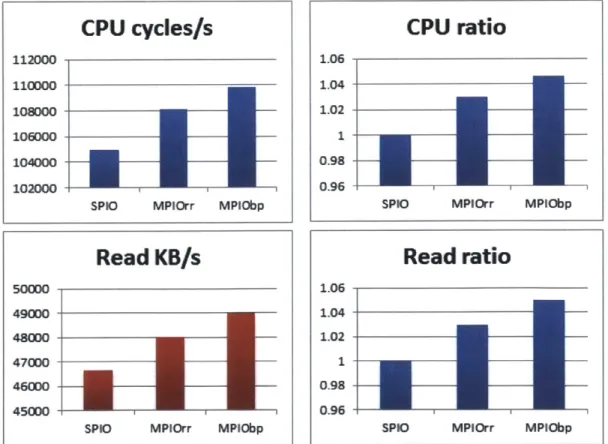
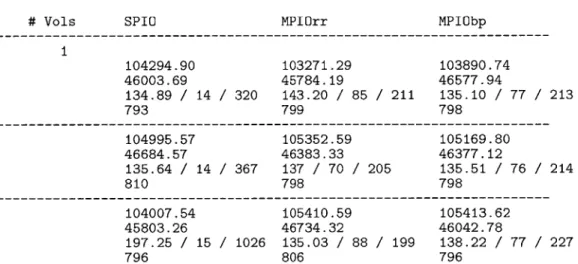
Satisfied with the results from the 4-path tests, the next step was to vary the number of paths to try to discern where the benefit of MPIO was coming from within the system. The data in Figure 10 was derived from a series of test runs with only one path through the Cisco fabric, and one path through the Brocade fabric. The paths connect to different target port groups on the back-end storage array. The expectation was that MPIO would still surpass SPIO in throughput, but the degree to which it was better would decline. MPIO is assumed
CPU cycles/s
11200X 110000 -10MM0 -106000 104000 -102000 _ 100000 i iSPIO MPIOrr MPIObp
Read KB/s
50000 49000 48000 47000 46000 -45000SPIO MPIOrr MPIObp
Figure 9: V3070 to EMC Symmetrix 4-path read load
CPU ratio
1.08 1.06 1.04 -1.02 -1 0.98 -0.96SPIO MPIOrr MPIObp
Read ratio
1.06 1.04 1.02 1 -0.98 -O.96SPIO MPIOrr MPIObp
2-target port data generated with 100% random
to benefit from having more paths to choose from when routing an IOP, so with fewer paths, SPIO should do comparatively better than the 4-path case.
Surprisingly, the MPIO best path routing algorithm performed almost as well with the 2-path configuration as it did with the 4-path configuration. It still exceeded the throughput of the SPIO tests by about 5% on average, and CPU usage by about 4.5%. The drop in CPU usage for a comparable amount of throughput can be partially attributed to the reduction of decision making time and statistics gathering, since state must only be maintained for 2 paths rather than 4. The results inspired one final test to discern the effect of the number of available target ports on the routing mechanism. It was hypothesized that the performance benefit of MPIO over SPIO would be negligible under a configuration that included only two paths, but to the same target port on the array.