Publisher’s version / Version de l'éditeur:
Construction Technology Update, 2003-09-01
READ THESE TERMS AND CONDITIONS CAREFULLY BEFORE USING THIS WEBSITE.
https://nrc-publications.canada.ca/eng/copyright
Vous avez des questions? Nous pouvons vous aider. Pour communiquer directement avec un auteur, consultez la première page de la revue dans laquelle son article a été publié afin de trouver ses coordonnées. Si vous n’arrivez pas à les repérer, communiquez avec nous à [email protected].
Questions? Contact the NRC Publications Archive team at
[email protected]. If you wish to email the authors directly, please see the first page of the publication for their contact information.
NRC Publications Archive
Archives des publications du CNRC
Access and use of this website and the material on it are subject to the Terms and Conditions set forth at
Effects of improved spacer bar design on window performance
Elmahdy, A. H.
https://publications-cnrc.canada.ca/fra/droits
L’accès à ce site Web et l’utilisation de son contenu sont assujettis aux conditions présentées dans le site LISEZ CES CONDITIONS ATTENTIVEMENT AVANT D’UTILISER CE SITE WEB.
NRC Publications Record / Notice d'Archives des publications de CNRC:
https://nrc-publications.canada.ca/eng/view/object/?id=6f0183ea-6905-4071-9893-b81a2b4a2ca2 https://publications-cnrc.canada.ca/fra/voir/objet/?id=6f0183ea-6905-4071-9893-b81a2b4a2ca2C o n s t r u c t i o n T e c h n o l o g y U p d a t e N o . 5 8
Poor thermal performance of insulating glass (IG) units increases heat loss through windows and causes condensation that can lead to mold growth and to the deterioration of windows and wall sections, especially in cold climates. The glass panes in an IG unit are separated by spacer bars, typically made of aluminum or steel. The high thermal conductivity of these metal spacer bars results in high heat loss through the bars and the surrounding area of the window known as the edge-of-glass region (Figure 1) and hence increases the potential for condensation.
The edge-of-glass region is the perimeter of glass between the edge of the frame or sash and the point where the glass surface tempera-ture is the same as that of the centre of the glass. It is about 60 mm wide. On the warm side of an IG unit, the glass surface temperature tends to be the lowest at the sight line, the point at which the glass meets the
frame or sash. Toward the centre of the window, the surface temperature increases until it reaches a steady value known as the centre-of-glass temperature. IG units with higher glass surface temperatures in the edge-of-glass region are less prone to condensation.
The temperature in the edge-of-glass region is a function of various factors, including spacer bar design and frame material. The overall thermal performance of a window, however, is determined by the type of spacer bar, the glazing and the frame (edge material for fixed windows) or sash (edge material for operable windows). Consequently, while a window with a high temperature in the edge-of-glass area will perform well in terms of condensation resistance, it will not necessarily show superior overall thermal performance.
By A.H. Elmahdy
Insulating glass units that employ metal spacer bars are more susceptible
to heat loss and condensation, both of which are detrimental to window
performance. This Update reports results of research conducted on
state-of-the-art spacer bars that can help improve performance.
Effects of Improved
Spacer Bar Design on
Window Performance
The condensation resistance of windows can be determined using the Temperature Index (TI) method. This method is described in Construction Technology Update No. 5 and also in the CAN/CSA A440 Windows standard. The TI method relates the interior surface temperature of a window to the exterior temperature and the thermal characteristics of the assembly.
Figure 1. Schematic diagram showing edge-of-glass region
Figure 2. Spacer bar assemblies IG1 to IG10
2
Over the past decade, manufacturers have introduced a number of innovative new spacer bars, but there has been no procedure for comparing their performance with that
of conventional spacer bars. In order to provide a basis for comparison, researchers at the National Research Council’s Institute for Research in Construction (IRC) carried out studies to assess the performance of these new spacer bars. Warm-Edge
Technology
New spacer bar designs and materials are part of what is called warm-edge technology (WET). Those spacer bars that conduct less heat than conventional metal spacer bars in the edge-of-glass region are referred to as “warm-edge.” WET spacer bars either have a thermal break in the spacer assembly or are con-structed of materials with low thermal conductivity. The use of WET increases the resistance to heat flow from the warm side to the cold side of the glazing, thereby reducing the potential for condensation. The technology can have a considerable favourable impact on both the amount of heat loss from the entire window and the occurrence of condensation on the window surface. This is especially true of high-performance IG units with low-emis-sivity coatings on the glass and heavy
gases, such as argon or krypton, in the sealed cavity for the purpose of improving the insulating value of the IG unit. IRC Research Findings
The effect of spacer bar design on the thermal characteristics of a complete window assem-bly depends on many factors, including the type of frame and glazing used. The IRC study assessed the performance of 10 different spacer bars (nine WET and one conventional) in IG units, first without window frames (unmounted) and then with window frames (mounted) of various materials.
IG Units without Window Frames
Each of the 10 IG units (Figure 2) was fabri-cated by a different manufacturer. All units were air-filled and made of clear glass, with dimensions of 152 mm by 1200 mm. The units were tested for heat loss, with surface temperature readings taken at the mid-height of the glass.
Figure 3 shows the warm-side glass surface temperatures for the 10 IG units without frames when exposed to a temperature difference of 38 K (21°C on the warm side and -18°C on the cold side). It can be seen that Unit IG8 had the highest glass surface temperature at the edge-of-glass region, making it the best in terms of reducing condensation. Units IG4 and IG9 were vir-tually the same and had the second highest temperature difference. Unit IG7 had the lowest glass surface temperature in the edge-of-glass region, while Unit IG5 had the second lowest. Although the temperature difference between the best- and poorest-performing IG units was only about 6 K in the edge-of-glass region, such a temperature difference could have a considerable effect on condensation resistance.
It should be noted that the results reported under “IRC Research Findings” are specific to the spacer bars and frame specimens tested and cannot be extrapolated to other window configurations without testing. Window frames made from any of the generic materials discussed here can be designed and assembled in many different ways, thus affecting performance such that it would not conform to the results presented here. This presentation of the combined effects of spacer bar design and frame specimen is meant to show that such effects exist. Each case has to be exam-ined and tested separately to verify its performance.
provide a range of frame types for purposes of determining whether the trend in spacer bar performance was affected by type of frame. In fact, the tests confirmed that the trend in spacer bar performance was the same regardless of what frame type was used. R-value Performance
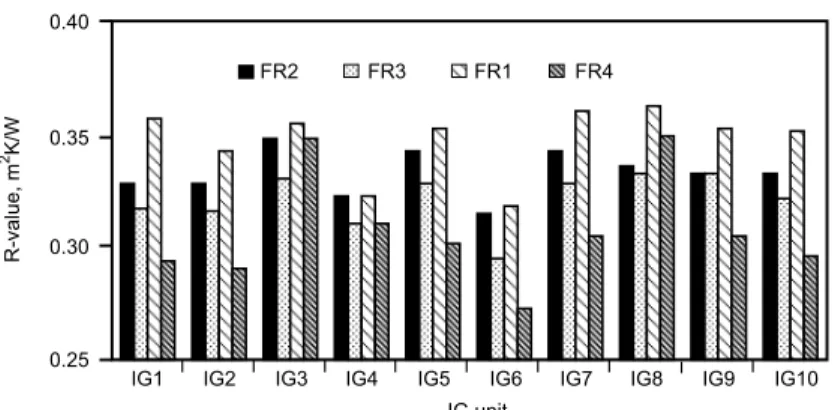
The overall R-value, an important measure of the thermal performance of a window assembly, is dependent on the type of spacer bar, frame material (and design), and glazing, and is particularly affected by the thermal properties of the frame material. However, even with the use of highly non-conductive frame materials, the design of such frames may result in reduction in the effectiveness of the material on the overall thermal performance of the window,
Figure 5 shows the overall R-value for each window tested. In general, wood has a high thermal resistance and therefore the FR1 specimens performed best in terms of overall R-value. In fact, for all the specimens tested, the FR1 specimens had the best overall R-value regardless of which spacer bar was used; the only exceptions were spacer bars IG4 and IG6, where the R-values for FR2 specimens and FR1 specimens were about the same. Further investigation Figure 3 also shows that the further away
from the edge-of-glass region (that is, away from the effect of the spacer bars), the more similar the glass surface temperatures, for all IG units.
IG Units Installed in Window Frames The 10 different types of spacer bar in IG units (measuring 1000 mm x 1000 mm) were then tested as part of a complete fixed window assembly. The assemblies were assessed with respect to their condensation potential and their overall thermal performance. Temperature readings were taken at differ-ent horizontal planes on the warm side of the window. Four different types of frame specimen were used: FR1 (redwood), FR2 (vinyl), FR3 (thermally broken aluminum) and FR4 (foam-filled fibreglass).
Figure 4 shows the effect of WET spacer bars on the temperature measured at 10 mm from the sight line for each type of IG unit and frame specimen when exposed to a temperature difference of 38 K. The combi-nation of FR4 and highly insulated spacer bar (IG8) offered the warmest glass-surface temperature at the 10-mm plane (and at almost all the horizontal planes in the edge-of-glass region), thereby reducing the potential for condensation. Conversely, the combination of FR3 and hybrid spacer bar (IG6) produced the lowest glass-surface temperature in the edge-of-glass region. The glass-surface temperatures of other combinations of frame and spacer bar fell between these two. It is important to note that the frame specimens used in these tests were not intended to be representative of commercially available frames, but rather to
3 The R-value is a measure of resistance to heat flow from the warm side to the cold side of the window. A higher R-value is better for the reduction of heat loss from the heated space. A typical R-value for windows is between 0.5 and 0.8 m2K/W.
Figure 3. Warm-side glass surface temperatures for IG units
Figure 4. Effect of frame material on glass surface temperature 10 mm from sight line
“Construction Technology Updates” is a series of technical articles containing practical information distilled from recent construction research.
For more information, contact Institute for Research in Construction, National Research Council of Canada, Ottawa K1A 0R6
Telephone: (613) 993-2607; Facsimile: (613) 952-7673; Internet: http://www.irc.nrc-cnrc.gc.ca
© 2003
National Research Council of Canada September 2003
ISSN 1206-1220 into the reasons for such performance is
worth undertaking. This will require extensive analysis of heat-flow patterns and temperature profiles.
Figure 5 also shows that when used with the poorest-performing (with respect to R-value) WET spacer bar (IG6), the FR1 specimen had an R-value only slightly lower than when it was combined with the best performing WET spacer bar (IG8). However, this is not to discount the slightly better R-value achieved by using spacer bar IG8 in an FR1 specimen, which resulted in a higher edge-of-glass temperature, thereby decreasing the condensation potential.
Although not studied in this project, it is known that other factors, such as the frame profile (thickness and height) and glass deflection, also affect the R-value of a window assembly. For instance, in cold temperatures, the gas or air between the panes shrinks, creating an area of low pressure that causes the panes to deflect inward towards each other. This inward glass deflection has a negative impact on the overall R-value of a window assembly and can negate performance gains realized from improved spacer bars and frames. Benefits to the Industry
Commercially available innovative (WET) spacer bars can have a beneficial effect on both the edge-of-glass temperature (conden-sation reduction) and the overall R-value (capability to reduce heat loss). The results of the IRC research conducted on ten different spacer bar designs provide the
construction industry with a comparison of their performance. Because there is a range in the level of window performance that is required for particular applications or that is affordable by building owners and consumers, manufacturers can use the results as a benchmark for choosing suit-able combinations of spacer bars and frame materials to meet a range of needs. The results will also help manufacturers to con-tinue their own research and development work on spacer bars, with a view to intro-ducing improvements that will further enhance performance, as even small improvements can be significant.
In general, building designers should specify windows that have a Temperature Index that meets the requirements dictated by climatic conditions and building use, and an overall R-value that meets or exceeds code requirements. The results from this research project provide designers with a better idea of what is involved in achieving these ratings. As well, the research high-lights the importance of considering all the factors that combine to affect window performance — the type of spacer bar, frame and glass — for each and every application. References
1. Elmahdy, A. H. and T. Frank, Heat Transfer at the Edge of Sealed Insulating Glass Units: Comparison of Hot Box Measurements with Finite-Difference Modeling, ASHRAE Trans. vol. 99, Part 1, 1993.
2. Elmahdy, A.H. and T. Frank, Warm-Edge Technology (WET): Recent Research, Glass Canada 4(2), pp.5-7, 1992.
Dr. A.H. Elmahdy is a principal research officer
in the Building Envelope and Structure Program of the National Research Council’s Institute for Research in Construction.
Figure 5. Comparison of overall R-values for each type of IG unit and frame