HAL Id: hal-01338623
https://hal.archives-ouvertes.fr/hal-01338623
Submitted on 27 May 2020
HAL is a multi-disciplinary open access
archive for the deposit and dissemination of
sci-entific research documents, whether they are
pub-lished or not. The documents may come from
teaching and research institutions in France or
abroad, or from public or private research centers.
L’archive ouverte pluridisciplinaire HAL, est
destinée au dépôt et à la diffusion de documents
scientifiques de niveau recherche, publiés ou non,
émanant des établissements d’enseignement et de
recherche français ou étrangers, des laboratoires
publics ou privés.
Copyright
Key unknowns in nitrogen budget for oil palm
plantations. A review
Lénaïc Pardon, Cécile Bessou, Paul Netelenbos Nelson, Bernard Dubos, Jean
Ollivier, Raphaël Marichal, Jean-Pierre Caliman, Benoit Gabrielle
To cite this version:
Lénaïc Pardon, Cécile Bessou, Paul Netelenbos Nelson, Bernard Dubos, Jean Ollivier, et al.. Key
unknowns in nitrogen budget for oil palm plantations. A review. Agronomy for Sustainable
Devel-opment, Springer Verlag/EDP Sciences/INRA, 2016, 36 (1), pp.36-20. �10.1007/s13593-016-0353-2�.
�hal-01338623�
REVIEW ARTICLE
Key unknowns in nitrogen
budget for oil palm plantations. A review
Lénaïc Pardon1&Cécile Bessou1&Paul Netelenbos Nelson2&Bernard Dubos1&
Jean Ollivier1&Raphaël Marichal1,3&Jean-Pierre Caliman1,3&Benoît Gabrielle4
Accepted: 27 January 2016 / Published online: 29 February 2016 # INRA and Springer-Verlag France 2016
Abstract Nitrogen (N) losses in agroecosystems are a major environmental and economic issue. This issue is particularly pronounced in oil palm cultivation because oil palm produc-tion area is expected to increase to 12 Mha by 2050. N fertil-ization in oil palm plantations is mainly provided by mineral fertilizers, palm oil mill by-products, and biological fixation using legume cover crops. N loss has a major environmental impact during cultivation. For instance, 48.7 % of the green-house gases emitted to produce 1 t of palm oil fruit are due to N fertilization. Actually, there is little comprehensive knowl-edge on how to calculate N budgets in oil palm plantation in order to optimize fertilization, taking into account N leaching and N gases emissions. Here we modeled knowledge about all N fluxes in an oil palm field following standard management practices of industrial plantations, on a mineral soil, from planting to felling after a 25-year-growth cycle. The largest fluxes are internal fluxes, such as oil palm uptake, with 40– 380 kg N ha−1year−1, and the decomposition of felled palms at the end of the cycle, with 465–642 kg N ha−1. The largest losses are emissions of NH3and leaching of NO3−, corre-sponding to 0.1–42 % and 1–34 % of mineral N applied, respectively. The most uncertain and least documented fluxes
are N losses such as N2O, NOx, N2emissions, leaching, NH3 volatilization, and runoff. The most critical conditions for N losses occur during the immature phase when young palms uptake is low and during the mature phase in areas with sparse soil cover or receiving high amounts of fertilizers. Data is lacking about the effects of management practices on NO3− leaching and N2O/NOxemissions in those critical conditions.
Keywords Oil palm . N budget . N losses . Tropical perennial crop
Contents
1.Introduction
2.N budget within oil palm management
2.1.Standard oil palm management
2.2.Application of N budgets to fertilizer management
2.3.System boundaries and accounted fluxes
3.N fluxes and variability in plantations: state-of-the-art
3.1.Inputs 3.1.1.Biological N fixation 3.1.2.N fertilizers 3.1.3.N depositions 3.2.Internal fluxes 3.2.1.N uptake
3.2.2.N from plant residues to the litter
3.2.3.N from the litter to the soil
3.3.Outputs * Cécile Bessou
cecile.bessou@cirad.fr
1
CIRAD, UPR Systèmes de pérennes, F-34398 Montpellier, France
2
College of Science, Technology and Engineering, James Cook University, Cairns, Australia
3
SMART Research Institute, Jl. Tengku Umar 19, Pekanbaru 28112, Indonesia
4 AgroParisTech, INRA, UMR EcoSys,
78850 Thiverval-Grignon, France DOI 10.1007/s13593-016-0353-2
3.3.2.N leaching
3.3.3.N losses through runoff and erosion
3.3.4.N gaseous losses
4.Important fluxes and critical conditions for N losses
4.1.The most important and most uncertain fluxes
4.2.Critical conditions for N losses
5.Discussion and key research needs
6.Conclusions
1 Introduction
The anthropogenic production of reactive nitrogen (Nr) is now two to three times that of natural terrestrial sources. Much of this nitrogen (N) is lost from the site of use to the surrounding environment, resulting in a cascade of negative environmental impacts (Vitousek et al.1997; Galloway et al.
2013). In agriculture in particular, N losses are a key issue from both environmental and economic points of view. Agroecosystems receive about 75 % of the Nr created by human activity (Galloway et al.2008; Foley et al. 2011; Galloway et al.2013).
In oil palm plantations, addition of N via legume cover crops and fertilizers is a common practice to achieve the yield potential of the crop. Fertilizers constitute 46 to 85 % of field costs in a plantation (Caliman et al.2001a; Goh and Po2005; Silalertruksa et al.2012; Goh and Härdter2003). Addition of N is also associated with pollution risks of ground and surface waters and emission of greenhouse gases (Choo et al.2011; Comte et al.2012). This raises environmental concerns as oil palm is the most rapidly expanding tropical perennial crop and is expected to keep expanding in the next decades up to an added 12 Mha area by 2050 (Corley2009), i.e., +64 % com-pared to current surface area (18.7 Mha in FAOstat 2014). Hence, an accurate understanding of N dynamics and losses in plantations is important to optimize the management of N and use of N fertilizers.
N budgets are commonly used in palm plantations to make fertilizer management plans. The used approach may be more or less complex depending on how de-tailed the budget is in terms of N flux accounting. Oil palm is a perennial crop with a wide root network and a high production of biomass residues, which, coupled with management practices, generates spatial and tem-poral heterogeneity in soil dynamics over the long growing cycle. Hence, a precise assessment of N budget requires characterizing and modeling numerous and di-verse fluxes.
Despite existing data on measurements over the last 50 years, there has been no comprehensive synthesis on the N cycle in oil palm plantations and the effects of environmen-tal conditions and management practices on N losses. There is a need to compile such data and to highlight research needs in order to shed further light on N budgets in oil palm plantations and to improve fertilizer management in a sustainable way.
This paper focuses on oil palm industrial plantations on mineral soils after replanting. The objectives are to (a) assess current knowledge regarding the N cycle in oil palm planta-tions, (b) identify the remaining challenges for establishing complete N budgets and, in particular, quantify N losses, and (c) identify opportunities for the use of N budgets to improve production and environmental outcomes. This paper first reviews the budget approaches and highlights the pecu-liarities of oil palm plantations. It then reviews the existing literature, measurements, and knowledge gaps on N fluxes in plantations. It finally identifies dominant processes and criti-cal conditions favoring N losses.
2 N budget within oil palm management
2.1 Standard oil palm management
In this paper, we consider predominant management practices in large industrial plantations, as they are generally related with highest environmental impacts (Lee et al. 2014a). Moreover, practices in independent smallholders’ plantations may be more variable and are less characterized in the litera-ture (Lee et al.2014b). However, a large part of smallholders’
plantations in Asia and South America are supervised by in-dustrial plantations in the young age of the palms, and their practices are hence partly comparable to the industrial planta-tions. In industrial plantations, practices also vary, as for the choice of the planting material, the rate and placement of mineral and organic fertilizers, the weeding practices, etc. But some practices have a relatively lower variability, such as planting density, duration of the growth cycle, and sowing of a legume cover. Therefore, we considered the management practices being the most spread, which we referred to as stan-dard management practices in this paper.
N cycling in oil palm plantations must be considered in the context of management systems, which we briefly summarize here. This summary is derived from (Corley and Tinker2003), and we refer readers to that book for more detailed insights. Palm plantations are generally grown on a cycle of approxi-mately 25 years. Clearing and preparation practices may differ depending on the landform and previous land cover. Important variations for N cycling concern the amount of residues from the previous vegetation left to decompose in the field, as well as anti-erosion measures and drain density. One-year-old palms from a nursery are planted in equilateral triangular
spacing with a planting density usually in the range of 120– 160 palm.ha−1. A legume cover, e.g., Pueraria phaseoloides or Mucuna bracteata, is generally sown in order to provide quick ground cover and fix N from the atmosphere. The le-gume rapidly covers the whole area and is controlled with manual weeding around palms. It declines as the oil palm canopy grows and is at least partially replaced by more shade-tolerant vegetation around the sixth year when the palm canopy closes.
During the first 2–3 years of plantation, i.e., the immature phase, fruit bunches are not harvested and female inflores-cences may be removed to improve growth and subsequent production at the beginning of the third year after planting. During the following 22 years, i.e., the mature phase, the plantation is harvested two to four times per month. For each fresh fruit bunch harvested, one or two palm fronds are pruned and left in the field, mostly in windrows in every second inter-row. The alternate inter-row is used for the harvest pathway. The natural vegetation cover in the harvest path and in the circle around the palms is controlled three to four times a year with selective chemical or mechanical weeding. In the remain-ing area, vegetation is left to grow, except for woody weeds to avoid critical competition with the oil palms.
Fertilizer management varies greatly between plantations and through the life cycle. It generally consists of the applica-tion of various forms of mineral fertilizers containing N, P, K, Mg, S, B, Cl, but can be also complemented or substituted by organic fertilizers. Organic fertilizers come mainly from the palm oil mill. After oil extraction, the empty fruit bunches and the palm oil mill effluent may be returned, either fresh or after co-composting, to parts of the plantation, especially on poor soils or in the vicinity of the mill. Around 25 years after plant-ing, the productivity of the palms declines due to higher fruit lost and higher harvesting cost, depending on the palms’ height and stand per hectare. The old palms are felled and sometimes chipped and left in the field to decompose, and new seedlings are planted between them.
Based on this standard management, we identified three main peculiarities in N dynamics to be accounted for in the oil palm N budget. These characteristics are related both to the lifespan of the crop and the management practices. First, as a perennial crop, the palm grows continuously for around 25 years and develops a wide root network, whose extent and turnover will impact nutrient uptake efficiency. Practices are adapted to the plants’ evolving needs and may vary from year to year. Thus, N dynamics may be impacted differently each year and may be influenced by both short- and long-term processes. Second, management practices are spatially differ-entiated and generate marked spatial heterogeneity across the plantation. For instance, mineral and organic fertilizers may be unevenly distributed and weeds are controlled in specific areas. Thus, the practices generate three main visible zones on the ground: the weeded circle, the harvest pathway, and
the pruned frond windrows. These zones differ in terms of ground cover, soil organic matter content, bulk density, and soil biodiversity (Carron et al.2015; Nelson et al.2015), and the differences become more pronounced over the crop cycle. N dynamics must also be related to the distribution of fertiliz-er, which may or may not be associated with the visible zones. N fertilizer may be applied manually or mechanically usually as a band around the outside of the weeded circle. Empty fruit bunches are usually applied in piles adjacent to the harvest path. Temporal and spatial heterogeneity may both influence N dynamics and may also affect the measurement accuracy of N fluxes and stocks (Nelson et al.2014). Third, internal fluxes of N within the plantation may be important. For instance, as a tropical perennial crop, oil palm produces a large amount of biomass that is returned to the soil, with large associated N fluxes such as pruned fronds, empty fruit bunches, and felled palm. There are also internal fluxes within the palm tree itself, notably from old to new fronds.
2.2 Application of N budgets to fertilizer management N budgets or balances are based on the principle of mass conservation (Legg and Meisinger 1982; Meisinger and Randall1991). In agroecosystems, this principle can be rep-resented as follows: N inputs = N outputs +ΔN storage. This simple principle can lead to various approaches, whose com-plexity increases with the number of considered fluxes and the accuracy of the calculation (Fig. 1). Watson and Atkinson (1999) and Oenema et al. (2003) proposed a distinction be-tween three basic approaches in nutrient budget studies: (1) farm-gate budgets, which record only the fluxes of purchased nutrients entering and fluxes of harvested nutrients leaving the system; (2) system budgets, which also include natural fluxes of nutrients entering and leaving the system such as biological N fixation or N leaching, but without looking at potential internal dynamics; (3) cycling models, which take into ac-count all fluxes entering and leaving the system and also quan-tify internal fluxes and stocks, e.g., immobilization in plants and mineralization of residues.
N budgets are commonly used to determine crop fertilizer management. The reliability and applicability of N budget approaches in the case of oil palm management are shown in Fig.1. Reliability proceeds from a combination of accuracy and precision, which increase with the level of knowledge and data availability. On the contrary, applicability is usually lim-ited by knowledge and data availability. Applying one of these approaches to fertilizer management hence implies some tradeoff between reliability and applicability. In oil palm plan-tations, only the first two approaches are currently commonly used, i.e., farm-gate or system budgets, or an intermediate partial budget approach. A comprehensive nutrient cycling approach exists, i.e., the WANULCAS model (Noordwijk et al.2004), but is still not yet widespread in practice. In the
partial budget approach, normally using a time step of 1 year, the fertilizer rates are estimated as the amounts required, nu-trient by nunu-trient, to compensate the amounts of nunu-trients exported, immobilized, and lost (Corley and Tinker2003).
Several levels of precision are possible. Some approaches, closer to Farm-gate budgets, take into account only the export in fruit bunches with or without accounting for immobiliza-tion in the palm tissues. Some other approaches, closer to System budgets, also take into account atmospheric deposi-tion and major losses of nutrients (Ng et al.1999; Ollivier
2011) or nutrients from the pruned fronds recycled to the soil (e.g., Goh and Härdter 2003). However, nutrient budgets alone are not adequate to guide fertilizer applications if there is an existing nutrient deficiency because an investment of nutrients in palm tissues or soils may be necessary (Corley and Tinker2003).
In a more comprehensive budget approach, leaf analy-sis can help to identify nutrient deficiency in palms and hence better account for part of the internal stocks and fluxes that are not discriminated in the in-out budget ap-proach. Leaf analysis is used to modulate recommenda-tions of fertilizer rates based on critical levels derived from fertilizer rate experiments. This empirical method was developed from the work of Prévot and Ollagnier (1957) and is based on the relationship that exists between leaf nutrient content and yield. First, fertilizer rate trials are implemented to provide response curves for the main nutrients required. Second, leaf analyses are carried out in the same plots, and the response curves are used to adapt the fertilizer application in order to drive the leaf content to the optimal rate and hence improve the yield (Caliman et al.1994). However, the leaf analysis method still need to be improved by integrating more knowledge of internal nutrient fluxes within the plant and the soil-plant system
as well as better accounting for the specificities of various planting materials in these internal nutrient dynamics (Ollivier et al. 2013). Indeed, in tree crops, storage and relocations of nutrients may occur between different plant tissues. It is therefore important to understand the fluxes inside the plant over the cycle, in order to link more effi-ciently the nutrient content, the rate of fertilizers to apply, and the targeted yield. These relationships also depend on soil and climate conditions, notably in the case of palm oil (Foster2003).
Depending on the precision and accuracy of the measure-ments and calculations, N budgets may also be used to iden-tify dominant processes or knowledge gaps and to estimate N losses as a performance indicator in nutrient management or in environmental impact assessment. As an example, in the greenhouse gas calculator, PalmGHG (Bessou et al.2014), developed by Roundtable on Sustainable Palm Oil (RSPO), a partial N budget approach based on the IPCC guidelines was applied in order to estimate the N losses in a plantation. As part of these losses, N2O emissions are calculated based on a statistical model that correlated N2O losses to the total mineral and organic N fertilizers applied (see “Response curves, Regressions” in Fig.1).
While the simplest forms of budget may be easy to imple-ment for fertilizer manageimple-ment, they neither show where N is stored nor the time scale of its availability, e.g., for the organic N in soil (Watson and Atkinson 1999). On the contrary, the cycle modeling approach encompasses all fluxes including internal N dynamics and N losses at any time. In the following sections, we investigate the available knowledge to character-ize all fluxes within a cycle modeling approach and highlight research needs to fill in knowledge gaps and improve fertilizer management based on comprehensive cycling models or de-rived budget approaches.
Fig. 1 Nature of N budget to guide management. Reliability increases when accuracy and precision increase, but applicability decreases with data requirement. The various approaches are adapted to oil palm management context
2.3 System boundaries and accounted fluxes
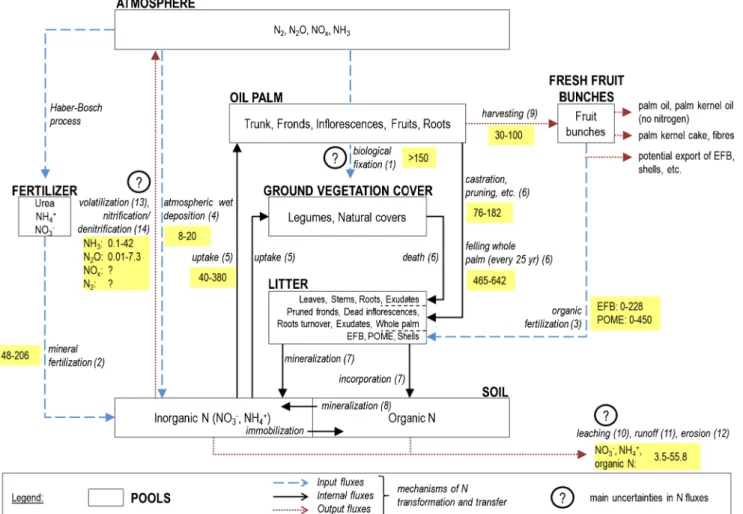
The fluxes were investigated within the system boundaries of an oil palm field on a mineral soil, including the following components: palms, ground vegetation cover, litter, and soil where the roots are. The production of agricultural inputs, transport-related fluxes, and the process of milling were not included in the system. The pools, stocks, and fluxes of N considered are shown in Fig.2.
Spatially, the system was defined as having homogeneous palm and ground vegetation cover types and age, soil, climate, and management. Regarding the root zone, roots were mea-sured down to 3–5 m depth (Jourdan and Rey1997; Schroth et al.2000; Sommer et al.2000). But most of the root biomass and root activity is found in the top 1 m (Ng et al.2003; Corley and Tinker 2003), with for instance 75 % of root activity estimated at 0.8 m depth in Papua New Guinea (Nelson et al.2006) and 0.22 m in Malaysia (Lehmann 2003using data from IAEA1975).
Temporally, the system included the whole growth cycle of the palms, from planting to felling, excluding the nursery stage and previous land use. The typical 25-year-growth cycle is split into two main phases: the immature phase that starts when previous palms are felled and ends 2–3 years later and the mature phase from then until the end of the cycle when the palms are felled.
Several inputs, internal fluxes and outputs or losses occur along with transformations to the form of N. Inputs to the system consist of biological N fixation; mineral and organic fertilizer application such as empty fruit bunches, palm oil mill effluent, or compost; atmospheric deposition of ammonia (NH3) and N oxides (NOx); and deposition of eroded N-containing soil and litter coming from outside of the system. Internal fluxes comprise N uptake by palms; legumes and other vegetation; N transfer to the litter and soil via residues from palms such as pruned fronds, removed inflorescences, frond bases, root exudates, roots turnover, and the whole palm at the end of the cycle; legumes and other vegetation such as
Fig. 2 The N budget in oil palm plantations, highlighting the main uncertainties. The largest annual N fluxes are mainly internal fluxes, and the most uncertain and least documented fluxes are N losses. The pools are represented by the rectangles and the main fluxes are represented by the arrows. The main uncertainties are highlighted with
a question mark. Flux values are ranges given in kg N ha−1year−1, and runoff, leaching, erosion, and volatilization of NH3are estimated
assuming an application of 100 kg N ha−1year−1of mineral N fertilizer (see Tables1,2, and3for sources). EFB empty fruit bunches, POME palm oil mill effluent
leaves, stems, roots, and root exudates; and litter and soil N mineralization. Outputs from the system consist of export of the N in harvested products; volatilization of NH3; emissions of nitrate (NO3−), ammonium (NH4+), and organic N through leaching, runoff, and erosion; emissions of nitrous oxide (N2O), NOx, and nitrogen gas (N2) through nitrification and denitrification.
3 N fluxes and variability in plantations:
state-of-the-art
We reviewed the knowledge available in the literature for all the input, internal, and output fluxes identified in Fig.2. 3.1 Inputs
3.1.1 Biological N fixation
One input is the biological fixation of N from the atmosphere (flux no. 1 in Fig.2), which is carried out by specific bacteria. Three types of fixation were mentioned in oil palm planta-tions: endophytic fixation inside the tissue of a palm colonized by bacteria (e.g., Azospirillum Reis et al. 2000), non-symbiotic fixation which takes place in the litter or soil (e.g., Azobacter Aisueni1987), and symbiotic fixation in the nod-ules of the roots of legumes (e.g. Rhizobia). Regarding endo-phytic fixation, Amir et al. (2001) reported an uptake of fixed N by palm seedlings in the greenhouse following inoculation with Azospirillum bacteria and Om et al. (2009) reported higher leaf protein and chlorophyll content in 280-day-old oil palm plants inoculated with Acetobacter. These results suggested that endophytic fixation is a flux of N input not negligible in oil palm systems, but other studies are necessary to obtain estimates of the magnitude of this flux.
The results regarding non-symbiotic fixation have so far been inconsistent or difficult to replicate in the field (Tinker and Nye2000in Corley and Tinker2003). The magnitude of such inputs from non-symbiotic fixation might be similar to those in tropical forest ecosystems, which are on average 3.3– 7.8 kg N ha−1year−1, with a tendency to increase with tem-perature, soil moisture, and soil N scarcity (Reed et al.2011). Finally, for symbiotic N fixation, recent reviews were done on oil palm plantations (Giller and Fairhurst2003; Ruiz and López2014). Most of the quantifications of N fixation were made in Malaysia in the 1980s and 1990s, mostly with P. phaseoloides, and also M. bracteata, Calopogonium pubescens, and Calopogonium muconoides. Two main methods were reported:15N isotope labeling and deduction from other fluxes with N budget approaches. The estimates of N fixed by legumes were very similar, with an average of 150 kg N ha−1year−1over the first 5 years (Broughton et al.
1977; Agamuthu and Broughton1985; Zaharah et al.1986).
A more recent work reported amounts of N biologically fixed of 0.3 to 34.2 kg N ha−1in legume covers under oil palm in shoots and litter, but more research would be needed to take into account fixed N in roots (Pipai2014). However, Giller and Fairhurst (2003) noted that most estimates of fixation are likely to be underestimates, as they were all based on harvest-ed legume plants without taking into account the biologically fixed N continually added to the litter through residue cycling. 3.1.2 N fertilizers
The other main N input is via the application of mineral (flux no. 2 in Fig.2) and organic fertilizers (flux no. 3 in Fig.2) such as empty fruit bunches and palm oil mill effluent. Several studies were done on fertilizer efficiency and several papers propose fertilizer recommendations, but few data are easily available on actual amounts of mineral and organic fertilizers applied in plantations. The amount of mineral fertilizer ap-p l i e d i s v e r y v a r i a b l e a n d r a n g e s f r o m 4 8 t o 90 kg N ha−1 year−1 for immature palms (Henson 2004; Banabas 2007; Choo et al. 2011) and from 56 to 206 kg N ha−1year−1for mature palms (Foster2003; FAO
2004; Carcasses 2004, unpublished data; Hansen 2007; United Plantations Berhad2006; Wicke et al.2008). It seems to be a common practice to reduce or even stop fertilizer application over the 2–3 years before felling (Choo et al.
2011), despite evidence that effects of N fertilizer on yield do not always persist from 1 year to the next (Caliman et al.
1994). The amount of fertilizer applied is adapted over time mainly on the basis of foliar N contents. This amount hence depends indirectly on the age of the palms, the soil and climate conditions, and the planting material which influences the potential yield.
The main types of N fertilizers used in oil palm are urea, containing 46 % of N, used everywhere; ammonium sulfate, 21 % of N, mainly used in Southeast Asia; and ammonium nitrate, 34 % of N, used in Africa and South America (Corley and Tinker2003; Goh and Härdter2003; Banabas2007). The main factors governing the choice of fertilizer type are the availability, e.g., related with legal framework; the cost per unit N, including transport; and the local soil and climate conditions. The choice of the type of fertilizer is critical for N cycling processes and there might be tradeoffs between these selection factors. For instance, urea is less costly than other types, but it may produce high gaseous losses of NH3in dry conditions (Goh et al. 2003). A common practice is to manually apply the fertilizers in an arc around the palm, using calibrated containers to deliver the required amount to each tree. For immature palms, it is applied close to the palm (Goh et al.2003; Caliman et al.2002). For mature palms, applica-tion practices vary. Applicaapplica-tions can be made manually on the weeded circle, on the edge of the weeded circle, and even on the frond piles where more feeding roots are found and fewer
losses may occur through runoff (Banabas2007). Broadcast mechanical applications by tractors using spreaders with de-flectors are now often used where labor is expensive or in short supply (Goh and Härdter2003). Aerial application is also a developing practice but mainly used on peat soils and steeply sloping areas where mechanical application is not pos-sible (Caliman et al.2002). It is a common practice to split the application of N fertilizers in 2 or 3 per year, depending on soil type and rainfall distribution, to reduce the risk of nutrient losses. In immature palms, the splitting is usually increased to 4 to 5 applications per year because of the use of various fertilizers that cannot be systematically combined together (Goh et al.2003; Banabas2007). The optimal frequency is therefore a compromise between the need to meet nutrient demand, labor cost, risk of nutrient losses, and logistical issues for transport and storage (Goh et al.2003). Fertilizers are normally applied after rainfall when the soil is wet, especially for urea to limit volatilization, but not during heavy rain pe-riods to avoid losses through leaching, runoff, and erosion. However, there are situations where labor availability is also an important factor which influences the timing of applica-tions (Banabas2007).
Empty fruit bunches are commonly returned directly to the plantation from the mill after oil extraction, with an addition of supplementary mineral N (Corley and Tinker2003). A plan-tation yielding 22 t of fresh fruit bunches per hectare would produce empty fruit bunches for only about 10 % of the ma-ture plantation area. This estimate results from the assump-tions that the weight of empty fruit bunches produced is 20 to 25 % of the weight of fresh fruit bunches processed (Corley and Tinker2003; Redshaw2003) and that the application rate of empty fruit bunches is 50 t.ha−1 (Redshaw2003). Thus, there is not enough empty fruit bunches for the whole planta-tion area and the preferential areas for spreading are those close to the mill and on relatively flat terrain, for reasons of cost and feasibility (Redshaw2003). Soils with low carbon content are also favored because empty fruit bunch inputs increase their organic matter content (Carcasses 2004, unpub-lished data). This uneven distribution of empty fruit bunches creates a spatial heterogeneity of organic N input at the plantation scale.
Under immature palms, empty fruit bunches are applied in a single layer immediately around the palms. Annual applica-tions of 15 to 60 t ha−1are common, and even larger rates of 80 t ha−1 may be used on an 18-month or 2-year cycle (Redshaw2003). Under mature palms, empty fruit bunches are usually spread in the harvest pathway or in some cases in between palms in the row in order to keep the weeded circle easily accessible for harvest. Application rates of 30 to 60 t ha−1are common (Banabas2007; Redshaw2003). The empty fruit bunches contain from 0.26 to 0.38 % N in fresh matter (0.65 to 0.94 % in dry matter) (Corley et al.1971; Singh et al.1982; Singh 1999; Gurmit et al. 1990, 1999;
Caliman et al.2001b). Empty fruit bunch application rates vary widely. Hence, the associated inputs of N are also very variable ranging from 39 to 228 kg N ha−1year−1under immature palms and from 78 to 228 kg N ha−1year−1under mature palms. In addition to direct application to fields, empty fruit bunches are also used to produce compost, with the advantage of reducing the volume of biomass to transport for field application. Empty fruit bunches are commonly mixed with palm oil mill effluent or urea, and the final N content of compost ranges from 1.5 to 2.7 % in dry matter (Lord et al. 2002; Siregar et al. 2002; Schuchardt et al.2002in Redshaw2003).
Palm oil mill effluent is often spread in the plantations following treatment in ponds. The treatment ponds are de-signed to decrease biological oxygen demand. Depending on the treatment, palm oil mill effluent contains from 0.92 to 1.2 kg N t−1 (Redshaw 2003; Corley and Tinker 2003; Corcodel et al.2003; Schmidt2007). The rate and frequency of application depend mainly on the maximal rate legally allowed and on the application system, but one reported ap-plication rate was about 375 t ha−1year−1split in three appli-cations (Carcasses 2004, unpublished data). At that rate, the inputs of N generated are rather high at approximately 345 to 450 kg N ha−1year−1. As for the empty fruit bunches, palm oil mill effluent is spread onto only a small portion of the whole plantation area, dictated by the application system and the distance between the mill and the field. Several application systems are used, such as gravity flow, pipe irrigation with a pump, or application by a tractor with a tanker (Lim 1999; Redshaw2003).
3.1.3 N depositions
The N inputs that are the most difficult to quantify and least well known are those from atmospheric (flux no. 4 in Fig.2) and sediment depositions. At a global scale, production of Nr, such as NH3and NOx, by lightning and volcanic activity is small (Galloway et al.1995; Mather et al.2004), but it may be significant in some oil palm-growing regions. To our knowl-edge, only measurements of wet deposition have been done in oil palm systems, i.e., for N contained in rain water (possibly including aerosols). Depositions were reported to range from 14.6 to 20 kg N ha−1 year−1 in Malaysia (Agamuthu and Broughton 1985; Chew et al.1999) and were measured at 8 kg N ha−1year−1in Brazil (Trebs et al.2006).
N inputs also result from the deposition of eroded particles of soil coming from upslope of the system studied. This flux concerns mainly lowland areas where the eroded soil from upper areas accumulates and hence it depends on the local topography. To our knowledge, no specific measurements of N deposition have been done to estimate this input flux in palm plantations. Finally, input of N to ecosystems from weathering of rocks is usually considered to be negligible. However, it is possible that it constitutes a significant input
if the geology consists of fine sedimentary rocks (Holloway and Dahlgren2002), given the intense weathering conditions of oil palm-growing regions.
In summary, N inputs were estimated, in kg N ha−1year−1, at 150, 0–206, 0–450, 8–20, for biological N fixation, mineral fertilizer, organic fertilizers, and atmospheric deposition, re-spectively. The results and references are synthesized in Table1.
3.2 Internal fluxes 3.2.1 N uptake
A major internal flux is the N uptake from soil by palms, legume cover crops, and other plants, mainly as inorganic N (NH4+and NO3−) (flux no. 5 in Fig.2). Uptake by plants other than palms and legumes may be significant because it is known to compete with palms and affect fresh fruit bunches production (Corley and Tinker2003). However, to our knowl-edge, no measurements of such uptake terms are available. For the legume cover, Agamuthu and Broughton (1985) estimated that 149 kg N ha−1year−1was taken up from the soil over the first 3 years of the oil palm cycle. For palms, two main reviews have reported estimates of N uptake (Xaviar2000; Goh and Härdter2003), with most of the work done on Dura palms in
Malaysia and Nigeria between the 1960s and 1990s. Other work was done more recently on Tenera palms in Sumatra (Foster and Parabowo2003). In all cases, estimates reported are not direct measurements of N uptake by roots but indirect estimates inferred from a nutrient budget approach. Thus, over the whole growth cycle, the net N uptake is considered to be equal to the N immobilized in the palm, above- and below-ground biomass; the N released in palm residues such as pruned fronds, removed inflorescences, frond bases, dead roots; and the N exported in harvested bunches.
The results reported by Xaviar (2000) and Goh and Härdter (2003) showed that uptake rate mainly depends on the age of the palms, with estimates of 40 kg N ha−1year−1for 0 to 3-year-old palms (Tan 1976, 1977) and ranging from 114 to 267 kg N ha−1year−1for 3 to 9-year-old palms (Ng 1977; Pushparajah and Chew1998; Henson1999; Ng et al.1999; Ng and Thamboo1967; Ng et al. 1968; Tan1976,1977). However, recent work has resulted in considerably higher es-timates of uptake by Tenera palms, up to 272 kg N ha−1year−1 in 10-year-old palms and even 380 kg N ha−1year−1in adult palms (Foster and Parabowo2003). Both studies considered only above-ground biomass in the budgets. This difference could be explained by the higher yields now obtained with current genotypes (Goh and Härdter2003). Recent measure-ments in trials in Indonesia showed uptake rates by
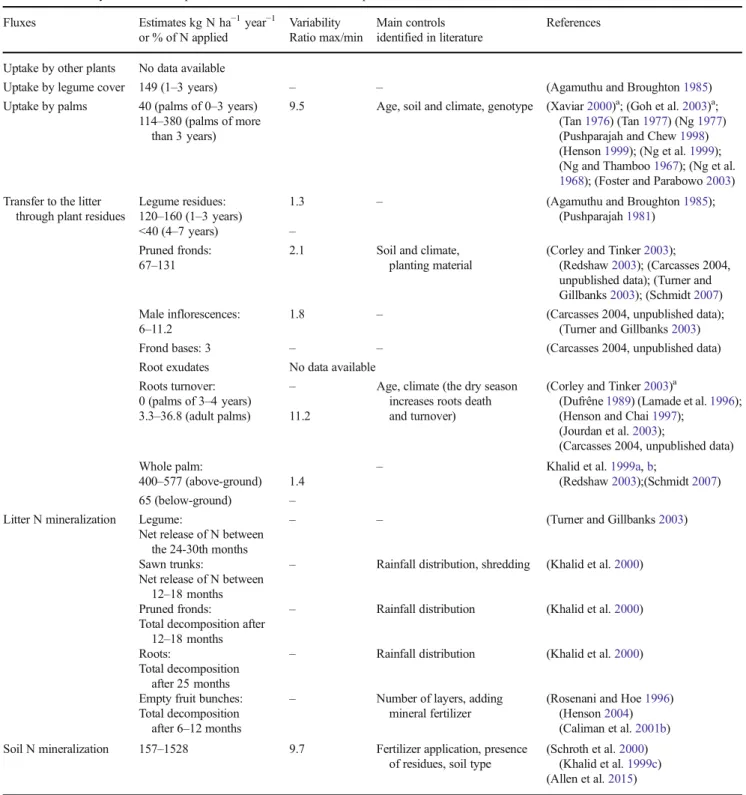
above-Table 1 Summary of N inputs estimates from the reviewed experimental data Fluxes Estimates kg N ha−1year−1 or % of N applied Variability Ratio max/min Main controls identified in literature References
Biological N fixation Endophytic: needs confirmation – – (Reis et al.2000); (Amir et al.2001) Non-symbiotic: 3.3–7.8 2.4 Increasing with temperature,
soil moisture, soil N scarcity
(Reed et al.2011) (tropical forest) Symbiotic: >150 (average over
the first 5 years)
1 N content in soils (Giller and Fairhurst2003)a; (Ruiz and
López2014)a; (Broughton et al. 1977); (Agamuthu and Broughton
1985); (Zaharah et al.1986) Fertilizer application Mineral: 48–90 in 4–5
applications (immature)
4.3 N foliar content (indirect factors: age, soil and climate, planting material)
(Henson2004) (Banabas2007) (Choo et al.2011) (Foster2003) (FAO2004) (Carcasses 2004, unpublished data) (Hansen2005) (United Plantations Berhad2006) (Wicke et al.2008)
56–206 in 2–3 applications (mature)
0 (2–3 years before replanting) – Empty fruit bunches:
0 in most fields 39–228 (immature)
– Age, distance to the mill, slope, soil fertility
(Banabas2007) (Redshaw2003)
78–228 (mature) 5.8
POME: 0 in some plots – Distance to the mill, laws (Carcasses 2004, unpublished data) 345–450 1.3
Atmospheric deposition
8 in Brazil 14.6–20 in Malaysia
2.5 Rainfalls, proximity of industries and volcanic activity
(Agamuthu and Broughton1985) (Chew et al.1999) (Trebs et al.2006) Sediment deposition No data available
Weathering of rocks No data available
a
g r o u n d b i o m a s s r a n g i n g f r o m a b o u t 2 2 1 t o 272 kg N ha−1year−1, depending on the planting material. In addition to genotype, variability of uptake seems to be linked with soil and climate conditions. For example, uptake was estimated at 149 kg N ha−1year−1in Nigerian conditions with a production of 9.7 t of fresh fruit bunches ha−1year−1(Tinker and Smilde1963) and at 191 kg N ha−1year−1in Malaysian conditions with a production of 24 t of fresh fruit bunches ha−1year−1(Ng and Thamboo1967; Ng et al.1968). 3.2.2 N from plant residues to the litter
Another major internal flux is the N contained in plant resi-dues, which goes from the plants to the litter (flux no. 6 in Fig.2). Residues come from the palms, legume cover crops, and other vegetation. For plants other than palms and legumes, to our knowledge no data is available. For legume cover, Agamuthu and Broughton (1985) estimated an amount of 123 kg N ha−1year−1going from the living plants to the litter over the first 3 years under oil palm and Pushparajah (1981) estimated an amount of about 120–160 kg N ha−1year−1over the first to the third years and less than 40 kg N ha−1year−1over the fourth to the seventh years under rubber trees. In both cases, root turnover was not taken into account. For palms, several residues are distinguished: those produced throughout the crop cycle, mostly in the mature phase such as pruned fronds, re-moved inflorescences, frond bases, root exudates, and dead roots and those produced only once before replanting, i.e., the whole palm when it is felled.
For pruned fronds, the flux of N depends on the quantity of fronds pruned and their N content. Frond production rate sta-bilizes after 8–12 years at about 20–24 fronds year−1(Corley and Tinker2003). Several publications estimated the annual flux of N going to the litter, with values ranging from 67 to 131 kg N ha−1 year−1 (Redshaw2003; Carcasses 2004, unpublished data; Turner and Gillbanks 2003; Schmidt
2007). Therefore, this flux is uncertain and the reasons for the variability are not well defined; they may depend on the soil, climate, and planting material which influence frond pro-duction and frond weight and on the methods of measurement of N content. For male inflorescences, the flux of N going to the litter has been ignored in most N cycling studies. We found only two estimates, being 6 and 11.2 kg N ha−1 year−1 (Carcasses 2004, unpublished data; Turner and Gillbanks
2003, respectively). These estimates suggest that this flux is lower than the uncertainty of the concomitant N flux via pruned fronds. For frond bases, which rot and fall naturally from the trunk, the only estimate we found was of 3 kg N ha−1year−1 going to the litter (Carcasses 2004, unpublished data).
For root exudates and transfers into the soil via Mycorrhizae, no estimate of N flux is available to our knowledge. Roots themselves are continuously dying and being replaced by new ones. This death of roots constitutes a
flux of N going from the palm to the litter pool and depends on the rate of root turnover and on the N content of roots when they die. Root turnover is very difficult to measure. Corley and Tinker (2003) reviewed several methods to estimate it such as deduction from measurements of soil carbon balance or mea-surements of the growth of roots after extracting soil cores and refilling the holes with root-free soil. Estimates of average turnover ranged from 1.03 to 11.5 t of dry matter ha−1year−1 for adult palms (Dufrêne1989; Lamade et al.1996; Henson and Chai1997; Jourdan et al.2003), and turnover was report-ed to be zero for 3–4-year-old palms (Henson and Chai1997). Thus, with an average root N content of 0.32 % of dry matter measured by Ng et al. (1968) in 8–15-year-old palms in
Malaysia, the average N flux from root turnover would range from 3.3 to 36.8 kg N ha−1year−1. (Carcasses 2004, unpub-lished data) also proposed the value of 7.5 kg N ha−1year−1 based on data from Henson and Chai (1997). Therefore, this flux is highly uncertain. Moreover, Corley and Tinker (2003) noted that root turnover measured in Malaysia was much low-er than that in Africa, which could be explained by the death of a larger part of the root system in Africa during the annual dry season (Forde1972).
Finally, the estimate of the N contained in the felled palms must take into account above- and below-ground biomasses. Several publications estimated the weight of dry matter of above-ground biomass of old palms at felling and the N con-tent of their different tissues, i.e., trunk, fronds, inflorescences, and frond bases (see for e.g., Corley and Tinker2003). Some of them reviewed available data to estimate the total N content of palms at felling and reported values ranging from 400 to 577 kg N ha−1(Khalid et al.1999a; Redshaw2003; Schmidt
2007). Fewer studies estimated the below-ground dry matter of palms, but Khalid et al. (1999b) reported a value of 65 kg N ha−1. Therefore, the total N contained in palms at felling and going to the litter has been estimated at 465 to 642 kg N ha−1.
3.2.3 N from the litter to the soil
Another important internal flux is the mineralization or incor-poration of N from the litter to the soil (flux no. 7 in Fig.2). The litter is composed mostly of plant residues but also con-tains active microorganisms and fauna. To our knowledge, no data is available regarding the decomposition of residues from plants other than oil palm or legumes in the oil palm system. For legume litter decomposition, Chiu (2004) measured losses of about 70 % of dry matter after about 2–3 months in leaves and stems of P. phaseoloides and M. bracteata. But the net N release follows a slower dynamic due to the immobilization of the N by the microbial fauna and flora involved in decomposition and the partial uptake of the N released by growing legumes. For instance, Vesterager et al. (1995) measured in a pot experiment with P. phaseoloides a
net release of about 25 % of the N of the legume litter after 2 months, using a15N labeling technique. In an oil palm field, Turner and Gillbanks (2003) reported that net N release from legume litter occurred between the 24th and the 30th months after planting.
For palm residues, no data was found for frond bases. For pruned fronds and felled and chipped trunks, Khalid et al. (2000) observed a loss of 50 % of dry matter after 6–8 months
and a total decomposition after 12–18 months. For roots, Khalid et al. (2000) observed a loss of 50 % of dry matter after 10 months and a total decomposition after about 25 months. These decomposition rates were considered as approximately linear by Khalid et al. (2000), but Moradi et al. (2014) observed an exponential decrease with a faster decomposition over the first 5 months. Khalid et al. (2000) identified rainfall distribution as the main climatic factor con-trolling the rate of decomposition and observed that shredded residues decompose faster than un-shredded residues. For empty fruit bunches, when mineral N fertilizer was also added, losses of 50 % of dry matter were reported after 2–3 months (Turner and Gillbanks2003; Lim and Zaharah2000; Rosenani and Hoe1996), and total decomposition occurred within 6 to 12 months (Rosenani and Hoe 1996; Henson
2004; Caliman et al.2001b). The decrease followed an expo-nential dynamic (Lim and Zaharah2000); the decomposition was faster when empty fruit bunches were applied in one layer than in two layers (Lim and Zaharah2000) and was slower without addition of mineral N (Caliman et al. 2001b). However, for all of these palm residues, the dynamics of N release is more complex than the dynamics of decomposition due to immobilization by the microbial fauna and flora involved in decomposition. For instance, for trunks, Kee (2004) observed that the net release of N occurred only 12 months after felling. For empty fruit bunches, Zaharah and Lim (2000) observed a complete N immobilization over their experimental period of about 8 months, and Caliman et al. (2001b) reported a N release of only 50 % at about 6 months, without adding mineral N.
The last internal flux considered is the mineralization of soil organic N (flux no. 8 in Fig. 2). Only few data are available, and they involve various soil depths, which hampers comparison. Schroth et al. (2000) estimated the net mineralization in the top 10 cm of a central Amazonian upland soil at approximately 157 kg N ha−1year−1after 15 years of oil palm production without any N fertilizer inputs. Khalid et al. (1999c) estimated the N mineralization after replanting in Malaysia at about 312 kg N ha−1 year−1in fields without residues from the previous cycle except dead roots and at about 421 kg N ha−1year−1in fields where the palm residues from the previous cycle were left on the soil. Finally, Allen et al. (2015) estimated the N mineralization in the top 5 cm of soil in Sumatra at about 920 kg N ha−1year−1in loam Acrisol and up to 1528 kg N ha−1year−1in clay Acrisol. However,
those measurements were done under more than 7-year-old oil palms established after logging, clearing, and burning of either forest or jungle rubber.
In summary, internal fluxes were estimated, in kg N ha−1 year−1, at 149, 40–380, 0–160, 76–182, and 157– 1528, for legume uptake, oil palm uptake, legume residues decomposition, oil palm residues decomposition, and soil N mineralization, and 465–642 for the decomposition of the felled palm at the end of the cycle. The results and references are synthesized in Table2.
3.3 Outputs
3.3.1 N exported in fresh fruit bunches
A major output is the N contained in fresh fruit bunches and exported during harvest (flux no. 9 in Fig.2). The N content of the fresh fruit bunches was reported to be around 2.89– 2.94 kg N t−1of fresh fruit bunches in fresh weight (Ng and Thamboo1967; Ng et al.1968; Hartley1988; in Corley and Tinker2003and Goh et al. 2003), but some higher values were also reported, as much as 6.4 kg N t−1fresh fruit bunches (Ng et al.1999). In general, the fresh fruit bunches production starts at about 2–3 years of age and increases rapidly until leveling off at yields around 10–34 t of fresh fruit bunches ha−1 year−1 after the tenth year (Tinker 1976; Corley and Tinker 2003). Some very high yields were also reported at around 40 t of fresh fruit bunches ha−1 year−1 (Kee et al.1998). Thus, the yield depends on the age of the palm, but it also differs with the type of planting material, soil, and climate conditions. For instance, yields were reported to be lower in Nigeria (9.6 t FBB ha−1year−1) than in Malaysia (24 t FBB ha−1 year−1) (Tinker1976). Therefore, for adult palms more than 10 years old producing 10 to 34 t of fresh fruit bunches ha−1year−1, we deduced an export of N through harvest of around 30 to 100 kg N ha−1year−1, consistent with other estimates done for Nigeria (Tinker and Smilde 1963) and Malaysia (Ng and Thamboo1967; Ng et al.1968). 3.3.2 N leaching
Soluble forms of N (NO3−and NH4+) can be lost by leaching out of the root zone (flux no. 10 in Fig.2). Tropical soils may have significant anion exchange capacity and thus retain NO3−(Rasiah et al.2003), but such anion exchange capacity is usually not significant within the root zone. As most of the oil palm root activity is located within 1 m depth (Ng et al.
2003; Corley and Tinker2003) and rainfalls are high in the tropics, this suggests a high potential risk of nutrient leaching under oil palm.
Many studies investigated the losses of N through leaching in plantations and were reviewed by Corley and Tinker (2003) and Comte et al. (2012). Most of the research was done in the
1980s and 1990s in Malaysia. Different plot-scale methods were used, such as lysimetric measurements, suction cup, and soil core sampling, and some studies were done at a larger scale with catchment sampling (e.g., Ah Tung et al.2009). The age of the palms is one of the main control variables which can be identified. The measured values varied over a wide range, from 1 to 34 % of N applied (Omoti et al.1983; Foong et al.1983;
Chang and Abas1986; Foong1993; Ng et al.1999; Henson
1999; Ah Tung et al.2009). Of the fertilizer N applied, 10.9 to 26.5 % was lost with palms less than 4 years old (Foong et al.
1983; Foong 1993) versus 1 to 4.8 % for palms older than 5 years (Foong et al. 1983; Foong 1993; Ah Tung et al.
2009). Only Omoti et al. (1983) reported losses of 34 % of N applied in Nigeria for palms from 4 to 22 years old.
Table 2 Summary of N internal inputs estimates from the reviewed experimental data Fluxes Estimates kg N ha−1year−1
or % of N applied Variability Ratio max/min Main controls identified in literature References
Uptake by other plants No data available
Uptake by legume cover 149 (1–3 years) – – (Agamuthu and Broughton1985) Uptake by palms 40 (palms of 0–3 years)
114–380 (palms of more than 3 years)
9.5 Age, soil and climate, genotype (Xaviar2000)a; (Goh et al.2003)a; (Tan1976) (Tan1977) (Ng1977) (Pushparajah and Chew1998) (Henson1999); (Ng et al.1999); (Ng and Thamboo1967); (Ng et al.
1968); (Foster and Parabowo2003) Transfer to the litter
through plant residues
Legume residues: 120–160 (1–3 years)
1.3 – (Agamuthu and Broughton1985); (Pushparajah1981)
<40 (4–7 years) – Pruned fronds:
67–131
2.1 Soil and climate, planting material
(Corley and Tinker2003);
(Redshaw2003); (Carcasses 2004, unpublished data); (Turner and Gillbanks2003); (Schmidt2007) Male inflorescences:
6–11.2
1.8 – (Carcasses 2004, unpublished data); (Turner and Gillbanks2003) Frond bases: 3 – – (Carcasses 2004, unpublished data) Root exudates No data available
Roots turnover: 0 (palms of 3–4 years)
– Age, climate (the dry season increases roots death and turnover)
(Corley and Tinker2003)a
(Dufrêne1989) (Lamade et al.1996); (Henson and Chai1997);
(Jourdan et al.2003);
(Carcasses 2004, unpublished data) 3.3–36.8 (adult palms) 11.2
Whole palm: – Khalid et al.1999a,b;
(Redshaw2003);(Schmidt2007) 400–577 (above-ground) 1.4
65 (below-ground) – Litter N mineralization Legume:
Net release of N between the 24-30th months
– – (Turner and Gillbanks2003)
Sawn trunks:
Net release of N between 12–18 months
– Rainfall distribution, shredding (Khalid et al.2000)
Pruned fronds:
Total decomposition after 12–18 months
– Rainfall distribution (Khalid et al.2000)
Roots:
Total decomposition after 25 months
– Rainfall distribution (Khalid et al.2000)
Empty fruit bunches: Total decomposition
after 6–12 months
– Number of layers, adding mineral fertilizer
(Rosenani and Hoe1996) (Henson2004) (Caliman et al.2001b) Soil N mineralization 157–1528 9.7 Fertilizer application, presence
of residues, soil type
(Schroth et al.2000) (Khalid et al.1999c) (Allen et al.2015)
a
In the conditions studied and despite very large variability, measurements hence showed that high losses through leaching are restricted to the first years of the palms, when the root systems are not fully developed and N inputs from decomposing plant residues are large. Moreover, fertilizer placement may have a significant effect on leaching because of the spatial variability of application rate, rainfall as through fall and stem flow, and N uptake (Banabas et al.2008; Schroth et al. 2000). However, there is little information about the spatial distribution of NO3−leaching within the plantation. 3.3.3 N losses through runoff and erosion
N can also be lost through runoff (flux no. 11 in Fig.2) and erosion (flux no. 12 in Fig.2) as a solute (NO3−and NH4+) or as eroded particles of soil containing N. Corley and Tinker (2003) and Comte et al. (2012) reviewed measurements of N losses through runoff and erosion from oil palm plantations. Research was done in Malaysia from the 1970s to the 1990s (Maena et al.1979; Kee and Chew1996) and more recently in Papua New Guinea (Banabas et al.2008) and Sumatra (Ribka
2014). The main variables studied were the effect of soil type, slope, and spatial heterogeneity resulting from management practices, such as soil cover management. The variability of reported values is less than for leaching, ranging from 2 to 15.6 % of N applied lost through runoff, and from 0.5 to 6.2 % of N applied lost through erosion (Maena et al.1979; Kee and Chew 1996). Spatial heterogeneity of soil cover seems to have an important effect on losses. Maena et al. (1979) reported losses through runoff of 2 % of N applied in frond piles, but 16 % of that applied in the harvest pathway. Ribka (2014) showed that 10 to 37 t of soil ha−1year−1were lost through erosion of bare soil, depending on slope, but this reduced to 2 to 4 t of soil ha−1year−1with a standard vegeta-tion cover and the same slopes.
These results indicated that soil cover has a significant effect on both runoff and erosion under oil palm. However, data is lacking concerning the transition between the felling of palms and the early development of young palms when the soil is not yet covered by the legume. Finally, it can be noted that in a given situation, there is a balance between runoff/ erosion losses and leaching losses, in which soil permeability plays an important role. For instance, in Papua New Guinea, Banabas et al.2008estimated losses through leaching at about 37–103 kg N ha−1year−1and negligible runoff, even with a high rainfall of 3000 mm year−1. The authors suggested that the high permeability of volcanic ash soils could favor leaching over runoff.
3.3.4 N gaseous losses
A potentially important gaseous output is the volatilization of NH3(flux no. 13 in Fig.2), which can occur directly from the
leaves and from soil after fertilizer application, especially urea. Regarding emissions from palm fronds and other vege-tation in the system, to our knowledge, no measurements have been reported. For emissions from soil following fertilizer application, several studies were done into urea efficiency under oil palm (e.g. Mohammed et al.,1991) but only a few measured NH3 volatilization. Most of them were done in Malaysia between the 1960s and the 1980s, and they often compared urea and ammonium sulfate, the most commonly used fertilizers in oil palm plantations. Two studies were done in Malaysia using different fertilizer rates (125 and 250 kg N ha−1year−1) and on different soil types. Reported volatilization rates from urea ranged from 11.2 to 42 % of N applied (14 to 105 kg N ha−1year−1), and volatilization from ammonium sulfate ranged from 0.1 to 0.4 % of N applied (0.1 to 0.5 kg N ha−1year−1) (Sinasamy et al. 1982; Chan and Chew1984). Another experiment was carried out in Peru by (Bouchet 2003, unpublished data) with a lower fertilization rate (85 kg N ha−1year−1). The study found that 4 to 16 % o f N a p p l i e d i n u r e a w a s v o l a t i l i z e d ( 3 . 4 t o 13.6 kg N ha−1year−1), with higher volatilization under veg-etation cover and no volatilization from ammonium sulfate. Therefore, given the few studies done and the high variability of the results, the magnitude of losses and the reasons for variations are uncertain. For urea, the highest values were in sandy loam soils with high application rates, and for ammo-nium sulfate the highest values were in clay soils with high application rates, but they did not exceed 1 % of N applied.
Gaseous emissions of N2O, NOx, and N2are produced by soil microorganisms, principally through nitrification and de-nitrification (flux no. 14 in Fig.2). Tropical soils are consid-ered as important sources of N2O due to rapid N cycling (Duxbury and Mosier 1993). As N2O and NOx emissions are difficult to measure and have a very high variability, very few measurements were carried out in oil palm (Corley and Tinker2003; Banabas et al.2008; Banabas et al.2008; Nelson et al.2010). Maybe due to the recent growing concern about greenhouse gases emissions, most of the measurements avail-able were done in the 2000s and most of them involved peatlands (e.g. Melling et al.2007). To our knowledge, only two trials were carried out under oil palm on mineral soils. They focused on N2O emissions and showed very variable results whose average values ranged from 0.01 to 7.3 kg N ha−1year−1. Emissions tended to decrease with the age of palms and to be higher in poorly drained soils. Potential N2O emissions are high in poorly drained soils due to limited N uptake by plants and conditions that are conducive for denitrification.
The first study showed N2O emissions ranging from 0.01 to 2.5 kg N ha−1year−1in Indonesia (Ishizuka et al.2005). The highest values were reported for young palms while the lowest were reported for old palms. Ishizuka suggested that the high emissions under young palms could result from the low
uptake of young palms being concomitant with the application of fertilizer and the fixation of N by the legume cover. Conversely, the low emissions under old palms could result from the higher N uptake by palms and the absence of legume cover. The results also indicated that in this area, the N2O emissions were mainly determined by soil moisture. The sec-ond study showed emissions ranging from 1.36 to 7.3 kg N ha−1year−1on two different soil types in Papua New Guinea (Banabas2007). Banabas explained the highest emissions as being related to poor drainage of the soil.
Despite the limited number of measurements in oil palm plantations on mineral soils and the high variability of results, emissions seem to be higher over the first years of the palms. In addition, they seem to be of the same order of magnitude as those under oil palm in peatlands, e.g., average of 1.2 kg N ha−1year−1(Melling et al.2007); under other crops in tropical conditions, e.g., average of 1.2 kg N ha−1year−1 (Bouwman et al.2002); and under tropical forest, e.g., average of 3 kg N ha−1year−1(Keller et al.1986). However, data is lacking on the effect of spatial heterogeneity of N2O emission drivers, such as fertilizer application, soil water content, and organic matter content. Moreover, no measurements of NOx and N2emissions have been reported for oil palm.
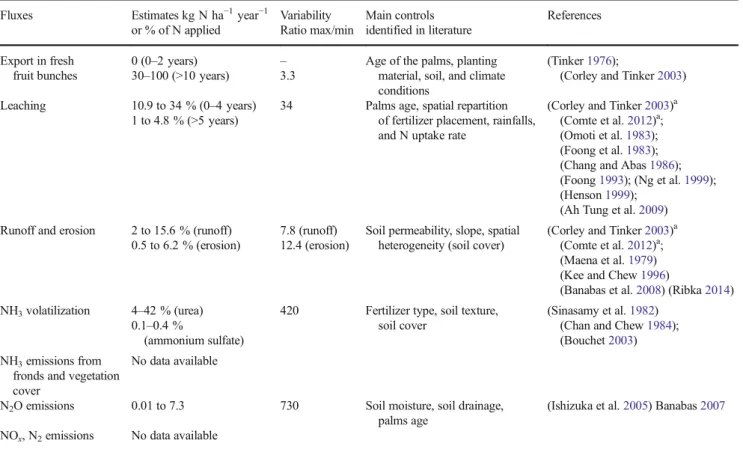
In summary, N outputs were estimated at 0–100 and 0.01– 7.3 kg N ha−1year−1through harvest and N2O emissions,
respectively, and in percentage of mineral N applied, 1–34, 2–15.6, 0.5–6.2, and 0.1–42, for leaching, runoff, erosion, and NH3volatilization, respectively. The largest losses are volatil-ization of NH3and leaching of NO3−. The results and refer-ences are synthesized in Table3.
4 Important fluxes and critical conditions for N losses
4.1 The most important and most uncertain fluxes Among the characterized fluxes, some are continuous, such as biological N fixation, N uptake, transfer of residues from plant to litter, and some are discontinuous. The discontinuous fluxes may occur one or several times per month, such as for export of fresh fruit bunches, pruning of fronds, leaching, runoff, and erosion during rainfall events; one or several times per year, such as for mineral and organic fertilizer application, NH3 volatilization after fertilizer application; or only once in the cycle, as for the felling of the whole palm (Fig.3). Therefore, when performing an N budget analysis in oil palm, the choice of the timescale influences the precision of the mechanisms taken into account. Moreover, the magnitude of some fluxes differs between the crop phases, e.g., mineral fertilizer appli-cation rate is about 48–90 kg N ha−1 year−1 on immature
Table 3 Summary of N outputs estimates from the reviewed experimental data Fluxes Estimates kg N ha−1year−1
or % of N applied Variability Ratio max/min Main controls identified in literature References Export in fresh fruit bunches 0 (0–2 years) 30–100 (>10 years) – 3.3
Age of the palms, planting material, soil, and climate conditions
(Tinker1976);
(Corley and Tinker2003) Leaching 10.9 to 34 % (0–4 years)
1 to 4.8 % (>5 years)
34 Palms age, spatial repartition of fertilizer placement, rainfalls, and N uptake rate
(Corley and Tinker2003)a (Comte et al.2012)a; (Omoti et al.1983); (Foong et al.1983); (Chang and Abas1986); (Foong1993); (Ng et al.1999); (Henson1999);
(Ah Tung et al.2009) Runoff and erosion 2 to 15.6 % (runoff)
0.5 to 6.2 % (erosion)
7.8 (runoff) 12.4 (erosion)
Soil permeability, slope, spatial heterogeneity (soil cover)
(Corley and Tinker2003)a (Comte et al.2012)a; (Maena et al.1979) (Kee and Chew1996)
(Banabas et al.2008) (Ribka2014) NH3volatilization 4–42 % (urea)
0.1–0.4 %
(ammonium sulfate)
420 Fertilizer type, soil texture, soil cover
(Sinasamy et al.1982) (Chan and Chew1984); (Bouchet2003) NH3emissions from
fronds and vegetation cover
No data available
N2O emissions 0.01 to 7.3 730 Soil moisture, soil drainage,
palms age
(Ishizuka et al.2005) Banabas2007
NOx, N2emissions No data available a
palms, 56–206 kg N ha−1year−1on mature palms, and may be zero on the oldest palms. Some fluxes occur only in one phase, such as the fluxes related to legume cover growth, which occur mainly over the first 5–7 years after planting. Thus, the crop phase should be taken into account to obtain a precise budget analysis.
The magnitude of some fluxes varies within fields because of the spatial heterogeneity of practices. For example, pruned fronds are placed in the windrows, and mineral fertilizer input depends on the method of fertilizer application but are usually spread around the weeded circle when applied manually. The effects of this spatially differentiated management on fluxes were evidenced in particular for runoff and erosion (Maena et al.1979; Ribka2014). Similar effects might be expected for leaching and N2O/NOx emissions but data is lacking. Moreover, the value of some fluxes varies between fields of
the same plantation. This is the case for the application of empty fruit bunches, which is applied to only about 10 % of the mature area (Redshaw2003). Thus, consideration of spa-tial heterogeneity of practices between and within fields is useful to obtain a precise budget analysis, but more research is needed for some of the fluxes.
On average, the largest N fluxes, of about 160– 640 kg N ha−1year−1, are the felling of palms at the end of the cycle, application of palm oil mill effluent, and soil N mineralization. The next largest fluxes, about 60– 270 kg N ha−1year−1, are uptake by the palms, application of empty fruit bunches, mineral fertilizer application, transfer of legume residues to litter, biological N fixation, and transfer of pruned fronds to litter. Although some of those fluxes occur only in some fields, e.g., palm oil mill effluent, only in one crop phase, e.g., biological N fixation and residues of legumes
Fig. 3 Summary of the temporal patterns of N fluxes in the oil palm plantation. N fluxes vary over the crop cycle, and N budget must take into account this temporal variability to be precise. Annual fluxes are estimated based on mean values from Table1and assuming a yield of 25 t of fresh fruit bunches ha−1year−1after 10 years, applications of
100 kg N ha−1year−1of mineral N fertilizer (75 % ammonium sulfate, 25 % urea), and of 184 kg N ha−1year−1of empty fruit bunches spread the first 2 years. The losses are estimated assuming that the nitrogen which entered the system is either exported through harvest or lost (no change in the N content of the soil over the whole cycle)
or only once in the cycle, e.g., felling of palms, we can note that the largest fluxes are internal fluxes. Moreover, there is a delay of about 6–30 months in the release of N from one pool to the next through microbial decomposition, e.g., for empty fruit bunches, pruned fronds, legume residues, whole palm, and dead roots. Therefore, internal fluxes and their dynamics may have important impacts on the availability of N for up-take or losses to the surrounding environment.
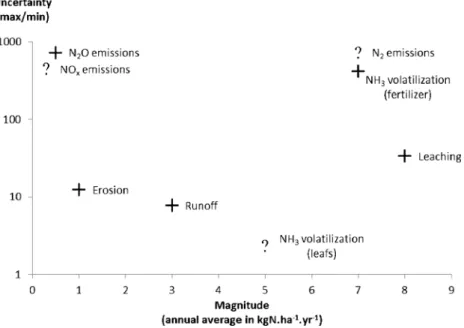
The most uncertain and least documented fluxes are N losses: N2O, NOx, N2emissions, leaching, volatilization, and runoff. These high uncertainties are partly due to the difficulty of measuring these fluxes which are gaseous emissions or below-ground flux. Studies also suggested that their variabil-ity was related to soil biogeochemical properties and may therefore be significantly controlled by the spatial heterogene-ity of soil properties and soil cover. An appraisal of the mag-nitude and uncertainty of N losses are presented in Fig.4.
In summary, the largest fluxes are internal fluxes, and the most uncertain and least documented fluxes are N losses: N2O, NOx, N2emissions, leaching, volatilization, and runoff. When compiling the N budget of oil palm systems, it is hence important to quantify the size and uncertainty of the most important fluxes, especially the internal fluxes. To reduce un-certainty, it is also important to characterize soil conditions and practices that induce high spatial variability in fluxes and understand the interactions between fluxes and between fluxes and management practices. In the following section, we focus on the main losses and their determinants.
4.2 Critical conditions for N losses
From the literature analysis, we deduced the main conditions that may lead to large N losses. In terms of timing, the imma-ture phase appears to be critical. In terms of spatial heteroge-neity, critical conditions occur mostly in areas with low or no soil cover and in areas where high amounts of organic and mineral fertilizers are applied (Table4).
During the immature phase, critical concomitant condi-tions may generate intense short-term losses. Disturbance of vegetation, litter, and soil during felling of old palms, sow-ing of legumes, and plantsow-ing of new palms have important impacts on soil physical properties. This may produce a peak of losses through runoff, erosion, and N2O/NOx emis-sions, as measurements suggested. However, some studies reported less leaching in oil palm under legume cover com-pared with other vegetation covers (Agamuthu and Broughton1985). This would support the idea that rather than enhancing N losses, growing legume cover might act as a regulator of the N content of the soil, immobilizing N when it is in sufficient supply in the soil and fixing N when it is lacking in the soil. Indeed, some studies showed that N fixation by legumes was significantly reduced when NO3− concentration in the soil was high (Pipai2014). As N losses during the immature phase are quite intense, their overall impact on the global plantation budget may be significant despite the short duration of the immature phase compared to the whole crop cycle.
Fig. 4 Uncertainty and magnitude of the N losses. NH3volatilization
from fertilizer and leaching have high magnitude and high uncertainty. N2O emissions have low magnitude but high variability. Uncertainties are
calculated as the max/min ratio (logarithmic scale), and magnitudes are annual averages in kg N ha−1year−1estimated assuming an application of 100 kg N ha−1year−1of mineral N fertilizer (see Tables1,2, and3for sources). When no quantified estimates were available, approximations of
uncertainty and magnitudes were done and are represented with a question mark. Uncertainty and magnitude of NOxand N2were
considered to be comparable to N2O, except for the magnitude of N2
which must be higher. Uncertainty and magnitude of NH3volatilization
from leaves were considered to be comparable to NH3volatilization from
Localization of critical conditions in particular parts of the plantations may generate large losses in small areas, which may become significant over the whole cycle. During the mature phase, inputs of mineral and organic fertilizers and palm residues are not applied evenly across the plantations. The high amounts of carbon and N they contain are applied over small areas, which may enhance the N cycling and might therefore generate hotspots of N losses in these areas. Large losses may occur in areas with little or no cover due to a lack of surface protection, e.g., in weeded circle and harvest pathway, as measurements showed. Moreover, the soil compaction of these areas may enhance N2O/NOx emissions (Ball et al. 2008; Bessou et al.2010). The combination of low surface cov-er with low root activity undcov-er the harvest pathway (Nelson et al. 2006) may favor losses through leaching in this area. But more research is needed to confirm it.
5 Discussion and key research needs
Determination of N losses and their impacts is complex, as reactive N undergoes and is influenced by many biological transformations and is widely dispersed by hydrologic and atmospheric transport (Galloway et al.2003). These difficul-ties are acute in the case of perennial cropping systems given
the long crop cycle and spatial and temporal patterns. Interactions in time and space additional to those discussed in this paper are also likely. For example, Agamuthu and Broughton (1985) suggested that the presence of legume cov-er during the immature phase could stimulate the rooting of palms through competition and hence reduce leaching during the mature phase. Schroth et al. (2000) noted that fertilizer placement may influence the roots’ lateral distribution. Thus, broadcast fertilizer application at young age may favor a more extensive lateral root development and therefore a more effi-cient uptake in the inter-tree space during the mature phase (Foster and Dolmat1986). Finally, Dubos and Flori (2014) recently reported that the response time of the soil-plant sys-tem to practices may be of several years.
We reviewed all studies on experiments and N flux analysis in oil palm plantations that could be found in the literature. Despite our effort to gather information from multiple sources, we suppose that more data may be available in company re-search reports or in national publications of producing coun-tries that were not accessible through the English language search engines examined here (Web of Knowledge, Science Direct, Agricola) nor through the authors’ network.
Finally, we explored common current management practices mostly in industrial plantations. More variability surely exists across a wider range of plantation types, especially in small-holder fields (40 % in Indonesia; >90 % in Thailand in Rival
Table 4 Spatio-temporal likelihood of significant N losses identified from the literature
Risks of losses due to critical conditions occurring in a same period or in a same area are represented in dark gray (high risk), light gray (medium risk), and white (low risk); potential risks of losses for which data is lacking are marked with question mark, and important factors influencing the risks are given. BNF biological nitrogen fixation